
 Login Sign Up


| |||||
 |  | ||||

| 12Stocks.com Market Intelligence |
Best SmallCap Stocks
|
| In a hurry? Small Cap Stock Lists: Performance Trends Table, Stock Charts
Sort Small Cap stocks: Daily, Weekly, Year-to-Date, Market Cap & Trends. Filter Small Cap stocks list by sector: Show all, Tech, Finance, Energy, Staples, Retail, Industrial, Materials, Utilities and HealthCare Filter Small Cap stocks list by size: All Large Medium Small and MicroCap |
| 12Stocks.com Small Cap Stocks Performances & Trends Daily | |||||||||
|
|  The overall Smart Investing & Trading Score is 70 (0-bearish to 100-bullish) which puts Small Cap index in short term neutral to bullish trend. The Smart Investing & Trading Score from previous trading session is 87 and hence a deterioration of trend.
| ||||||||
Here are the Smart Investing & Trading Scores of the most requested small cap stocks at 12Stocks.com (click stock name for detailed review):
|


| 12Stocks.com: Investing in Smallcap Index with Stocks | |
|
The following table helps investors and traders sort through current performance and trends (as measured by Smart Investing & Trading Score) of various
stocks in the Smallcap Index. Quick View: Move mouse or cursor over stock symbol (ticker) to view short-term technical chart and over stock name to view long term chart. Click on  to add stock symbol to your watchlist and to add stock symbol to your watchlist and  to view watchlist. Click on any ticker or stock name for detailed market intelligence report for that stock. to view watchlist. Click on any ticker or stock name for detailed market intelligence report for that stock. |
12Stocks.com Performance of Stocks in Smallcap Index
| Ticker | Stock Name | Watchlist | Category | Recent Price | Smart Investing & Trading Score | Change % | YTD Change% |
| DHX | DHI Group |   | Services & Goods | 2.74 | 74 | -3.18 | 5.79% |
| CDLX | Cardlytics | | Technology | 14.94 | 88 | -3.18 | 62.21% |
| OCUL | Ocular Therapeutix | | Health Care | 5.74 | 47 | -3.20 | 28.70% |
| EVEX | Eve Holding | | Industrials | 5.40 | 17 | -3.23 | -26.63% |
| COMP | Compass | | Technology | 3.29 | 8 | -3.24 | -11.68% |
| AVDX | AvidXchange | | Technology | 11.60 | 30 | -3.25 | -6.56% |
| ALLO | Allogene | | Health Care | 2.81 | 10 | -3.26 | -12.31% |
| RYTM | Rhythm | | Health Care | 38.06 | 32 | -3.27 | -17.21% |
| SNDX | Syndax | | Health Care | 22.42 | 67 | -3.28 | 3.75% |
| SST | System1 | | Industrials | 1.75 | 56 | -3.31 | -27.39% |
| DOCN | DigitalOcean | | Technology | 33.67 | 38 | -3.33 | -8.95% |
| RLAY | Relay | | Health Care | 6.51 | 32 | -3.34 | -40.77% |
| SLDP | Solid Power | | Industrials | 1.73 | 58 | -3.35 | 21.40% |
| ACHR | Archer Aviation | | Industrials | 3.73 | 25 | -3.37 | -39.05% |
| VTYX | Ventyx Biosciences | | Health Care | 4.45 | 25 | -3.37 | 79.80% |
| AVXL | Anavex Life | | Health Care | 3.71 | 67 | -3.39 | -60.15% |
| NRC | National Research | | Health Care | 34.45 | 32 | -3.42 | -12.92% |
| KZR | Kezar Life | | Health Care | 0.81 | 47 | -3.43 | -14.37% |
| DRH | DiamondRock Hospitality | | Financials | 8.42 | 0 | -3.44 | -10.33% |
| RDNT | RadNet | | Health Care | 50.66 | 93 | -3.45 | 45.70% |
| KNF | Knife River | | Materials | 76.16 | 41 | -3.45 | 14.53% |
| QNST | QuinStreet | | Technology | 18.75 | 93 | -3.50 | 46.26% |
| BLUE | bluebird bio | | Health Care | 0.97 | 47 | -3.53 | -29.40% |
| BIGC | BigCommerce | | Technology | 6.70 | 62 | -3.53 | -31.26% |
| NTLA | Intellia | | Health Care | 23.03 | 67 | -3.56 | -24.47% |


| Too many stocks? View smallcap stocks filtered by marketcap & sector |
| Marketcap: All SmallCap Stocks (default-no microcap), Large, Mid-Range, Small |
| Smallcap Sector: Tech, Finance, Energy, Staples, Retail, Industrial, Materials, & Medical |
|
Get the most comprehensive stock market coverage daily at 12Stocks.com ➞ Best Stocks Today ➞ Best Stocks Weekly ➞ Best Stocks Year-to-Date ➞ Best Stocks Trends ➞  Best Stocks Today 12Stocks.com Best Nasdaq Stocks ➞ Best S&P 500 Stocks ➞ Best Tech Stocks ➞ Best Biotech Stocks ➞ |
| Detailed Overview of SmallCap Stocks |
| SmallCap Technical Overview, Leaders & Laggards, Top SmallCap ETF Funds & Detailed SmallCap Stocks List, Charts, Trends & More |
| Smallcap: Technical Analysis, Trends & YTD Performance | |
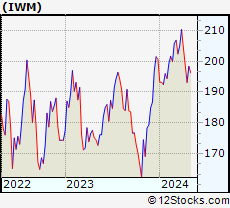
| SmallCap segment as represented by
IWM, an exchange-traded fund [ETF], holds basket of thousands of smallcap stocks from across all major sectors of the US stock market. The smallcap index (contains stocks like Riverbed & Sotheby's) is up by 1.57% and is currently underperforming the overall market by -6.48% year-to-date. Below is a quick view of technical charts and trends: | |
 IWM Weekly Chart |
|
| Long Term Trend: Deteriorating | |
| Medium Term Trend: Very Good | |
 IWM Daily Chart |
|
| Short Term Trend: Good | |
| Overall Trend Score: 70 | |
| YTD Performance: 1.57% | |
| **Trend Scores & Views Are Only For Educational Purposes And Not For Investing | |
| 12Stocks.com: Top Performing Small Cap Index Stocks | ||||||||||||||||||||||||||||||||||||||||||||||||
 The top performing Small Cap Index stocks year to date are
Now, more recently, over last week, the top performing Small Cap Index stocks on the move are


|
||||||||||||||||||||||||||||||||||||||||||||||||
| 12Stocks.com: Investing in Smallcap Index using Exchange Traded Funds | |
|
The following table shows list of key exchange traded funds (ETF) that
help investors track Smallcap index. The following list also includes leveraged ETF funds that track twice or thrice the daily returns of Smallcap indices. Short or inverse ETF funds move in the opposite direction to the index they track and are useful during market pullbacks or during bear markets. Quick View: Move mouse or cursor over ETF symbol (ticker) to view short-term technical chart and over ETF name to view long term chart. Click on ticker or stock name for detailed view. Click on to add stock symbol to your watchlist and to view watchlist. |
12Stocks.com List of ETFs that track Smallcap Index
| Ticker | ETF Name | Watchlist | Recent Price | Smart Investing & Trading Score | Change % | Week % | Year-to-date % |
| IWM | iShares Russell 2000 | | 203.86 | 70 | -0.54 | 0.97 | 1.57% |
| IJR | iShares Core S&P Small-Cap | | 108.25 | 58 | -0.34 | 1.05 | 0% |
| IWN | iShares Russell 2000 Value | | 155.30 | 76 | -0.21 | 0.71 | -0.02% |
| VTWO | Vanguard Russell 2000 ETF | | 82.40 | 57 | -0.53 | 0.97 | 1.6% |
| IWO | iShares Russell 2000 Growth | | 260.03 | 57 | -0.87 | 1.23 | 3.1% |
| IJS | iShares S&P Small-Cap 600 Value | | 99.75 | 40 | 0.07 | 1.04 | -3.22% |
| IJT | iShares S&P Small-Cap 600 Growth | | 129.03 | 71 | -0.62 | 0.99 | 3.11% |
| XSLV | PowerShares S&P SmallCap Low Volatil ETF | | 43.94 | 95 | -0.14 | 1.67 | -0.48% |
| SDD | ProShares UltraShort SmallCap600 | | 18.66 | 40 | 2.43 | -0.98 | 1.27% |
| SMLV | SPDR SSGA US Small Cap Low Volatil ETF | | 109.87 | 63 | -0.55 | 0.17 | -2.36% |
| SBB | ProShares Short SmallCap600 | | 16.11 | 25 | 0.91 | -0.28 | 1.16% |
| SAA | ProShares Ultra SmallCap600 | | 24.21 | 70 | -0.75 | 2.62 | -2.98% |
| 12Stocks.com: Charts, Trends, Fundamental Data and Performances of SmallCap Stocks | |
|
We now take in-depth look at all SmallCap stocks including charts, multi-period performances and overall trends (as measured by Smart Investing & Trading Score). One can sort SmallCap stocks (click link to choose) by Daily, Weekly and by Year-to-Date performances. Also, one can sort by size of the company or by market capitalization. |
| Select Your Default Chart Type: | |||||
| |||||
| Click on stock symbol or name for detailed view. Click on to add stock symbol to your watchlist and to view watchlist. Quick View: Move mouse or cursor over "Daily" to quickly view daily technical stock chart and over "Weekly" to view weekly technical stock chart. | |||||

 | DHX DHI Group, Inc. |
| Sector: Services & Goods | |
| SubSector: Staffing & Outsourcing Services | |
| MarketCap: 144.728 Millions | |
| Recent Price: 2.74 Smart Investing & Trading Score: 74 | |
| Day Percent Change: -3.18% Day Change: -0.09 | |
| Week Change: 3.01% Year-to-date Change: 5.8% | |
| DHX Links: Profile News Message Board | |
| Charts:- Daily , Weekly | |
| Add DHX to Watchlist: View: Get Complete DHX Trend Analysis ➞ | |
 | CDLX Cardlytics, Inc. |
| Sector: Technology | |
| SubSector: Internet Information Providers | |
| MarketCap: 855.48 Millions | |
| Recent Price: 14.94 Smart Investing & Trading Score: 88 | |
| Day Percent Change: -3.18% Day Change: -0.49 | |
| Week Change: 0.4% Year-to-date Change: 62.2% | |
| CDLX Links: Profile News Message Board | |
| Charts:- Daily , Weekly | |
| Add CDLX to Watchlist: View: Get Complete CDLX Trend Analysis ➞ | |
 | OCUL Ocular Therapeutix, Inc. |
| Sector: Health Care | |
| SubSector: Biotechnology | |
| MarketCap: 249.985 Millions | |
| Recent Price: 5.74 Smart Investing & Trading Score: 47 | |
| Day Percent Change: -3.20% Day Change: -0.19 | |
| Week Change: -6.97% Year-to-date Change: 28.7% | |
| OCUL Links: Profile News Message Board | |
| Charts:- Daily , Weekly | |
| Add OCUL to Watchlist: View: Get Complete OCUL Trend Analysis ➞ | |
 | EVEX Eve Holding, Inc. |
| Sector: Industrials | |
| SubSector: Aerospace & Defense | |
| MarketCap: 2830 Millions | |
| Recent Price: 5.40 Smart Investing & Trading Score: 17 | |
| Day Percent Change: -3.23% Day Change: -0.18 | |
| Week Change: -0.28% Year-to-date Change: -26.6% | |
| EVEX Links: Profile News Message Board | |
| Charts:- Daily , Weekly | |
| Add EVEX to Watchlist: View: Get Complete EVEX Trend Analysis ➞ | |
 | COMP Compass, Inc. |
| Sector: Technology | |
| SubSector: Software - Application | |
| MarketCap: 1580 Millions | |
| Recent Price: 3.29 Smart Investing & Trading Score: 8 | |
| Day Percent Change: -3.24% Day Change: -0.11 | |
| Week Change: -2.23% Year-to-date Change: -11.7% | |
| COMP Links: Profile News Message Board | |
| Charts:- Daily , Weekly | |
| Add COMP to Watchlist: View: Get Complete COMP Trend Analysis ➞ | |
 | AVDX AvidXchange Holdings, Inc. |
| Sector: Technology | |
| SubSector: Software - Infrastructure | |
| MarketCap: 2120 Millions | |
| Recent Price: 11.60 Smart Investing & Trading Score: 30 | |
| Day Percent Change: -3.25% Day Change: -0.39 | |
| Week Change: -4.33% Year-to-date Change: -6.6% | |
| AVDX Links: Profile News Message Board | |
| Charts:- Daily , Weekly | |
| Add AVDX to Watchlist: View: Get Complete AVDX Trend Analysis ➞ | |
 | ALLO Allogene Therapeutics, Inc. |
| Sector: Health Care | |
| SubSector: Biotechnology | |
| MarketCap: 2858.65 Millions | |
| Recent Price: 2.81 Smart Investing & Trading Score: 10 | |
| Day Percent Change: -3.26% Day Change: -0.10 | |
| Week Change: -8.31% Year-to-date Change: -12.3% | |
| ALLO Links: Profile News Message Board | |
| Charts:- Daily , Weekly | |
| Add ALLO to Watchlist: View: Get Complete ALLO Trend Analysis ➞ | |
 | RYTM Rhythm Pharmaceuticals, Inc. |
| Sector: Health Care | |
| SubSector: Biotechnology | |
| MarketCap: 643.685 Millions | |
| Recent Price: 38.06 Smart Investing & Trading Score: 32 | |
| Day Percent Change: -3.27% Day Change: -1.28 | |
| Week Change: -13.03% Year-to-date Change: -17.2% | |
| RYTM Links: Profile News Message Board | |
| Charts:- Daily , Weekly | |
| Add RYTM to Watchlist: View: Get Complete RYTM Trend Analysis ➞ | |
 | SNDX Syndax Pharmaceuticals, Inc. |
| Sector: Health Care | |
| SubSector: Biotechnology | |
| MarketCap: 365.985 Millions | |
| Recent Price: 22.42 Smart Investing & Trading Score: 67 | |
| Day Percent Change: -3.28% Day Change: -0.76 | |
| Week Change: 1.68% Year-to-date Change: 3.8% | |
| SNDX Links: Profile News Message Board | |
| Charts:- Daily , Weekly | |
| Add SNDX to Watchlist: View: Get Complete SNDX Trend Analysis ➞ | |
 | SST System1, Inc. |
| Sector: Industrials | |
| SubSector: Specialty Business Services | |
| MarketCap: 504 Millions | |
| Recent Price: 1.75 Smart Investing & Trading Score: 56 | |
| Day Percent Change: -3.31% Day Change: -0.06 | |
| Week Change: 0.29% Year-to-date Change: -27.4% | |
| SST Links: Profile News Message Board | |
| Charts:- Daily , Weekly | |
| Add SST to Watchlist: View: Get Complete SST Trend Analysis ➞ | |
 | DOCN DigitalOcean Holdings, Inc. |
| Sector: Technology | |
| SubSector: Software - Infrastructure | |
| MarketCap: 3620 Millions | |
| Recent Price: 33.67 Smart Investing & Trading Score: 38 | |
| Day Percent Change: -3.33% Day Change: -1.16 | |
| Week Change: -1.23% Year-to-date Change: -9.0% | |
| DOCN Links: Profile News Message Board | |
| Charts:- Daily , Weekly | |
| Add DOCN to Watchlist: View: Get Complete DOCN Trend Analysis ➞ | |
 | RLAY Relay Therapeutics, Inc. |
| Sector: Health Care | |
| SubSector: Biotechnology | |
| MarketCap: 45887 Millions | |
| Recent Price: 6.51 Smart Investing & Trading Score: 32 | |
| Day Percent Change: -3.34% Day Change: -0.23 | |
| Week Change: -7.19% Year-to-date Change: -40.8% | |
| RLAY Links: Profile News Message Board | |
| Charts:- Daily , Weekly | |
| Add RLAY to Watchlist: View: Get Complete RLAY Trend Analysis ➞ | |
 | SLDP Solid Power, Inc. |
| Sector: Industrials | |
| SubSector: Electrical Equipment & Parts | |
| MarketCap: 445 Millions | |
| Recent Price: 1.73 Smart Investing & Trading Score: 58 | |
| Day Percent Change: -3.35% Day Change: -0.06 | |
| Week Change: -4.16% Year-to-date Change: 21.4% | |
| SLDP Links: Profile News Message Board | |
| Charts:- Daily , Weekly | |
| Add SLDP to Watchlist: View: Get Complete SLDP Trend Analysis ➞ | |
 | ACHR Archer Aviation Inc. |
| Sector: Industrials | |
| SubSector: Aerospace & Defense | |
| MarketCap: 976 Millions | |
| Recent Price: 3.73 Smart Investing & Trading Score: 25 | |
| Day Percent Change: -3.37% Day Change: -0.13 | |
| Week Change: -4.97% Year-to-date Change: -39.1% | |
| ACHR Links: Profile News Message Board | |
| Charts:- Daily , Weekly | |
| Add ACHR to Watchlist: View: Get Complete ACHR Trend Analysis ➞ | |
 | VTYX Ventyx Biosciences, Inc. |
| Sector: Health Care | |
| SubSector: Biotechnology | |
| MarketCap: 1950 Millions | |
| Recent Price: 4.45 Smart Investing & Trading Score: 25 | |
| Day Percent Change: -3.37% Day Change: -0.16 | |
| Week Change: -9.74% Year-to-date Change: 79.8% | |
| VTYX Links: Profile News Message Board | |
| Charts:- Daily , Weekly | |
| Add VTYX to Watchlist: View: Get Complete VTYX Trend Analysis ➞ | |
 | AVXL Anavex Life Sciences Corp. |
| Sector: Health Care | |
| SubSector: Biotechnology | |
| MarketCap: 175.985 Millions | |
| Recent Price: 3.71 Smart Investing & Trading Score: 67 | |
| Day Percent Change: -3.39% Day Change: -0.13 | |
| Week Change: -3.64% Year-to-date Change: -60.2% | |
| AVXL Links: Profile News Message Board | |
| Charts:- Daily , Weekly | |
| Add AVXL to Watchlist: View: Get Complete AVXL Trend Analysis ➞ | |
 | NRC National Research Corporation |
| Sector: Health Care | |
| SubSector: Medical Laboratories & Research | |
| MarketCap: 1187.7 Millions | |
| Recent Price: 34.45 Smart Investing & Trading Score: 32 | |
| Day Percent Change: -3.42% Day Change: -1.22 | |
| Week Change: -1.2% Year-to-date Change: -12.9% | |
| NRC Links: Profile News Message Board | |
| Charts:- Daily , Weekly | |
| Add NRC to Watchlist: View: Get Complete NRC Trend Analysis ➞ | |
 | KZR Kezar Life Sciences, Inc. |
| Sector: Health Care | |
| SubSector: Biotechnology | |
| MarketCap: 174.885 Millions | |
| Recent Price: 0.81 Smart Investing & Trading Score: 47 | |
| Day Percent Change: -3.43% Day Change: -0.03 | |
| Week Change: -5.38% Year-to-date Change: -14.4% | |
| KZR Links: Profile News Message Board | |
| Charts:- Daily , Weekly | |
| Add KZR to Watchlist: View: Get Complete KZR Trend Analysis ➞ | |
 | DRH DiamondRock Hospitality Company |
| Sector: Financials | |
| SubSector: REIT - Hotel/Motel | |
| MarketCap: 964 Millions | |
| Recent Price: 8.42 Smart Investing & Trading Score: 0 | |
| Day Percent Change: -3.44% Day Change: -0.30 | |
| Week Change: -4.64% Year-to-date Change: -10.3% | |
| DRH Links: Profile News Message Board | |
| Charts:- Daily , Weekly | |
| Add DRH to Watchlist: View: Get Complete DRH Trend Analysis ➞ | |
 | RDNT RadNet, Inc. |
| Sector: Health Care | |
| SubSector: Medical Laboratories & Research | |
| MarketCap: 473.2 Millions | |
| Recent Price: 50.66 Smart Investing & Trading Score: 93 | |
| Day Percent Change: -3.45% Day Change: -1.81 | |
| Week Change: -1.05% Year-to-date Change: 45.7% | |
| RDNT Links: Profile News Message Board | |
| Charts:- Daily , Weekly | |
| Add RDNT to Watchlist: View: Get Complete RDNT Trend Analysis ➞ | |
 | KNF Knife River Corporation |
| Sector: Materials | |
| SubSector: Building Materials | |
| MarketCap: 2570 Millions | |
| Recent Price: 76.16 Smart Investing & Trading Score: 41 | |
| Day Percent Change: -3.45% Day Change: -2.72 | |
| Week Change: -3.93% Year-to-date Change: 14.5% | |
| KNF Links: Profile News Message Board | |
| Charts:- Daily , Weekly | |
| Add KNF to Watchlist: View: Get Complete KNF Trend Analysis ➞ | |
 | QNST QuinStreet, Inc. |
| Sector: Technology | |
| SubSector: Internet Software & Services | |
| MarketCap: 411.791 Millions | |
| Recent Price: 18.75 Smart Investing & Trading Score: 93 | |
| Day Percent Change: -3.50% Day Change: -0.68 | |
| Week Change: -0.79% Year-to-date Change: 46.3% | |
| QNST Links: Profile News Message Board | |
| Charts:- Daily , Weekly | |
| Add QNST to Watchlist: View: Get Complete QNST Trend Analysis ➞ | |
 | BLUE bluebird bio, Inc. |
| Sector: Health Care | |
| SubSector: Biotechnology | |
| MarketCap: 3365.05 Millions | |
| Recent Price: 0.97 Smart Investing & Trading Score: 47 | |
| Day Percent Change: -3.53% Day Change: -0.04 | |
| Week Change: 8.28% Year-to-date Change: -29.4% | |
| BLUE Links: Profile News Message Board | |
| Charts:- Daily , Weekly | |
| Add BLUE to Watchlist: View: Get Complete BLUE Trend Analysis ➞ | |
 | BIGC BigCommerce Holdings, Inc. |
| Sector: Technology | |
| SubSector: Software Application | |
| MarketCap: 47587 Millions | |
| Recent Price: 6.70 Smart Investing & Trading Score: 62 | |
| Day Percent Change: -3.53% Day Change: -0.25 | |
| Week Change: 12.33% Year-to-date Change: -31.3% | |
| BIGC Links: Profile News Message Board | |
| Charts:- Daily , Weekly | |
| Add BIGC to Watchlist: View: Get Complete BIGC Trend Analysis ➞ | |
 | NTLA Intellia Therapeutics, Inc. |
| Sector: Health Care | |
| SubSector: Biotechnology | |
| MarketCap: 707.185 Millions | |
| Recent Price: 23.03 Smart Investing & Trading Score: 67 | |
| Day Percent Change: -3.56% Day Change: -0.85 | |
| Week Change: -2.42% Year-to-date Change: -24.5% | |
| NTLA Links: Profile News Message Board | |
| Charts:- Daily , Weekly | |
| Add NTLA to Watchlist: View: Get Complete NTLA Trend Analysis ➞ | |
| Too many stocks? View smallcap stocks filtered by marketcap & sector |
| Marketcap: All SmallCap Stocks (default-no microcap), Large, Mid-Range, Small & MicroCap |
| Sector: Tech, Finance, Energy, Staples, Retail, Industrial, Materials, Utilities & Medical |
|
Best Stocks Today 12Stocks.com |
© 2024 12Stocks.com Terms & Conditions Privacy Contact Us
All Information Provided Only For Education And Not To Be Used For Investing or Trading. See Terms & Conditions


One More Thing ... Get Best Stocks Delivered Daily!
Never Ever Miss A Move With Our Top Ten Stocks Lists
Find Best Stocks In Any Market - Bull or Bear Market
Take A Peek At Our Top Ten Stocks Lists: Daily, Weekly, Year-to-Date & Top Trends
Find Best Stocks In Any Market - Bull or Bear Market
Take A Peek At Our Top Ten Stocks Lists: Daily, Weekly, Year-to-Date & Top Trends
Smallcap Stocks With Best Up Trends [0-bearish to 100-bullish]: Cricut [100], DASAN Zhone[100], Latham Group[100], Hyster-Yale Materials[100], Myriad Genetics[100], Alpha and[100], Vigil Neuroscience[100], Hannon Armstrong[100], Ardmore Shipping[100], Inogen [100], Payoneer Global[100]
Best Smallcap Stocks Year-to-Date:
CareMax [580.41%], Janux [415.82%], Viking [329.77%], Bakkt [295.29%], Longboard [255.4%], Alpine Immune[239.73%], Vera [190.25%], Super Micro[189.4%], Avidity Biosciences[188.27%], Cullinan Oncology[172%], Arcutis Bio[146.28%] Best Smallcap Stocks This Week:
DASAN Zhone[64.32%], Innodata [55.88%], Perficient [52.92%], Cricut [42.32%], Vigil Neuroscience[39.52%], Thoughtworks Holding[36.89%], Latham Group[35.9%], Great Lakes[32.18%], Bakkt [31.96%], Outset Medical[31.95%], P3 Health[27.95%] Best Smallcap Stocks Daily:
Innodata [55.42%], Cricut [47.47%], DASAN Zhone[30.11%], Latham Group[24.08%], Hyster-Yale Materials[23.52%], iRobot [21.40%], Myriad Genetics[21.13%], Ameresco [21.11%], Bakkt [20.92%], Alpha and[20.78%], Vigil Neuroscience[18.97%]