
 Login Sign Up


| |||||
 |  | ||||

| 12Stocks.com Market Intelligence |
Best SmallCap Stocks
|
| In a hurry? Small Cap Stock Lists: Performance Trends Table, Stock Charts
Sort Small Cap stocks: Daily, Weekly, Year-to-Date, Market Cap & Trends. Filter Small Cap stocks list by sector: Show all, Tech, Finance, Energy, Staples, Retail, Industrial, Materials, Utilities and HealthCare Filter Small Cap stocks list by size: All Large Medium Small and MicroCap |
| 12Stocks.com Small Cap Stocks Performances & Trends Daily | |||||||||
|
|  The overall Smart Investing & Trading Score is 70 (0-bearish to 100-bullish) which puts Small Cap index in short term neutral to bullish trend. The Smart Investing & Trading Score from previous trading session is 87 and hence a deterioration of trend.
| ||||||||
Here are the Smart Investing & Trading Scores of the most requested small cap stocks at 12Stocks.com (click stock name for detailed review):
|


| 12Stocks.com: Investing in Smallcap Index with Stocks | |
|
The following table helps investors and traders sort through current performance and trends (as measured by Smart Investing & Trading Score) of various
stocks in the Smallcap Index. Quick View: Move mouse or cursor over stock symbol (ticker) to view short-term technical chart and over stock name to view long term chart. Click on  to add stock symbol to your watchlist and to add stock symbol to your watchlist and  to view watchlist. Click on any ticker or stock name for detailed market intelligence report for that stock. to view watchlist. Click on any ticker or stock name for detailed market intelligence report for that stock. |
12Stocks.com Performance of Stocks in Smallcap Index
| Ticker | Stock Name | Watchlist | Category | Recent Price | Smart Investing & Trading Score | Change % | YTD Change% |
| PARR | Par Pacific |   | Energy | 29.07 | 0 | -2.35 | -20.07% |
| FSLY | Fastly | | Technology | 8.31 | 10 | -2.35 | -53.31% |
| GIII | G-III Apparel | | Consumer Staples | 27.73 | 25 | -2.36 | -18.39% |
| ONTO | Onto Innovation | | Technology | 206.15 | 88 | -2.36 | 34.83% |
| NARI | Inari Medical | | Health Care | 41.80 | 43 | -2.36 | -35.63% |
| ATRI | Atrion | | Health Care | 407.26 | 66 | -2.38 | 7.52% |
| LLAP | Terran Orbital | | Industrials | 1.02 | 15 | -2.38 | -10.48% |
| CVGW | Calavo Growers | | Consumer Staples | 27.88 | 42 | -2.40 | -5.22% |
| RM | Regional Management | | Financials | 29.71 | 93 | -2.40 | 18.46% |
| RVNC | Revance | | Health Care | 4.28 | 74 | -2.40 | -51.37% |
| AKTS | Akoustis | | Technology | 0.59 | 57 | -2.40 | -29.78% |
| HLLY | Holley | | Services & Goods | 4.07 | 42 | -2.40 | -18.03% |
| SCPH | sc | | Health Care | 4.85 | 67 | -2.41 | -22.65% |
| TREE | LendingTree | | Financials | 47.74 | 63 | -2.42 | 57.47% |
| KRYS | Krystal Biotech | | Health Care | 157.68 | 71 | -2.42 | 27.10% |
| NRDS | NerdWallet | | Financials | 14.14 | 62 | -2.42 | -5.35% |
| PTLO | Portillos | | Services & Goods | 10.35 | 0 | -2.45 | -35.51% |
| EMBC | Embecta | | Health Care | 10.29 | 60 | -2.46 | -46.14% |
| SFIX | Stitch Fix | | Services & Goods | 2.15 | 37 | -2.49 | -39.78% |
| RXST | RxSight | | Health Care | 60.64 | 93 | -2.49 | 51.18% |
| EB | Eventbrite | | Technology | 5.45 | 45 | -2.50 | -34.81% |
| DDS | Dillard s | | Services & Goods | 423.47 | 41 | -2.52 | 4.91% |
| PEB | Pebblebrook Hotel | | Financials | 14.30 | 8 | -2.52 | -10.51% |
| ALDX | Aldeyra | | Health Care | 4.07 | 74 | -2.52 | 15.81% |
| ACVA | ACV Auctions | | Services & Goods | 17.31 | 8 | -2.53 | 14.94% |


| Too many stocks? View smallcap stocks filtered by marketcap & sector |
| Marketcap: All SmallCap Stocks (default-no microcap), Large, Mid-Range, Small |
| Smallcap Sector: Tech, Finance, Energy, Staples, Retail, Industrial, Materials, & Medical |
|
Get the most comprehensive stock market coverage daily at 12Stocks.com ➞ Best Stocks Today ➞ Best Stocks Weekly ➞ Best Stocks Year-to-Date ➞ Best Stocks Trends ➞  Best Stocks Today 12Stocks.com Best Nasdaq Stocks ➞ Best S&P 500 Stocks ➞ Best Tech Stocks ➞ Best Biotech Stocks ➞ |
| Detailed Overview of SmallCap Stocks |
| SmallCap Technical Overview, Leaders & Laggards, Top SmallCap ETF Funds & Detailed SmallCap Stocks List, Charts, Trends & More |
| Smallcap: Technical Analysis, Trends & YTD Performance | |
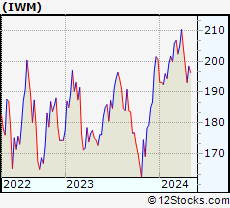
| SmallCap segment as represented by
IWM, an exchange-traded fund [ETF], holds basket of thousands of smallcap stocks from across all major sectors of the US stock market. The smallcap index (contains stocks like Riverbed & Sotheby's) is up by 1.53% and is currently underperforming the overall market by -6.51% year-to-date. Below is a quick view of technical charts and trends: | |
 IWM Weekly Chart |
|
| Long Term Trend: Deteriorating | |
| Medium Term Trend: Very Good | |
 IWM Daily Chart |
|
| Short Term Trend: Good | |
| Overall Trend Score: 70 | |
| YTD Performance: 1.53% | |
| **Trend Scores & Views Are Only For Educational Purposes And Not For Investing | |
| 12Stocks.com: Top Performing Small Cap Index Stocks | ||||||||||||||||||||||||||||||||||||||||||||||||
 The top performing Small Cap Index stocks year to date are
Now, more recently, over last week, the top performing Small Cap Index stocks on the move are


|
||||||||||||||||||||||||||||||||||||||||||||||||
| 12Stocks.com: Investing in Smallcap Index using Exchange Traded Funds | |
|
The following table shows list of key exchange traded funds (ETF) that
help investors track Smallcap index. The following list also includes leveraged ETF funds that track twice or thrice the daily returns of Smallcap indices. Short or inverse ETF funds move in the opposite direction to the index they track and are useful during market pullbacks or during bear markets. Quick View: Move mouse or cursor over ETF symbol (ticker) to view short-term technical chart and over ETF name to view long term chart. Click on ticker or stock name for detailed view. Click on to add stock symbol to your watchlist and to view watchlist. |
12Stocks.com List of ETFs that track Smallcap Index
| Ticker | ETF Name | Watchlist | Recent Price | Smart Investing & Trading Score | Change % | Week % | Year-to-date % |
| IWM | iShares Russell 2000 | | 203.78 | 70 | -0.58 | 0.93 | 1.53% |
| IJR | iShares Core S&P Small-Cap | | 108.26 | 58 | -0.33 | 1.05 | 0.01% |
| IWN | iShares Russell 2000 Value | | 155.37 | 76 | -0.17 | 0.75 | 0.03% |
| VTWO | Vanguard Russell 2000 ETF | | 82.40 | 57 | -0.53 | 0.97 | 1.6% |
| IWO | iShares Russell 2000 Growth | | 260.10 | 57 | -0.84 | 1.26 | 3.12% |
| IJS | iShares S&P Small-Cap 600 Value | | 99.80 | 40 | 0.12 | 1.09 | -3.17% |
| IJT | iShares S&P Small-Cap 600 Growth | | 129.03 | 71 | -0.62 | 0.99 | 3.11% |
| XSLV | PowerShares S&P SmallCap Low Volatil ETF | | 43.94 | 95 | -0.14 | 1.67 | -0.48% |
| SMLV | SPDR SSGA US Small Cap Low Volatil ETF | | 110.32 | 63 | -0.15 | 0.57 | -1.96% |
| SDD | ProShares UltraShort SmallCap600 | | 18.66 | 40 | 2.43 | -0.98 | 1.27% |
| SBB | ProShares Short SmallCap600 | | 16.08 | 25 | 0.69 | -0.5 | 0.94% |
| SAA | ProShares Ultra SmallCap600 | | 24.21 | 70 | -0.75 | 2.62 | -2.98% |
| 12Stocks.com: Charts, Trends, Fundamental Data and Performances of SmallCap Stocks | |
|
We now take in-depth look at all SmallCap stocks including charts, multi-period performances and overall trends (as measured by Smart Investing & Trading Score). One can sort SmallCap stocks (click link to choose) by Daily, Weekly and by Year-to-Date performances. Also, one can sort by size of the company or by market capitalization. |
| Select Your Default Chart Type: | |||||
| |||||
| Click on stock symbol or name for detailed view. Click on to add stock symbol to your watchlist and to view watchlist. Quick View: Move mouse or cursor over "Daily" to quickly view daily technical stock chart and over "Weekly" to view weekly technical stock chart. | |||||

 | PARR Par Pacific Holdings, Inc. |
| Sector: Energy | |
| SubSector: Oil & Gas Refining & Marketing | |
| MarketCap: 443.154 Millions | |
| Recent Price: 29.07 Smart Investing & Trading Score: 0 | |
| Day Percent Change: -2.35% Day Change: -0.70 | |
| Week Change: -5.74% Year-to-date Change: -20.1% | |
| PARR Links: Profile News Message Board | |
| Charts:- Daily , Weekly | |
| Add PARR to Watchlist: View: Get Complete PARR Trend Analysis ➞ | |
 | FSLY Fastly, Inc. |
| Sector: Technology | |
| SubSector: Application Software | |
| MarketCap: 1973.72 Millions | |
| Recent Price: 8.31 Smart Investing & Trading Score: 10 | |
| Day Percent Change: -2.35% Day Change: -0.20 | |
| Week Change: -2% Year-to-date Change: -53.3% | |
| FSLY Links: Profile News Message Board | |
| Charts:- Daily , Weekly | |
| Add FSLY to Watchlist: View: Get Complete FSLY Trend Analysis ➞ | |
 | GIII G-III Apparel Group, Ltd. |
| Sector: Consumer Staples | |
| SubSector: Textile - Apparel Clothing | |
| MarketCap: 354.365 Millions | |
| Recent Price: 27.73 Smart Investing & Trading Score: 25 | |
| Day Percent Change: -2.36% Day Change: -0.67 | |
| Week Change: -3.01% Year-to-date Change: -18.4% | |
| GIII Links: Profile News Message Board | |
| Charts:- Daily , Weekly | |
| Add GIII to Watchlist: View: Get Complete GIII Trend Analysis ➞ | |
 | ONTO Onto Innovation Inc. |
| Sector: Technology | |
| SubSector: Semiconductor Equipment & Materials | |
| MarketCap: 1187.18 Millions | |
| Recent Price: 206.15 Smart Investing & Trading Score: 88 | |
| Day Percent Change: -2.36% Day Change: -4.98 | |
| Week Change: 2.66% Year-to-date Change: 34.8% | |
| ONTO Links: Profile News Message Board | |
| Charts:- Daily , Weekly | |
| Add ONTO to Watchlist: View: Get Complete ONTO Trend Analysis ➞ | |
 | NARI Inari Medical, Inc. |
| Sector: Health Care | |
| SubSector: Medical Devices | |
| MarketCap: 33287 Millions | |
| Recent Price: 41.80 Smart Investing & Trading Score: 43 | |
| Day Percent Change: -2.36% Day Change: -1.01 | |
| Week Change: -0.48% Year-to-date Change: -35.6% | |
| NARI Links: Profile News Message Board | |
| Charts:- Daily , Weekly | |
| Add NARI to Watchlist: View: Get Complete NARI Trend Analysis ➞ | |
 | ATRI Atrion Corporation |
| Sector: Health Care | |
| SubSector: Medical Instruments & Supplies | |
| MarketCap: 1234.6 Millions | |
| Recent Price: 407.26 Smart Investing & Trading Score: 66 | |
| Day Percent Change: -2.38% Day Change: -9.94 | |
| Week Change: -1.85% Year-to-date Change: 7.5% | |
| ATRI Links: Profile News Message Board | |
| Charts:- Daily , Weekly | |
| Add ATRI to Watchlist: View: Get Complete ATRI Trend Analysis ➞ | |
 | LLAP Terran Orbital Corporation |
| Sector: Industrials | |
| SubSector: Aerospace & Defense | |
| MarketCap: 206 Millions | |
| Recent Price: 1.02 Smart Investing & Trading Score: 15 | |
| Day Percent Change: -2.38% Day Change: -0.03 | |
| Week Change: -4.65% Year-to-date Change: -10.5% | |
| LLAP Links: Profile News Message Board | |
| Charts:- Daily , Weekly | |
| Add LLAP to Watchlist: View: Get Complete LLAP Trend Analysis ➞ | |
 | CVGW Calavo Growers, Inc. |
| Sector: Consumer Staples | |
| SubSector: Farm Products | |
| MarketCap: 935.287 Millions | |
| Recent Price: 27.88 Smart Investing & Trading Score: 42 | |
| Day Percent Change: -2.40% Day Change: -0.68 | |
| Week Change: -1.43% Year-to-date Change: -5.2% | |
| CVGW Links: Profile News Message Board | |
| Charts:- Daily , Weekly | |
| Add CVGW to Watchlist: View: Get Complete CVGW Trend Analysis ➞ | |
 | RM Regional Management Corp. |
| Sector: Financials | |
| SubSector: Credit Services | |
| MarketCap: 148.008 Millions | |
| Recent Price: 29.71 Smart Investing & Trading Score: 93 | |
| Day Percent Change: -2.40% Day Change: -0.73 | |
| Week Change: 4.83% Year-to-date Change: 18.5% | |
| RM Links: Profile News Message Board | |
| Charts:- Daily , Weekly | |
| Add RM to Watchlist: View: Get Complete RM Trend Analysis ➞ | |
 | RVNC Revance Therapeutics, Inc. |
| Sector: Health Care | |
| SubSector: Biotechnology | |
| MarketCap: 854.185 Millions | |
| Recent Price: 4.28 Smart Investing & Trading Score: 74 | |
| Day Percent Change: -2.40% Day Change: -0.10 | |
| Week Change: 8.23% Year-to-date Change: -51.4% | |
| RVNC Links: Profile News Message Board | |
| Charts:- Daily , Weekly | |
| Add RVNC to Watchlist: View: Get Complete RVNC Trend Analysis ➞ | |
 | AKTS Akoustis Technologies, Inc. |
| Sector: Technology | |
| SubSector: Communication Equipment | |
| MarketCap: 197.039 Millions | |
| Recent Price: 0.59 Smart Investing & Trading Score: 57 | |
| Day Percent Change: -2.40% Day Change: -0.01 | |
| Week Change: -2.4% Year-to-date Change: -29.8% | |
| AKTS Links: Profile News Message Board | |
| Charts:- Daily , Weekly | |
| Add AKTS to Watchlist: View: Get Complete AKTS Trend Analysis ➞ | |
 | HLLY Holley Inc. |
| Sector: Services & Goods | |
| SubSector: Auto Parts | |
| MarketCap: 469 Millions | |
| Recent Price: 4.07 Smart Investing & Trading Score: 42 | |
| Day Percent Change: -2.40% Day Change: -0.10 | |
| Week Change: -0.73% Year-to-date Change: -18.0% | |
| HLLY Links: Profile News Message Board | |
| Charts:- Daily , Weekly | |
| Add HLLY to Watchlist: View: Get Complete HLLY Trend Analysis ➞ | |
 | SCPH scPharmaceuticals Inc. |
| Sector: Health Care | |
| SubSector: Biotechnology | |
| MarketCap: 136.185 Millions | |
| Recent Price: 4.85 Smart Investing & Trading Score: 67 | |
| Day Percent Change: -2.41% Day Change: -0.12 | |
| Week Change: 4.08% Year-to-date Change: -22.7% | |
| SCPH Links: Profile News Message Board | |
| Charts:- Daily , Weekly | |
| Add SCPH to Watchlist: View: Get Complete SCPH Trend Analysis ➞ | |
 | TREE LendingTree, Inc. |
| Sector: Financials | |
| SubSector: Mortgage Investment | |
| MarketCap: 2745.99 Millions | |
| Recent Price: 47.74 Smart Investing & Trading Score: 63 | |
| Day Percent Change: -2.42% Day Change: -1.19 | |
| Week Change: -3.37% Year-to-date Change: 57.5% | |
| TREE Links: Profile News Message Board | |
| Charts:- Daily , Weekly | |
| Add TREE to Watchlist: View: Get Complete TREE Trend Analysis ➞ | |
 | KRYS Krystal Biotech, Inc. |
| Sector: Health Care | |
| SubSector: Biotechnology | |
| MarketCap: 874.085 Millions | |
| Recent Price: 157.68 Smart Investing & Trading Score: 71 | |
| Day Percent Change: -2.42% Day Change: -3.91 | |
| Week Change: -2.12% Year-to-date Change: 27.1% | |
| KRYS Links: Profile News Message Board | |
| Charts:- Daily , Weekly | |
| Add KRYS to Watchlist: View: Get Complete KRYS Trend Analysis ➞ | |
 | NRDS NerdWallet, Inc. |
| Sector: Financials | |
| SubSector: Credit Services | |
| MarketCap: 759 Millions | |
| Recent Price: 14.14 Smart Investing & Trading Score: 62 | |
| Day Percent Change: -2.42% Day Change: -0.35 | |
| Week Change: 3.93% Year-to-date Change: -5.4% | |
| NRDS Links: Profile News Message Board | |
| Charts:- Daily , Weekly | |
| Add NRDS to Watchlist: View: Get Complete NRDS Trend Analysis ➞ | |
 | PTLO Portillos Inc. |
| Sector: Services & Goods | |
| SubSector: Restaurants | |
| MarketCap: 1590 Millions | |
| Recent Price: 10.35 Smart Investing & Trading Score: 0 | |
| Day Percent Change: -2.45% Day Change: -0.26 | |
| Week Change: -13.86% Year-to-date Change: -35.5% | |
| PTLO Links: Profile News Message Board | |
| Charts:- Daily , Weekly | |
| Add PTLO to Watchlist: View: Get Complete PTLO Trend Analysis ➞ | |
 | EMBC Embecta Corp. |
| Sector: Health Care | |
| SubSector: Medical Instruments & Supplies | |
| MarketCap: 1260 Millions | |
| Recent Price: 10.29 Smart Investing & Trading Score: 60 | |
| Day Percent Change: -2.46% Day Change: -0.26 | |
| Week Change: 0.29% Year-to-date Change: -46.1% | |
| EMBC Links: Profile News Message Board | |
| Charts:- Daily , Weekly | |
| Add EMBC to Watchlist: View: Get Complete EMBC Trend Analysis ➞ | |
 | SFIX Stitch Fix, Inc. |
| Sector: Services & Goods | |
| SubSector: Specialty Retail, Other | |
| MarketCap: 1693.64 Millions | |
| Recent Price: 2.15 Smart Investing & Trading Score: 37 | |
| Day Percent Change: -2.49% Day Change: -0.06 | |
| Week Change: -6.11% Year-to-date Change: -39.8% | |
| SFIX Links: Profile News Message Board | |
| Charts:- Daily , Weekly | |
| Add SFIX to Watchlist: View: Get Complete SFIX Trend Analysis ➞ | |
 | RXST RxSight, Inc. |
| Sector: Health Care | |
| SubSector: Medical Devices | |
| MarketCap: 893 Millions | |
| Recent Price: 60.64 Smart Investing & Trading Score: 93 | |
| Day Percent Change: -2.49% Day Change: -1.55 | |
| Week Change: 0.12% Year-to-date Change: 51.2% | |
| RXST Links: Profile News Message Board | |
| Charts:- Daily , Weekly | |
| Add RXST to Watchlist: View: Get Complete RXST Trend Analysis ➞ | |
 | EB Eventbrite, Inc. |
| Sector: Technology | |
| SubSector: Application Software | |
| MarketCap: 805.262 Millions | |
| Recent Price: 5.45 Smart Investing & Trading Score: 45 | |
| Day Percent Change: -2.50% Day Change: -0.14 | |
| Week Change: -1.09% Year-to-date Change: -34.8% | |
| EB Links: Profile News Message Board | |
| Charts:- Daily , Weekly | |
| Add EB to Watchlist: View: Get Complete EB Trend Analysis ➞ | |
 | DDS Dillard s, Inc. |
| Sector: Services & Goods | |
| SubSector: Department Stores | |
| MarketCap: 1170.82 Millions | |
| Recent Price: 423.47 Smart Investing & Trading Score: 41 | |
| Day Percent Change: -2.52% Day Change: -10.96 | |
| Week Change: -2.43% Year-to-date Change: 4.9% | |
| DDS Links: Profile News Message Board | |
| Charts:- Daily , Weekly | |
| Add DDS to Watchlist: View: Get Complete DDS Trend Analysis ➞ | |
 | PEB Pebblebrook Hotel Trust |
| Sector: Financials | |
| SubSector: REIT - Hotel/Motel | |
| MarketCap: 1472.84 Millions | |
| Recent Price: 14.30 Smart Investing & Trading Score: 8 | |
| Day Percent Change: -2.52% Day Change: -0.37 | |
| Week Change: -1.11% Year-to-date Change: -10.5% | |
| PEB Links: Profile News Message Board | |
| Charts:- Daily , Weekly | |
| Add PEB to Watchlist: View: Get Complete PEB Trend Analysis ➞ | |
 | ALDX Aldeyra Therapeutics, Inc. |
| Sector: Health Care | |
| SubSector: Biotechnology | |
| MarketCap: 61.2785 Millions | |
| Recent Price: 4.07 Smart Investing & Trading Score: 74 | |
| Day Percent Change: -2.52% Day Change: -0.10 | |
| Week Change: -2.28% Year-to-date Change: 15.8% | |
| ALDX Links: Profile News Message Board | |
| Charts:- Daily , Weekly | |
| Add ALDX to Watchlist: View: Get Complete ALDX Trend Analysis ➞ | |
 | ACVA ACV Auctions Inc. |
| Sector: Services & Goods | |
| SubSector: Auto & Truck Dealerships | |
| MarketCap: 2680 Millions | |
| Recent Price: 17.31 Smart Investing & Trading Score: 8 | |
| Day Percent Change: -2.53% Day Change: -0.45 | |
| Week Change: -2.18% Year-to-date Change: 14.9% | |
| ACVA Links: Profile News Message Board | |
| Charts:- Daily , Weekly | |
| Add ACVA to Watchlist: View: Get Complete ACVA Trend Analysis ➞ | |
| Too many stocks? View smallcap stocks filtered by marketcap & sector |
| Marketcap: All SmallCap Stocks (default-no microcap), Large, Mid-Range, Small & MicroCap |
| Sector: Tech, Finance, Energy, Staples, Retail, Industrial, Materials, Utilities & Medical |
|
Best Stocks Today 12Stocks.com |
© 2024 12Stocks.com Terms & Conditions Privacy Contact Us
All Information Provided Only For Education And Not To Be Used For Investing or Trading. See Terms & Conditions


One More Thing ... Get Best Stocks Delivered Daily!
Never Ever Miss A Move With Our Top Ten Stocks Lists
Find Best Stocks In Any Market - Bull or Bear Market
Take A Peek At Our Top Ten Stocks Lists: Daily, Weekly, Year-to-Date & Top Trends
Find Best Stocks In Any Market - Bull or Bear Market
Take A Peek At Our Top Ten Stocks Lists: Daily, Weekly, Year-to-Date & Top Trends
Smallcap Stocks With Best Up Trends [0-bearish to 100-bullish]: Cricut [100], DASAN Zhone[100], Latham Group[100], Hyster-Yale Materials[100], Myriad Genetics[100], Alpha and[100], Vigil Neuroscience[100], Hannon Armstrong[100], Ardmore Shipping[100], Inogen [100], Payoneer Global[100]
Best Smallcap Stocks Year-to-Date:
CareMax [580.41%], Janux [415.82%], Viking [329.77%], Bakkt [295.29%], Longboard [255.4%], Alpine Immune[239.73%], Vera [190.25%], Super Micro[189.4%], Avidity Biosciences[188.27%], Cullinan Oncology[172%], Arcutis Bio[147.06%] Best Smallcap Stocks This Week:
DASAN Zhone[64.32%], Innodata [55.88%], Perficient [52.92%], Cricut [42.32%], Vigil Neuroscience[39.52%], Thoughtworks Holding[36.89%], Latham Group[35.9%], Great Lakes[32.18%], Bakkt [31.96%], Outset Medical[31.95%], P3 Health[27.95%] Best Smallcap Stocks Daily:
Innodata [55.42%], Cricut [47.47%], DASAN Zhone[30.11%], Latham Group[24.08%], Hyster-Yale Materials[23.55%], iRobot [21.40%], Myriad Genetics[21.13%], Ameresco [21.13%], Bakkt [20.92%], Alpha and[20.78%], Vigil Neuroscience[18.97%]