
 Login Sign Up


| |||||
 |  | ||||

| 12Stocks.com Market Intelligence |
Best SmallCap Stocks
|
| In a hurry? Small Cap Stock Lists: Performance Trends Table, Stock Charts
Sort Small Cap stocks: Daily, Weekly, Year-to-Date, Market Cap & Trends. Filter Small Cap stocks list by sector: Show all, Tech, Finance, Energy, Staples, Retail, Industrial, Materials, Utilities and HealthCare Filter Small Cap stocks list by size: All Large Medium Small and MicroCap |
| 12Stocks.com Small Cap Stocks Performances & Trends Daily | |||||||||
|
|  The overall Smart Investing & Trading Score is 70 (0-bearish to 100-bullish) which puts Small Cap index in short term neutral to bullish trend. The Smart Investing & Trading Score from previous trading session is 87 and hence a deterioration of trend.
| ||||||||
Here are the Smart Investing & Trading Scores of the most requested small cap stocks at 12Stocks.com (click stock name for detailed review):
|


| 12Stocks.com: Investing in Smallcap Index with Stocks | |
|
The following table helps investors and traders sort through current performance and trends (as measured by Smart Investing & Trading Score) of various
stocks in the Smallcap Index. Quick View: Move mouse or cursor over stock symbol (ticker) to view short-term technical chart and over stock name to view long term chart. Click on  to add stock symbol to your watchlist and to add stock symbol to your watchlist and  to view watchlist. Click on any ticker or stock name for detailed market intelligence report for that stock. to view watchlist. Click on any ticker or stock name for detailed market intelligence report for that stock. |
12Stocks.com Performance of Stocks in Smallcap Index
| Ticker | Stock Name | Watchlist | Category | Recent Price | Smart Investing & Trading Score | Change % | YTD Change% |
| MTW | Manitowoc |   | Industrials | 12.42 | 28 | -1.66 | -25.58% |
| NWPX | Northwest Pipe | | Materials | 35.61 | 100 | -1.66 | 17.68% |
| DJCO | Daily Journal | | Services & Goods | 373.55 | 100 | -1.66 | 9.60% |
| BHVN | Biohaven Pharmaceutical | | Health Care | 40.78 | 40 | -1.66 | -4.72% |
| DCGO | DocGo | | Health Care | 3.50 | 38 | -1.69 | -37.39% |
| DUOL | Duolingo | | Technology | 244.64 | 78 | -1.69 | 7.36% |
| MLAB | Mesa | | Technology | 113.22 | 88 | -1.70 | 8.07% |
| TNET | TriNet Group | | Services & Goods | 103.23 | 32 | -1.70 | -13.20% |
| MIRM | Mirum | | Health Care | 25.47 | 47 | -1.70 | -13.72% |
| EHAB | Enhabit | | Health Care | 9.73 | 46 | -1.72 | -5.99% |
| RDFN | Redfin | | Technology | 6.26 | 45 | -1.73 | -39.34% |
| VSH | Vishay Inter | | Technology | 22.57 | 76 | -1.74 | -5.84% |
| WRBY | Warby Parker | | Health Care | 12.44 | 68 | -1.74 | -11.80% |
| TEX | Terex | | Industrials | 59.43 | 58 | -1.75 | 3.43% |
| AKR | Acadia Realty | | Financials | 16.85 | 41 | -1.75 | -0.82% |
| COHU | Cohu | | Technology | 29.14 | 42 | -1.75 | -17.66% |
| BECN | Beacon Roofing | | Industrials | 92.22 | 26 | -1.75 | 5.98% |
| ELA | Envela | | Services & Goods | 4.48 | 56 | -1.75 | -7.82% |
| SAFE | Safehold | | Financials | 19.44 | 74 | -1.77 | -16.92% |
| WHD | Cactus | | Energy | 50.56 | 76 | -1.77 | 11.37% |
| TENB | Tenable | | Technology | 44.83 | 15 | -1.77 | -2.67% |
| ALRM | Alarm.com | | Technology | 68.56 | 57 | -1.78 | 6.09% |
| NUVL | Nuvalent | | Health Care | 67.42 | 25 | -1.78 | -8.26% |
| COGT | Cogint | | Technology | 7.62 | 19 | -1.80 | 29.59% |
| KALU | Kaiser Aluminum | | Materials | 96.05 | 73 | -1.80 | 34.92% |


| Too many stocks? View smallcap stocks filtered by marketcap & sector |
| Marketcap: All SmallCap Stocks (default-no microcap), Large, Mid-Range, Small |
| Smallcap Sector: Tech, Finance, Energy, Staples, Retail, Industrial, Materials, & Medical |
|
Get the most comprehensive stock market coverage daily at 12Stocks.com ➞ Best Stocks Today ➞ Best Stocks Weekly ➞ Best Stocks Year-to-Date ➞ Best Stocks Trends ➞  Best Stocks Today 12Stocks.com Best Nasdaq Stocks ➞ Best S&P 500 Stocks ➞ Best Tech Stocks ➞ Best Biotech Stocks ➞ |
| Detailed Overview of SmallCap Stocks |
| SmallCap Technical Overview, Leaders & Laggards, Top SmallCap ETF Funds & Detailed SmallCap Stocks List, Charts, Trends & More |
| Smallcap: Technical Analysis, Trends & YTD Performance | |
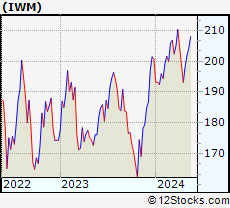
| SmallCap segment as represented by
IWM, an exchange-traded fund [ETF], holds basket of thousands of smallcap stocks from across all major sectors of the US stock market. The smallcap index (contains stocks like Riverbed & Sotheby's) is up by 1.53% and is currently underperforming the overall market by -6.51% year-to-date. Below is a quick view of technical charts and trends: | |
 IWM Weekly Chart |
|
| Long Term Trend: Deteriorating | |
| Medium Term Trend: Very Good | |
 IWM Daily Chart |
|
| Short Term Trend: Good | |
| Overall Trend Score: 70 | |
| YTD Performance: 1.53% | |
| **Trend Scores & Views Are Only For Educational Purposes And Not For Investing | |
| 12Stocks.com: Top Performing Small Cap Index Stocks | ||||||||||||||||||||||||||||||||||||||||||||||||
 The top performing Small Cap Index stocks year to date are
Now, more recently, over last week, the top performing Small Cap Index stocks on the move are


|
||||||||||||||||||||||||||||||||||||||||||||||||
| 12Stocks.com: Investing in Smallcap Index using Exchange Traded Funds | |
|
The following table shows list of key exchange traded funds (ETF) that
help investors track Smallcap index. The following list also includes leveraged ETF funds that track twice or thrice the daily returns of Smallcap indices. Short or inverse ETF funds move in the opposite direction to the index they track and are useful during market pullbacks or during bear markets. Quick View: Move mouse or cursor over ETF symbol (ticker) to view short-term technical chart and over ETF name to view long term chart. Click on ticker or stock name for detailed view. Click on to add stock symbol to your watchlist and to view watchlist. |
12Stocks.com List of ETFs that track Smallcap Index
| Ticker | ETF Name | Watchlist | Recent Price | Smart Investing & Trading Score | Change % | Week % | Year-to-date % |
| IWM | iShares Russell 2000 | | 203.78 | 70 | -0.58 | 0.93 | 1.53% |
| IJR | iShares Core S&P Small-Cap | | 108.26 | 58 | -0.33 | 1.05 | 0.01% |
| IWN | iShares Russell 2000 Value | | 155.37 | 76 | -0.17 | 0.75 | 0.03% |
| VTWO | Vanguard Russell 2000 ETF | | 82.40 | 57 | -0.53 | 0.97 | 1.6% |
| IWO | iShares Russell 2000 Growth | | 260.10 | 57 | -0.84 | 1.26 | 3.12% |
| IJS | iShares S&P Small-Cap 600 Value | | 99.80 | 40 | 0.12 | 1.09 | -3.17% |
| IJT | iShares S&P Small-Cap 600 Growth | | 129.03 | 71 | -0.62 | 0.99 | 3.11% |
| XSLV | PowerShares S&P SmallCap Low Volatil ETF | | 43.94 | 95 | -0.14 | 1.67 | -0.48% |
| SMLV | SPDR SSGA US Small Cap Low Volatil ETF | | 110.32 | 63 | -0.15 | 0.57 | -1.96% |
| SDD | ProShares UltraShort SmallCap600 | | 18.66 | 40 | 2.43 | -0.98 | 1.27% |
| SBB | ProShares Short SmallCap600 | | 16.08 | 25 | 0.69 | -0.5 | 0.94% |
| SAA | ProShares Ultra SmallCap600 | | 24.21 | 70 | -0.75 | 2.62 | -2.98% |
| 12Stocks.com: Charts, Trends, Fundamental Data and Performances of SmallCap Stocks | |
|
We now take in-depth look at all SmallCap stocks including charts, multi-period performances and overall trends (as measured by Smart Investing & Trading Score). One can sort SmallCap stocks (click link to choose) by Daily, Weekly and by Year-to-Date performances. Also, one can sort by size of the company or by market capitalization. |
| Select Your Default Chart Type: | |||||
| |||||
| Click on stock symbol or name for detailed view. Click on to add stock symbol to your watchlist and to view watchlist. Quick View: Move mouse or cursor over "Daily" to quickly view daily technical stock chart and over "Weekly" to view weekly technical stock chart. | |||||

 | MTW The Manitowoc Company, Inc. |
| Sector: Industrials | |
| SubSector: Farm & Construction Machinery | |
| MarketCap: 373.707 Millions | |
| Recent Price: 12.42 Smart Investing & Trading Score: 28 | |
| Day Percent Change: -1.66% Day Change: -0.21 | |
| Week Change: -0.08% Year-to-date Change: -25.6% | |
| MTW Links: Profile News Message Board | |
| Charts:- Daily , Weekly | |
| Add MTW to Watchlist: View: Get Complete MTW Trend Analysis ➞ | |
 | NWPX Northwest Pipe Company |
| Sector: Materials | |
| SubSector: Steel & Iron | |
| MarketCap: 245.788 Millions | |
| Recent Price: 35.61 Smart Investing & Trading Score: 100 | |
| Day Percent Change: -1.66% Day Change: -0.60 | |
| Week Change: 8.83% Year-to-date Change: 17.7% | |
| NWPX Links: Profile News Message Board | |
| Charts:- Daily , Weekly | |
| Add NWPX to Watchlist: View: Get Complete NWPX Trend Analysis ➞ | |
 | DJCO Daily Journal Corporation |
| Sector: Services & Goods | |
| SubSector: Publishing - Newspapers | |
| MarketCap: 306.822 Millions | |
| Recent Price: 373.55 Smart Investing & Trading Score: 100 | |
| Day Percent Change: -1.66% Day Change: -6.31 | |
| Week Change: 1.23% Year-to-date Change: 9.6% | |
| DJCO Links: Profile News Message Board | |
| Charts:- Daily , Weekly | |
| Add DJCO to Watchlist: View: Get Complete DJCO Trend Analysis ➞ | |
 | BHVN Biohaven Pharmaceutical Holding Company Ltd. |
| Sector: Health Care | |
| SubSector: Biotechnology | |
| MarketCap: 2024.25 Millions | |
| Recent Price: 40.78 Smart Investing & Trading Score: 40 | |
| Day Percent Change: -1.66% Day Change: -0.69 | |
| Week Change: 0.22% Year-to-date Change: -4.7% | |
| BHVN Links: Profile News Message Board | |
| Charts:- Daily , Weekly | |
| Add BHVN to Watchlist: View: Get Complete BHVN Trend Analysis ➞ | |
 | DCGO DocGo Inc. |
| Sector: Health Care | |
| SubSector: Medical Care Facilities | |
| MarketCap: 972 Millions | |
| Recent Price: 3.50 Smart Investing & Trading Score: 38 | |
| Day Percent Change: -1.69% Day Change: -0.06 | |
| Week Change: -3.05% Year-to-date Change: -37.4% | |
| DCGO Links: Profile News Message Board | |
| Charts:- Daily , Weekly | |
| Add DCGO to Watchlist: View: Get Complete DCGO Trend Analysis ➞ | |
 | DUOL Duolingo, Inc. |
| Sector: Technology | |
| SubSector: Software - Application | |
| MarketCap: 6070 Millions | |
| Recent Price: 244.64 Smart Investing & Trading Score: 78 | |
| Day Percent Change: -1.69% Day Change: -4.20 | |
| Week Change: 1.83% Year-to-date Change: 7.4% | |
| DUOL Links: Profile News Message Board | |
| Charts:- Daily , Weekly | |
| Add DUOL to Watchlist: View: Get Complete DUOL Trend Analysis ➞ | |
 | MLAB Mesa Laboratories, Inc. |
| Sector: Technology | |
| SubSector: Scientific & Technical Instruments | |
| MarketCap: 935.453 Millions | |
| Recent Price: 113.22 Smart Investing & Trading Score: 88 | |
| Day Percent Change: -1.70% Day Change: -1.96 | |
| Week Change: -1.97% Year-to-date Change: 8.1% | |
| MLAB Links: Profile News Message Board | |
| Charts:- Daily , Weekly | |
| Add MLAB to Watchlist: View: Get Complete MLAB Trend Analysis ➞ | |
 | TNET TriNet Group, Inc. |
| Sector: Services & Goods | |
| SubSector: Business Services | |
| MarketCap: 2648.72 Millions | |
| Recent Price: 103.23 Smart Investing & Trading Score: 32 | |
| Day Percent Change: -1.70% Day Change: -1.78 | |
| Week Change: 2.08% Year-to-date Change: -13.2% | |
| TNET Links: Profile News Message Board | |
| Charts:- Daily , Weekly | |
| Add TNET to Watchlist: View: Get Complete TNET Trend Analysis ➞ | |
 | MIRM Mirum Pharmaceuticals, Inc. |
| Sector: Health Care | |
| SubSector: Biotechnology | |
| MarketCap: 309.585 Millions | |
| Recent Price: 25.47 Smart Investing & Trading Score: 47 | |
| Day Percent Change: -1.70% Day Change: -0.44 | |
| Week Change: -1.43% Year-to-date Change: -13.7% | |
| MIRM Links: Profile News Message Board | |
| Charts:- Daily , Weekly | |
| Add MIRM to Watchlist: View: Get Complete MIRM Trend Analysis ➞ | |
 | EHAB Enhabit, Inc. |
| Sector: Health Care | |
| SubSector: Medical Care Facilities | |
| MarketCap: 569 Millions | |
| Recent Price: 9.73 Smart Investing & Trading Score: 46 | |
| Day Percent Change: -1.72% Day Change: -0.17 | |
| Week Change: -4.04% Year-to-date Change: -6.0% | |
| EHAB Links: Profile News Message Board | |
| Charts:- Daily , Weekly | |
| Add EHAB to Watchlist: View: Get Complete EHAB Trend Analysis ➞ | |
 | RDFN Redfin Corporation |
| Sector: Technology | |
| SubSector: Internet Information Providers | |
| MarketCap: 1356.2 Millions | |
| Recent Price: 6.26 Smart Investing & Trading Score: 45 | |
| Day Percent Change: -1.73% Day Change: -0.11 | |
| Week Change: 0.97% Year-to-date Change: -39.3% | |
| RDFN Links: Profile News Message Board | |
| Charts:- Daily , Weekly | |
| Add RDFN to Watchlist: View: Get Complete RDFN Trend Analysis ➞ | |
 | VSH Vishay Intertechnology, Inc. |
| Sector: Technology | |
| SubSector: Semiconductor - Broad Line | |
| MarketCap: 2132.52 Millions | |
| Recent Price: 22.57 Smart Investing & Trading Score: 76 | |
| Day Percent Change: -1.74% Day Change: -0.40 | |
| Week Change: -0.88% Year-to-date Change: -5.8% | |
| VSH Links: Profile News Message Board | |
| Charts:- Daily , Weekly | |
| Add VSH to Watchlist: View: Get Complete VSH Trend Analysis ➞ | |
 | WRBY Warby Parker Inc. |
| Sector: Health Care | |
| SubSector: Medical Instruments & Supplies | |
| MarketCap: 1380 Millions | |
| Recent Price: 12.44 Smart Investing & Trading Score: 68 | |
| Day Percent Change: -1.74% Day Change: -0.22 | |
| Week Change: -0.8% Year-to-date Change: -11.8% | |
| WRBY Links: Profile News Message Board | |
| Charts:- Daily , Weekly | |
| Add WRBY to Watchlist: View: Get Complete WRBY Trend Analysis ➞ | |
 | TEX Terex Corporation |
| Sector: Industrials | |
| SubSector: Farm & Construction Machinery | |
| MarketCap: 1083.07 Millions | |
| Recent Price: 59.43 Smart Investing & Trading Score: 58 | |
| Day Percent Change: -1.75% Day Change: -1.06 | |
| Week Change: 1.85% Year-to-date Change: 3.4% | |
| TEX Links: Profile News Message Board | |
| Charts:- Daily , Weekly | |
| Add TEX to Watchlist: View: Get Complete TEX Trend Analysis ➞ | |
 | AKR Acadia Realty Trust |
| Sector: Financials | |
| SubSector: Property Management | |
| MarketCap: 1367.42 Millions | |
| Recent Price: 16.85 Smart Investing & Trading Score: 41 | |
| Day Percent Change: -1.75% Day Change: -0.30 | |
| Week Change: -0.41% Year-to-date Change: -0.8% | |
| AKR Links: Profile News Message Board | |
| Charts:- Daily , Weekly | |
| Add AKR to Watchlist: View: Get Complete AKR Trend Analysis ➞ | |
 | COHU Cohu, Inc. |
| Sector: Technology | |
| SubSector: Semiconductor Equipment & Materials | |
| MarketCap: 519.518 Millions | |
| Recent Price: 29.14 Smart Investing & Trading Score: 42 | |
| Day Percent Change: -1.75% Day Change: -0.52 | |
| Week Change: -1.55% Year-to-date Change: -17.7% | |
| COHU Links: Profile News Message Board | |
| Charts:- Daily , Weekly | |
| Add COHU to Watchlist: View: Get Complete COHU Trend Analysis ➞ | |
 | BECN Beacon Roofing Supply, Inc. |
| Sector: Industrials | |
| SubSector: General Building Materials | |
| MarketCap: 1210.13 Millions | |
| Recent Price: 92.22 Smart Investing & Trading Score: 26 | |
| Day Percent Change: -1.75% Day Change: -1.64 | |
| Week Change: -3.83% Year-to-date Change: 6.0% | |
| BECN Links: Profile News Message Board | |
| Charts:- Daily , Weekly | |
| Add BECN to Watchlist: View: Get Complete BECN Trend Analysis ➞ | |
 | ELA Envela Corporation |
| Sector: Services & Goods | |
| SubSector: Specialty Retail, Other | |
| MarketCap: 73.5944 Millions | |
| Recent Price: 4.48 Smart Investing & Trading Score: 56 | |
| Day Percent Change: -1.75% Day Change: -0.08 | |
| Week Change: 0.22% Year-to-date Change: -7.8% | |
| ELA Links: Profile News Message Board | |
| Charts:- Daily , Weekly | |
| Add ELA to Watchlist: View: Get Complete ELA Trend Analysis ➞ | |
 | SAFE Safehold Inc. |
| Sector: Financials | |
| SubSector: REIT - Diversified | |
| MarketCap: 2994.63 Millions | |
| Recent Price: 19.44 Smart Investing & Trading Score: 74 | |
| Day Percent Change: -1.77% Day Change: -0.35 | |
| Week Change: 1.83% Year-to-date Change: -16.9% | |
| SAFE Links: Profile News Message Board | |
| Charts:- Daily , Weekly | |
| Add SAFE to Watchlist: View: Get Complete SAFE Trend Analysis ➞ | |
 | WHD Cactus, Inc. |
| Sector: Energy | |
| SubSector: Oil & Gas Equipment & Services | |
| MarketCap: 920.261 Millions | |
| Recent Price: 50.56 Smart Investing & Trading Score: 76 | |
| Day Percent Change: -1.77% Day Change: -0.91 | |
| Week Change: -0.18% Year-to-date Change: 11.4% | |
| WHD Links: Profile News Message Board | |
| Charts:- Daily , Weekly | |
| Add WHD to Watchlist: View: Get Complete WHD Trend Analysis ➞ | |
 | TENB Tenable Holdings, Inc. |
| Sector: Technology | |
| SubSector: Business Software & Services | |
| MarketCap: 1986.68 Millions | |
| Recent Price: 44.83 Smart Investing & Trading Score: 15 | |
| Day Percent Change: -1.77% Day Change: -0.81 | |
| Week Change: 0.52% Year-to-date Change: -2.7% | |
| TENB Links: Profile News Message Board | |
| Charts:- Daily , Weekly | |
| Add TENB to Watchlist: View: Get Complete TENB Trend Analysis ➞ | |
 | ALRM Alarm.com Holdings, Inc. |
| Sector: Technology | |
| SubSector: Application Software | |
| MarketCap: 2035.62 Millions | |
| Recent Price: 68.56 Smart Investing & Trading Score: 57 | |
| Day Percent Change: -1.78% Day Change: -1.24 | |
| Week Change: 0.42% Year-to-date Change: 6.1% | |
| ALRM Links: Profile News Message Board | |
| Charts:- Daily , Weekly | |
| Add ALRM to Watchlist: View: Get Complete ALRM Trend Analysis ➞ | |
 | NUVL Nuvalent, Inc. |
| Sector: Health Care | |
| SubSector: Biotechnology | |
| MarketCap: 2400 Millions | |
| Recent Price: 67.42 Smart Investing & Trading Score: 25 | |
| Day Percent Change: -1.78% Day Change: -1.22 | |
| Week Change: -4.8% Year-to-date Change: -8.3% | |
| NUVL Links: Profile News Message Board | |
| Charts:- Daily , Weekly | |
| Add NUVL to Watchlist: View: Get Complete NUVL Trend Analysis ➞ | |
 | COGT Cogint, Inc. |
| Sector: Technology | |
| SubSector: Business Software & Services | |
| MarketCap: 214.55 Millions | |
| Recent Price: 7.62 Smart Investing & Trading Score: 19 | |
| Day Percent Change: -1.80% Day Change: -0.14 | |
| Week Change: 1.2% Year-to-date Change: 29.6% | |
| COGT Links: Profile News Message Board | |
| Charts:- Daily , Weekly | |
| Add COGT to Watchlist: View: Get Complete COGT Trend Analysis ➞ | |
 | KALU Kaiser Aluminum Corporation |
| Sector: Materials | |
| SubSector: Aluminum | |
| MarketCap: 969.808 Millions | |
| Recent Price: 96.05 Smart Investing & Trading Score: 73 | |
| Day Percent Change: -1.80% Day Change: -1.76 | |
| Week Change: -0.06% Year-to-date Change: 34.9% | |
| KALU Links: Profile News Message Board | |
| Charts:- Daily , Weekly | |
| Add KALU to Watchlist: View: Get Complete KALU Trend Analysis ➞ | |
| Too many stocks? View smallcap stocks filtered by marketcap & sector |
| Marketcap: All SmallCap Stocks (default-no microcap), Large, Mid-Range, Small & MicroCap |
| Sector: Tech, Finance, Energy, Staples, Retail, Industrial, Materials, Utilities & Medical |
|
Best Stocks Today 12Stocks.com |
© 2024 12Stocks.com Terms & Conditions Privacy Contact Us
All Information Provided Only For Education And Not To Be Used For Investing or Trading. See Terms & Conditions


One More Thing ... Get Best Stocks Delivered Daily!
Never Ever Miss A Move With Our Top Ten Stocks Lists
Find Best Stocks In Any Market - Bull or Bear Market
Take A Peek At Our Top Ten Stocks Lists: Daily, Weekly, Year-to-Date & Top Trends
Find Best Stocks In Any Market - Bull or Bear Market
Take A Peek At Our Top Ten Stocks Lists: Daily, Weekly, Year-to-Date & Top Trends
Smallcap Stocks With Best Up Trends [0-bearish to 100-bullish]: Cricut [100], DASAN Zhone[100], Latham Group[100], Hyster-Yale Materials[100], Myriad Genetics[100], Alpha and[100], Vigil Neuroscience[100], Hannon Armstrong[100], Ardmore Shipping[100], Inogen [100], Payoneer Global[100]
Best Smallcap Stocks Year-to-Date:
CareMax [580.41%], Janux [415.82%], Viking [329.77%], Bakkt [295.29%], Longboard [255.4%], Alpine Immune[239.73%], Vera [190.25%], Super Micro[189.4%], Avidity Biosciences[188.27%], Cullinan Oncology[172%], Arcutis Bio[147.06%] Best Smallcap Stocks This Week:
DASAN Zhone[64.32%], Innodata [55.88%], Perficient [52.92%], Cricut [42.32%], Vigil Neuroscience[39.52%], Thoughtworks Holding[36.89%], Latham Group[35.9%], Great Lakes[32.18%], Bakkt [31.96%], Outset Medical[31.95%], P3 Health[27.95%] Best Smallcap Stocks Daily:
Innodata [55.42%], Cricut [47.47%], DASAN Zhone[30.11%], Latham Group[24.08%], Hyster-Yale Materials[23.55%], iRobot [21.40%], Myriad Genetics[21.13%], Ameresco [21.13%], Bakkt [20.92%], Alpha and[20.78%], Vigil Neuroscience[18.97%]