
 Login Sign Up


| |||||
 |  | ||||

| 12Stocks.com Market Intelligence |
Best SmallCap Stocks
|
| In a hurry? Small Cap Stock Lists: Performance Trends Table, Stock Charts
Sort Small Cap stocks: Daily, Weekly, Year-to-Date, Market Cap & Trends. Filter Small Cap stocks list by sector: Show all, Tech, Finance, Energy, Staples, Retail, Industrial, Materials, Utilities and HealthCare Filter Small Cap stocks list by size: All Large Medium Small and MicroCap |
| 12Stocks.com Small Cap Stocks Performances & Trends Daily | |||||||||
|
|  The overall Smart Investing & Trading Score is 70 (0-bearish to 100-bullish) which puts Small Cap index in short term neutral to bullish trend. The Smart Investing & Trading Score from previous trading session is 87 and hence a deterioration of trend.
| ||||||||
Here are the Smart Investing & Trading Scores of the most requested small cap stocks at 12Stocks.com (click stock name for detailed review):
|


| 12Stocks.com: Investing in Smallcap Index with Stocks | |
|
The following table helps investors and traders sort through current performance and trends (as measured by Smart Investing & Trading Score) of various
stocks in the Smallcap Index. Quick View: Move mouse or cursor over stock symbol (ticker) to view short-term technical chart and over stock name to view long term chart. Click on  to add stock symbol to your watchlist and to add stock symbol to your watchlist and  to view watchlist. Click on any ticker or stock name for detailed market intelligence report for that stock. to view watchlist. Click on any ticker or stock name for detailed market intelligence report for that stock. |
12Stocks.com Performance of Stocks in Smallcap Index
| Ticker | Stock Name | Watchlist | Category | Recent Price | Smart Investing & Trading Score | Change % | YTD Change% |
| VRTS | Virtus |   | Financials | 231.64 | 64 | 3.13 | -4.19% |
| EVC | Entravision | | Services & Goods | 2.17 | 27 | 3.10 | -48.08% |
| QUAD | Quad/Graphics | | Services & Goods | 4.65 | 18 | 3.10 | -14.21% |
| SLQT | SelectQuote | | Financials | 2.50 | 95 | 3.09 | 82.85% |
| HCI | HCI Group | | Financials | 114.97 | 58 | 3.05 | 31.54% |
| REVG | REV Group | | Consumer Staples | 24.91 | 100 | 3.04 | 37.07% |
| VRA | Vera Bradley | | Consumer Staples | 7.30 | 64 | 2.96 | -5.19% |
| CLPR | Clipper Realty | | Financials | 4.04 | 50 | 2.93 | -25.09% |
| BGS | B&G Foods | | Consumer Staples | 11.67 | 62 | 2.91 | 11.14% |
| FWRD | Forward Air | | Transports | 21.51 | 37 | 2.87 | -65.79% |
| PAHC | Phibro Animal | | Health Care | 17.25 | 75 | 2.86 | 48.96% |
| SXI | Standex | | Industrials | 171.45 | 29 | 2.84 | 8.25% |
| DAKT | Daktronics | | Technology | 10.81 | 95 | 2.81 | 27.42% |
| MAC | Macerich | | Financials | 15.68 | 57 | 2.79 | 1.59% |
| STRL | Sterling Construction | | Industrials | 125.39 | 100 | 2.77 | 42.60% |
| BTMD | biote | | Health Care | 5.93 | 52 | 2.77 | 19.56% |
| RXT | Rackspace | | Technology | 1.86 | 64 | 2.76 | -7.23% |
| SASR | Sandy Spring | | Financials | 22.18 | 42 | 2.73 | -18.58% |
| GMRE | Global Medical | | Industrials | 8.70 | 64 | 2.72 | -21.62% |
| AGS | PlayAGS | | Services & Goods | 8.82 | 47 | 2.68 | 4.63% |
| PWOD | Penns Woods | | Financials | 18.94 | 59 | 2.66 | -15.86% |
| AMCX | AMC s | | Services & Goods | 13.10 | 100 | 2.66 | -30.28% |
| FIP | FTAI Infrastructure | | Industrials | 7.54 | 90 | 2.66 | 93.70% |
| CRGY | Crescent Energy | | Energy | 12.18 | 100 | 2.61 | -7.66% |
| ADTN | ADTRAN | | Technology | 5.53 | 87 | 2.60 | -24.66% |


| Too many stocks? View smallcap stocks filtered by marketcap & sector |
| Marketcap: All SmallCap Stocks (default-no microcap), Large, Mid-Range, Small |
| Smallcap Sector: Tech, Finance, Energy, Staples, Retail, Industrial, Materials, & Medical |
|
Get the most comprehensive stock market coverage daily at 12Stocks.com ➞ Best Stocks Today ➞ Best Stocks Weekly ➞ Best Stocks Year-to-Date ➞ Best Stocks Trends ➞  Best Stocks Today 12Stocks.com Best Nasdaq Stocks ➞ Best S&P 500 Stocks ➞ Best Tech Stocks ➞ Best Biotech Stocks ➞ |
| Detailed Overview of SmallCap Stocks |
| SmallCap Technical Overview, Leaders & Laggards, Top SmallCap ETF Funds & Detailed SmallCap Stocks List, Charts, Trends & More |
| Smallcap: Technical Analysis, Trends & YTD Performance | |
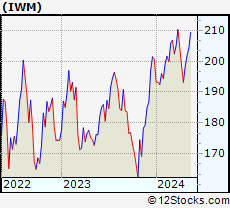
| SmallCap segment as represented by
IWM, an exchange-traded fund [ETF], holds basket of thousands of smallcap stocks from across all major sectors of the US stock market. The smallcap index (contains stocks like Riverbed & Sotheby's) is up by 1.45% and is currently underperforming the overall market by -6.57% year-to-date. Below is a quick view of technical charts and trends: | |
 IWM Weekly Chart |
|
| Long Term Trend: Deteriorating | |
| Medium Term Trend: Very Good | |
 IWM Daily Chart |
|
| Short Term Trend: Good | |
| Overall Trend Score: 70 | |
| YTD Performance: 1.45% | |
| **Trend Scores & Views Are Only For Educational Purposes And Not For Investing | |
| 12Stocks.com: Top Performing Small Cap Index Stocks | ||||||||||||||||||||||||||||||||||||||||||||||||
 The top performing Small Cap Index stocks year to date are
Now, more recently, over last week, the top performing Small Cap Index stocks on the move are


|
||||||||||||||||||||||||||||||||||||||||||||||||
| 12Stocks.com: Investing in Smallcap Index using Exchange Traded Funds | |
|
The following table shows list of key exchange traded funds (ETF) that
help investors track Smallcap index. The following list also includes leveraged ETF funds that track twice or thrice the daily returns of Smallcap indices. Short or inverse ETF funds move in the opposite direction to the index they track and are useful during market pullbacks or during bear markets. Quick View: Move mouse or cursor over ETF symbol (ticker) to view short-term technical chart and over ETF name to view long term chart. Click on ticker or stock name for detailed view. Click on to add stock symbol to your watchlist and to view watchlist. |
12Stocks.com List of ETFs that track Smallcap Index
| Ticker | ETF Name | Watchlist | Recent Price | Smart Investing & Trading Score | Change % | Week % | Year-to-date % |
| IWM | iShares Russell 2000 | | 203.62 | 70 | -0.66 | 0.85 | 1.45% |
| IJR | iShares Core S&P Small-Cap | | 108.15 | 58 | -0.44 | 0.95 | -0.1% |
| IWN | iShares Russell 2000 Value | | 155.08 | 76 | -0.35 | 0.56 | -0.16% |
| VTWO | Vanguard Russell 2000 ETF | | 82.27 | 57 | -0.69 | 0.81 | 1.44% |
| IWO | iShares Russell 2000 Growth | | 259.82 | 57 | -0.95 | 1.15 | 3.01% |
| IJS | iShares S&P Small-Cap 600 Value | | 99.06 | 40 | -0.62 | 0.34 | -3.89% |
| IJT | iShares S&P Small-Cap 600 Growth | | 128.54 | 71 | -1.00 | 0.61 | 2.72% |
| XSLV | PowerShares S&P SmallCap Low Volatil ETF | | 43.77 | 95 | -0.52 | 1.27 | -0.86% |
| SDD | ProShares UltraShort SmallCap600 | | 18.66 | 40 | 2.43 | -0.98 | 1.27% |
| SMLV | SPDR SSGA US Small Cap Low Volatil ETF | | 109.87 | 63 | -0.55 | 0.17 | -2.36% |
| SBB | ProShares Short SmallCap600 | | 16.11 | 25 | 0.91 | -0.28 | 1.16% |
| SAA | ProShares Ultra SmallCap600 | | 24.21 | 70 | -0.75 | 2.62 | -2.98% |
| 12Stocks.com: Charts, Trends, Fundamental Data and Performances of SmallCap Stocks | |
|
We now take in-depth look at all SmallCap stocks including charts, multi-period performances and overall trends (as measured by Smart Investing & Trading Score). One can sort SmallCap stocks (click link to choose) by Daily, Weekly and by Year-to-Date performances. Also, one can sort by size of the company or by market capitalization. |
| Select Your Default Chart Type: | |||||
| |||||
| Click on stock symbol or name for detailed view. Click on to add stock symbol to your watchlist and to view watchlist. Quick View: Move mouse or cursor over "Daily" to quickly view daily technical stock chart and over "Weekly" to view weekly technical stock chart. | |||||

 | VRTS Virtus Investment Partners, Inc. |
| Sector: Financials | |
| SubSector: Asset Management | |
| MarketCap: 601.303 Millions | |
| Recent Price: 231.64 Smart Investing & Trading Score: 64 | |
| Day Percent Change: 3.13% Day Change: 7.03 | |
| Week Change: 2.22% Year-to-date Change: -4.2% | |
| VRTS Links: Profile News Message Board | |
| Charts:- Daily , Weekly | |
| Add VRTS to Watchlist: View: Get Complete VRTS Trend Analysis ➞ | |
 | EVC Entravision Communications Corporation |
| Sector: Services & Goods | |
| SubSector: Broadcasting - TV | |
| MarketCap: 171.763 Millions | |
| Recent Price: 2.17 Smart Investing & Trading Score: 27 | |
| Day Percent Change: 3.10% Day Change: 0.06 | |
| Week Change: -3.78% Year-to-date Change: -48.1% | |
| EVC Links: Profile News Message Board | |
| Charts:- Daily , Weekly | |
| Add EVC to Watchlist: View: Get Complete EVC Trend Analysis ➞ | |
 | QUAD Quad/Graphics, Inc. |
| Sector: Services & Goods | |
| SubSector: Business Services | |
| MarketCap: 205.182 Millions | |
| Recent Price: 4.65 Smart Investing & Trading Score: 18 | |
| Day Percent Change: 3.10% Day Change: 0.14 | |
| Week Change: -3.33% Year-to-date Change: -14.2% | |
| QUAD Links: Profile News Message Board | |
| Charts:- Daily , Weekly | |
| Add QUAD to Watchlist: View: Get Complete QUAD Trend Analysis ➞ | |
 | SLQT SelectQuote, Inc. |
| Sector: Financials | |
| SubSector: Insurance Brokers | |
| MarketCap: 38257 Millions | |
| Recent Price: 2.50 Smart Investing & Trading Score: 95 | |
| Day Percent Change: 3.09% Day Change: 0.07 | |
| Week Change: 22.79% Year-to-date Change: 82.9% | |
| SLQT Links: Profile News Message Board | |
| Charts:- Daily , Weekly | |
| Add SLQT to Watchlist: View: Get Complete SLQT Trend Analysis ➞ | |
 | HCI HCI Group, Inc. |
| Sector: Financials | |
| SubSector: Property & Casualty Insurance | |
| MarketCap: 297.412 Millions | |
| Recent Price: 114.97 Smart Investing & Trading Score: 58 | |
| Day Percent Change: 3.05% Day Change: 3.40 | |
| Week Change: 3.7% Year-to-date Change: 31.5% | |
| HCI Links: Profile News Message Board | |
| Charts:- Daily , Weekly | |
| Add HCI to Watchlist: View: Get Complete HCI Trend Analysis ➞ | |
 | REVG REV Group, Inc. |
| Sector: Consumer Staples | |
| SubSector: Trucks & Other Vehicles | |
| MarketCap: 398.597 Millions | |
| Recent Price: 24.91 Smart Investing & Trading Score: 100 | |
| Day Percent Change: 3.04% Day Change: 0.73 | |
| Week Change: 7.12% Year-to-date Change: 37.1% | |
| REVG Links: Profile News Message Board | |
| Charts:- Daily , Weekly | |
| Add REVG to Watchlist: View: Get Complete REVG Trend Analysis ➞ | |
 | VRA Vera Bradley, Inc. |
| Sector: Consumer Staples | |
| SubSector: Textile - Apparel Footwear & Accessories | |
| MarketCap: 151.17 Millions | |
| Recent Price: 7.30 Smart Investing & Trading Score: 64 | |
| Day Percent Change: 2.96% Day Change: 0.21 | |
| Week Change: 6.73% Year-to-date Change: -5.2% | |
| VRA Links: Profile News Message Board | |
| Charts:- Daily , Weekly | |
| Add VRA to Watchlist: View: Get Complete VRA Trend Analysis ➞ | |
 | CLPR Clipper Realty Inc. |
| Sector: Financials | |
| SubSector: REIT - Diversified | |
| MarketCap: 113.253 Millions | |
| Recent Price: 4.04 Smart Investing & Trading Score: 50 | |
| Day Percent Change: 2.93% Day Change: 0.11 | |
| Week Change: -2.06% Year-to-date Change: -25.1% | |
| CLPR Links: Profile News Message Board | |
| Charts:- Daily , Weekly | |
| Add CLPR to Watchlist: View: Get Complete CLPR Trend Analysis ➞ | |
 | BGS B&G Foods, Inc. |
| Sector: Consumer Staples | |
| SubSector: Processed & Packaged Goods | |
| MarketCap: 1456.08 Millions | |
| Recent Price: 11.67 Smart Investing & Trading Score: 62 | |
| Day Percent Change: 2.91% Day Change: 0.33 | |
| Week Change: 2.46% Year-to-date Change: 11.1% | |
| BGS Links: Profile News Message Board | |
| Charts:- Daily , Weekly | |
| Add BGS to Watchlist: View: Get Complete BGS Trend Analysis ➞ | |
 | FWRD Forward Air Corporation |
| Sector: Transports | |
| SubSector: Air Delivery & Freight Services | |
| MarketCap: 1278.88 Millions | |
| Recent Price: 21.51 Smart Investing & Trading Score: 37 | |
| Day Percent Change: 2.87% Day Change: 0.60 | |
| Week Change: -1.24% Year-to-date Change: -65.8% | |
| FWRD Links: Profile News Message Board | |
| Charts:- Daily , Weekly | |
| Add FWRD to Watchlist: View: Get Complete FWRD Trend Analysis ➞ | |
 | PAHC Phibro Animal Health Corporation |
| Sector: Health Care | |
| SubSector: Specialized Health Services | |
| MarketCap: 852.956 Millions | |
| Recent Price: 17.25 Smart Investing & Trading Score: 75 | |
| Day Percent Change: 2.86% Day Change: 0.48 | |
| Week Change: 1.05% Year-to-date Change: 49.0% | |
| PAHC Links: Profile News Message Board | |
| Charts:- Daily , Weekly | |
| Add PAHC to Watchlist: View: Get Complete PAHC Trend Analysis ➞ | |
 | SXI Standex International Corporation |
| Sector: Industrials | |
| SubSector: Industrial Equipment & Components | |
| MarketCap: 644.109 Millions | |
| Recent Price: 171.45 Smart Investing & Trading Score: 29 | |
| Day Percent Change: 2.84% Day Change: 4.74 | |
| Week Change: -2.01% Year-to-date Change: 8.3% | |
| SXI Links: Profile News Message Board | |
| Charts:- Daily , Weekly | |
| Add SXI to Watchlist: View: Get Complete SXI Trend Analysis ➞ | |
 | DAKT Daktronics, Inc. |
| Sector: Technology | |
| SubSector: Computer Based Systems | |
| MarketCap: 223.539 Millions | |
| Recent Price: 10.81 Smart Investing & Trading Score: 95 | |
| Day Percent Change: 2.81% Day Change: 0.29 | |
| Week Change: 4.4% Year-to-date Change: 27.4% | |
| DAKT Links: Profile News Message Board | |
| Charts:- Daily , Weekly | |
| Add DAKT to Watchlist: View: Get Complete DAKT Trend Analysis ➞ | |
 | MAC The Macerich Company |
| Sector: Financials | |
| SubSector: REIT - Retail | |
| MarketCap: 1172.54 Millions | |
| Recent Price: 15.68 Smart Investing & Trading Score: 57 | |
| Day Percent Change: 2.79% Day Change: 0.43 | |
| Week Change: 9.69% Year-to-date Change: 1.6% | |
| MAC Links: Profile News Message Board | |
| Charts:- Daily , Weekly | |
| Add MAC to Watchlist: View: Get Complete MAC Trend Analysis ➞ | |
 | STRL Sterling Construction Company, Inc. |
| Sector: Industrials | |
| SubSector: Heavy Construction | |
| MarketCap: 237.395 Millions | |
| Recent Price: 125.39 Smart Investing & Trading Score: 100 | |
| Day Percent Change: 2.77% Day Change: 3.39 | |
| Week Change: 23.96% Year-to-date Change: 42.6% | |
| STRL Links: Profile News Message Board | |
| Charts:- Daily , Weekly | |
| Add STRL to Watchlist: View: Get Complete STRL Trend Analysis ➞ | |
 | BTMD biote Corp. |
| Sector: Health Care | |
| SubSector: Medical Care Facilities | |
| MarketCap: 468 Millions | |
| Recent Price: 5.93 Smart Investing & Trading Score: 52 | |
| Day Percent Change: 2.77% Day Change: 0.16 | |
| Week Change: 3.4% Year-to-date Change: 19.6% | |
| BTMD Links: Profile News Message Board | |
| Charts:- Daily , Weekly | |
| Add BTMD to Watchlist: View: Get Complete BTMD Trend Analysis ➞ | |
 | RXT Rackspace Technology, Inc. |
| Sector: Technology | |
| SubSector: Software Infrastructure | |
| MarketCap: 40287 Millions | |
| Recent Price: 1.86 Smart Investing & Trading Score: 64 | |
| Day Percent Change: 2.76% Day Change: 0.05 | |
| Week Change: 1.64% Year-to-date Change: -7.2% | |
| RXT Links: Profile News Message Board | |
| Charts:- Daily , Weekly | |
| Add RXT to Watchlist: View: Get Complete RXT Trend Analysis ➞ | |
 | SASR Sandy Spring Bancorp, Inc. |
| Sector: Financials | |
| SubSector: Regional - Mid-Atlantic Banks | |
| MarketCap: 764.659 Millions | |
| Recent Price: 22.18 Smart Investing & Trading Score: 42 | |
| Day Percent Change: 2.73% Day Change: 0.59 | |
| Week Change: -0.27% Year-to-date Change: -18.6% | |
| SASR Links: Profile News Message Board | |
| Charts:- Daily , Weekly | |
| Add SASR to Watchlist: View: Get Complete SASR Trend Analysis ➞ | |
 | GMRE Global Medical REIT Inc. |
| Sector: Industrials | |
| SubSector: Conglomerates | |
| MarketCap: 529.748 Millions | |
| Recent Price: 8.70 Smart Investing & Trading Score: 64 | |
| Day Percent Change: 2.72% Day Change: 0.23 | |
| Week Change: 3.57% Year-to-date Change: -21.6% | |
| GMRE Links: Profile News Message Board | |
| Charts:- Daily , Weekly | |
| Add GMRE to Watchlist: View: Get Complete GMRE Trend Analysis ➞ | |
 | AGS PlayAGS, Inc. |
| Sector: Services & Goods | |
| SubSector: Gaming Activities | |
| MarketCap: 77.1289 Millions | |
| Recent Price: 8.82 Smart Investing & Trading Score: 47 | |
| Day Percent Change: 2.68% Day Change: 0.23 | |
| Week Change: 5.5% Year-to-date Change: 4.6% | |
| AGS Links: Profile News Message Board | |
| Charts:- Daily , Weekly | |
| Add AGS to Watchlist: View: Get Complete AGS Trend Analysis ➞ | |
 | PWOD Penns Woods Bancorp, Inc. |
| Sector: Financials | |
| SubSector: Regional - Mid-Atlantic Banks | |
| MarketCap: 152.559 Millions | |
| Recent Price: 18.94 Smart Investing & Trading Score: 59 | |
| Day Percent Change: 2.66% Day Change: 0.49 | |
| Week Change: 2.54% Year-to-date Change: -15.9% | |
| PWOD Links: Profile News Message Board | |
| Charts:- Daily , Weekly | |
| Add PWOD to Watchlist: View: Get Complete PWOD Trend Analysis ➞ | |
 | AMCX AMC Networks Inc. |
| Sector: Services & Goods | |
| SubSector: Entertainment - Diversified | |
| MarketCap: 1477.37 Millions | |
| Recent Price: 13.10 Smart Investing & Trading Score: 100 | |
| Day Percent Change: 2.66% Day Change: 0.34 | |
| Week Change: 10.55% Year-to-date Change: -30.3% | |
| AMCX Links: Profile News Message Board | |
| Charts:- Daily , Weekly | |
| Add AMCX to Watchlist: View: Get Complete AMCX Trend Analysis ➞ | |
 | FIP FTAI Infrastructure Inc. |
| Sector: Industrials | |
| SubSector: Industrials | |
| MarketCap: 368 Millions | |
| Recent Price: 7.54 Smart Investing & Trading Score: 90 | |
| Day Percent Change: 2.66% Day Change: 0.20 | |
| Week Change: 3.36% Year-to-date Change: 93.7% | |
| FIP Links: Profile News Message Board | |
| Charts:- Daily , Weekly | |
| Add FIP to Watchlist: View: Get Complete FIP Trend Analysis ➞ | |
 | CRGY Crescent Energy Company |
| Sector: Energy | |
| SubSector: Oil & Gas E&P | |
| MarketCap: 1700 Millions | |
| Recent Price: 12.18 Smart Investing & Trading Score: 100 | |
| Day Percent Change: 2.61% Day Change: 0.31 | |
| Week Change: 16.11% Year-to-date Change: -7.7% | |
| CRGY Links: Profile News Message Board | |
| Charts:- Daily , Weekly | |
| Add CRGY to Watchlist: View: Get Complete CRGY Trend Analysis ➞ | |
 | ADTN ADTRAN, Inc. |
| Sector: Technology | |
| SubSector: Communication Equipment | |
| MarketCap: 303.539 Millions | |
| Recent Price: 5.53 Smart Investing & Trading Score: 87 | |
| Day Percent Change: 2.60% Day Change: 0.14 | |
| Week Change: 16.67% Year-to-date Change: -24.7% | |
| ADTN Links: Profile News Message Board | |
| Charts:- Daily , Weekly | |
| Add ADTN to Watchlist: View: Get Complete ADTN Trend Analysis ➞ | |
| Too many stocks? View smallcap stocks filtered by marketcap & sector |
| Marketcap: All SmallCap Stocks (default-no microcap), Large, Mid-Range, Small & MicroCap |
| Sector: Tech, Finance, Energy, Staples, Retail, Industrial, Materials, Utilities & Medical |
|
Best Stocks Today 12Stocks.com |
© 2024 12Stocks.com Terms & Conditions Privacy Contact Us
All Information Provided Only For Education And Not To Be Used For Investing or Trading. See Terms & Conditions


One More Thing ... Get Best Stocks Delivered Daily!
Never Ever Miss A Move With Our Top Ten Stocks Lists
Find Best Stocks In Any Market - Bull or Bear Market
Take A Peek At Our Top Ten Stocks Lists: Daily, Weekly, Year-to-Date & Top Trends
Find Best Stocks In Any Market - Bull or Bear Market
Take A Peek At Our Top Ten Stocks Lists: Daily, Weekly, Year-to-Date & Top Trends
Smallcap Stocks With Best Up Trends [0-bearish to 100-bullish]: Cricut [100], DASAN Zhone[100], Hyster-Yale Materials[100], Latham Group[100], Alpha and[100], Vigil Neuroscience[100], Myriad Genetics[100], Hannon Armstrong[100], Ardmore Shipping[100], Pacira BioSciences[100], Wolverine World[100]
Best Smallcap Stocks Year-to-Date:
CareMax [568.04%], Janux [398.37%], Viking [325.04%], Bakkt [273.09%], Longboard [253.85%], Alpine Immune[239.73%], Super Micro[190.86%], Avidity Biosciences[186.17%], Vera [183.88%], Cullinan Oncology[174.2%], Arcutis Bio[146.28%] Best Smallcap Stocks This Week:
DASAN Zhone[64.32%], Perficient [52.7%], Innodata [49.03%], Vigil Neuroscience[37.87%], Latham Group[37.73%], Cricut [37.35%], Thoughtworks Holding[34.67%], Children s[31.88%], Great Lakes[31.03%], Outset Medical[30.19%], Hyster-Yale Materials[26.56%] Best Smallcap Stocks Daily:
Innodata [48.59%], Cricut [42.31%], DASAN Zhone[30.11%], Hyster-Yale Materials[26.08%], Latham Group[25.75%], Ameresco [21.54%], Alpha and[20.06%], iRobot [19.18%], Vigil Neuroscience[17.55%], Myriad Genetics[17.09%], PowerSchool [16.53%]