
 Login Sign Up


| |||||
 |  | ||||

| 12Stocks.com Market Intelligence |
Best SmallCap Stocks
|
| In a hurry? Small Cap Stock Lists: Performance Trends Table, Stock Charts
Sort Small Cap stocks: Daily, Weekly, Year-to-Date, Market Cap & Trends. Filter Small Cap stocks list by sector: Show all, Tech, Finance, Energy, Staples, Retail, Industrial, Materials, Utilities and HealthCare Filter Small Cap stocks list by size: All Large Medium Small and MicroCap |
| 12Stocks.com Small Cap Stocks Performances & Trends Daily | |||||||||
|
|  The overall Smart Investing & Trading Score is 0 (0-bearish to 100-bullish) which puts Small Cap index in short term bearish trend. The Smart Investing & Trading Score from previous trading session is 18 and hence a deterioration of trend.
| ||||||||
Here are the Smart Investing & Trading Scores of the most requested small cap stocks at 12Stocks.com (click stock name for detailed review):
|


| 12Stocks.com: Investing in Smallcap Index with Stocks | |
|
The following table helps investors and traders sort through current performance and trends (as measured by Smart Investing & Trading Score) of various
stocks in the Smallcap Index. Quick View: Move mouse or cursor over stock symbol (ticker) to view short-term technical chart and over stock name to view long term chart. Click on  to add stock symbol to your watchlist and to add stock symbol to your watchlist and  to view watchlist. Click on any ticker or stock name for detailed market intelligence report for that stock. to view watchlist. Click on any ticker or stock name for detailed market intelligence report for that stock. |
12Stocks.com Performance of Stocks in Smallcap Index
| Ticker | Stock Name | Watchlist | Category | Recent Price | Smart Investing & Trading Score | Change % | YTD Change% |
| OSG | Overseas Shipholding |   | Transports | 8.45 | 63 | 0.12% | 60.34% |
| BW | Babcock & Wilcox Enterprises | | Industrials | 1.29 | 63 | -4.44% | -11.64% |
| ABM | ABM Industries | | Services & Goods | 49.17 | 63 | -2.61% | 9.68% |
| GLNG | Golar LNG | | Transports | 27.43 | 63 | -2.54% | 19.29% |
| CRCT | Cricut | | Technology | 6.69 | 63 | -2.48% | 0.22% |
| BHR | Braemar Hotels | | Financials | 2.93 | 63 | -2.33% | 17.20% |
| VHI | Valhi | | Materials | 18.70 | 63 | -2.25% | 23.11% |
| HLF | Herbalife Nutrition | | Consumer Staples | 10.97 | 63 | -2.23% | -28.11% |
| JJSF | J & J Snack Foods | | Consumer Staples | 164.14 | 63 | -2.19% | -1.79% |
| AEIS | Advanced Energy | | Technology | 106.80 | 63 | -2.00% | -1.95% |
| STEP | StepStone Group | | Financials | 42.58 | 63 | -1.96% | 33.73% |
| IKNA | Ikena Oncology | | Health Care | 1.75 | 63 | -1.41% | -12.75% |
| FA | First Advantage | | Industrials | 16.43 | 63 | -1.08% | -1.50% |
| COKE | Coca-Cola Consolidated | | Consumer Staples | 1002.70 | 63 | -0.93% | 8.00% |
| NTB | Bank of N.T. Butterfield & Son | | Financials | 33.48 | 63 | -0.77% | 4.59% |
| IDCC | InterDigital | | Technology | 116.64 | 63 | -0.73% | 7.46% |
| GVA | Granite Construction | | Industrials | 62.29 | 63 | -0.50% | 22.47% |
| MEC | Mayville Engineering | | Industrials | 16.45 | 63 | -0.24% | 14.08% |
| HROW | Harrow Health | | Health Care | 17.93 | 63 | -0.03% | 60.13% |
| AUPH | Aurinia | | Health Care | 5.65 | 63 | 5.61% | -37.15% |
| JBGS | JBG SMITH | | Financials | 14.71 | 62 | 0.48% | -13.52% |
| RMAX | RE/MAX | | Financials | 8.23 | 62 | -4.52% | -38.26% |
| EOSE | Eos Energy | | Industrials | 0.81 | 62 | -13.87% | -26.15% |
| PRME | Prime Medicine | | Health Care | 7.11 | 62 | -10.06% | -22.09% |
| AAT | American Assets | | Financials | 21.65 | 62 | -0.87% | -3.82% |


| Too many stocks? View smallcap stocks filtered by marketcap & sector |
| Marketcap: All SmallCap Stocks (default-no microcap), Large, Mid-Range, Small |
| Smallcap Sector: Tech, Finance, Energy, Staples, Retail, Industrial, Materials, & Medical |
|
Get the most comprehensive stock market coverage daily at 12Stocks.com ➞ Best Stocks Today ➞ Best Stocks Weekly ➞ Best Stocks Year-to-Date ➞ Best Stocks Trends ➞  Best Stocks Today 12Stocks.com Best Nasdaq Stocks ➞ Best S&P 500 Stocks ➞ Best Tech Stocks ➞ Best Biotech Stocks ➞ |
| Detailed Overview of SmallCap Stocks |
| SmallCap Technical Overview, Leaders & Laggards, Top SmallCap ETF Funds & Detailed SmallCap Stocks List, Charts, Trends & More |
| Smallcap: Technical Analysis, Trends & YTD Performance | |
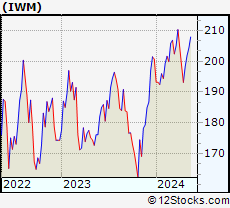
| SmallCap segment as represented by
IWM, an exchange-traded fund [ETF], holds basket of thousands of smallcap stocks from across all major sectors of the US stock market. The smallcap index (contains stocks like Riverbed & Sotheby's) is down by -0.99% and is currently underperforming the overall market by -13.41% year-to-date. Below is a quick view of technical charts and trends: | |
 IWM Weekly Chart |
|
| Long Term Trend: Not Good | |
| Medium Term Trend: Not Good | |
 IWM Daily Chart |
|
| Short Term Trend: Not Good | |
| Overall Trend Score: 0 | |
| YTD Performance: -0.99% | |
| **Trend Scores & Views Are Only For Educational Purposes And Not For Investing | |
| 12Stocks.com: Top Performing Small Cap Index Stocks | ||||||||||||||||||||||||||||||||||||||||||||||||
 The top performing Small Cap Index stocks year to date are
Now, more recently, over last week, the top performing Small Cap Index stocks on the move are


|
||||||||||||||||||||||||||||||||||||||||||||||||
| 12Stocks.com: Investing in Smallcap Index using Exchange Traded Funds | |
|
The following table shows list of key exchange traded funds (ETF) that
help investors track Smallcap index. The following list also includes leveraged ETF funds that track twice or thrice the daily returns of Smallcap indices. Short or inverse ETF funds move in the opposite direction to the index they track and are useful during market pullbacks or during bear markets. Quick View: Move mouse or cursor over ETF symbol (ticker) to view short-term technical chart and over ETF name to view long term chart. Click on ticker or stock name for detailed view. Click on to add stock symbol to your watchlist and to view watchlist. |
12Stocks.com List of ETFs that track Smallcap Index
| Ticker | ETF Name | Watchlist | Recent Price | Smart Investing & Trading Score | Change % | Week % | Year-to-date % |
| IWM | iShares Russell 2000 | | 198.73 | 0 | -1.59 | -1.23 | -0.99% |
| IJR | iShares Core S&P Small-Cap | | 104.68 | 10 | -1.49 | -2.23 | -3.3% |
| VTWO | Vanguard Russell 2000 ETF | | 80.61 | 8 | -1.56 | -0.95 | -0.61% |
| IWN | iShares Russell 2000 Value | | 148.78 | 10 | -1.54 | -2.19 | -4.22% |
| IWO | iShares Russell 2000 Growth | | 258.17 | 20 | -1.49 | -0.89 | 2.36% |
| IJS | iShares S&P Small-Cap 600 Value | | 95.28 | 0 | -1.41 | -2.71 | -7.56% |
| IJT | iShares S&P Small-Cap 600 Growth | | 125.96 | 0 | -1.69 | -1.68 | 0.66% |
| XSLV | PowerShares S&P SmallCap Low Volatil ETF | | 42.74 | 8 | -1.01 | -1.5 | -3.19% |
| SMLV | SPDR SSGA US Small Cap Low Volatil ETF | | 106.36 | 18 | -1.01 | -1.56 | -5.47% |
| SDD | ProShares UltraShort SmallCap600 | | 19.58 | 93 | 1.14 | 2.84 | 6.26% |
| SBB | ProShares Short SmallCap600 | | 16.68 | 100 | 1.90 | 2.39 | 4.71% |
| SAA | ProShares Ultra SmallCap600 | | 22.88 | 25 | -1.26 | -1.83 | -8.3% |
| 12Stocks.com: Charts, Trends, Fundamental Data and Performances of SmallCap Stocks | |
|
We now take in-depth look at all SmallCap stocks including charts, multi-period performances and overall trends (as measured by Smart Investing & Trading Score). One can sort SmallCap stocks (click link to choose) by Daily, Weekly and by Year-to-Date performances. Also, one can sort by size of the company or by market capitalization. |
| Select Your Default Chart Type: | |||||
| |||||
| Click on stock symbol or name for detailed view. Click on to add stock symbol to your watchlist and to view watchlist. Quick View: Move mouse or cursor over "Daily" to quickly view daily technical stock chart and over "Weekly" to view weekly technical stock chart. | |||||

 | OSG Overseas Shipholding Group, Inc. |
| Sector: Transports | |
| SubSector: Shipping | |
| MarketCap: 184.814 Millions | |
| Recent Price: 8.45 Smart Investing & Trading Score: 63 | |
| Day Percent Change: 0.12% Day Change: 0.01 | |
| Week Change: 0.24% Year-to-date Change: 60.3% | |
| OSG Links: Profile News Message Board | |
| Charts:- Daily , Weekly | |
| Add OSG to Watchlist: View: Get Complete OSG Trend Analysis ➞ | |
 | BW Babcock & Wilcox Enterprises, Inc. |
| Sector: Industrials | |
| SubSector: Industrial Electrical Equipment | |
| MarketCap: 59.0879 Millions | |
| Recent Price: 1.29 Smart Investing & Trading Score: 63 | |
| Day Percent Change: -4.44% Day Change: -0.06 | |
| Week Change: 8.4% Year-to-date Change: -11.6% | |
| BW Links: Profile News Message Board | |
| Charts:- Daily , Weekly | |
| Add BW to Watchlist: View: Get Complete BW Trend Analysis ➞ | |
 | ABM ABM Industries Incorporated |
| Sector: Services & Goods | |
| SubSector: Business Services | |
| MarketCap: 1706.72 Millions | |
| Recent Price: 49.17 Smart Investing & Trading Score: 63 | |
| Day Percent Change: -2.61% Day Change: -1.32 | |
| Week Change: -3.47% Year-to-date Change: 9.7% | |
| ABM Links: Profile News Message Board | |
| Charts:- Daily , Weekly | |
| Add ABM to Watchlist: View: Get Complete ABM Trend Analysis ➞ | |
 | GLNG Golar LNG Limited |
| Sector: Transports | |
| SubSector: Shipping | |
| MarketCap: 854.414 Millions | |
| Recent Price: 27.43 Smart Investing & Trading Score: 63 | |
| Day Percent Change: -2.54% Day Change: -0.71 | |
| Week Change: 3.3% Year-to-date Change: 19.3% | |
| GLNG Links: Profile News Message Board | |
| Charts:- Daily , Weekly | |
| Add GLNG to Watchlist: View: Get Complete GLNG Trend Analysis ➞ | |
 | CRCT Cricut, Inc. |
| Sector: Technology | |
| SubSector: Computer Hardware | |
| MarketCap: 2920 Millions | |
| Recent Price: 6.69 Smart Investing & Trading Score: 63 | |
| Day Percent Change: -2.48% Day Change: -0.17 | |
| Week Change: -0.15% Year-to-date Change: 0.2% | |
| CRCT Links: Profile News Message Board | |
| Charts:- Daily , Weekly | |
| Add CRCT to Watchlist: View: Get Complete CRCT Trend Analysis ➞ | |
 | BHR Braemar Hotels & Resorts, Inc. |
| Sector: Financials | |
| SubSector: REIT - Hotel/Motel | |
| MarketCap: 88.9434 Millions | |
| Recent Price: 2.93 Smart Investing & Trading Score: 63 | |
| Day Percent Change: -2.33% Day Change: -0.07 | |
| Week Change: 3.17% Year-to-date Change: 17.2% | |
| BHR Links: Profile News Message Board | |
| Charts:- Daily , Weekly | |
| Add BHR to Watchlist: View: Get Complete BHR Trend Analysis ➞ | |
 | VHI Valhi, Inc. |
| Sector: Materials | |
| SubSector: Chemicals - Major Diversified | |
| MarketCap: 394.336 Millions | |
| Recent Price: 18.70 Smart Investing & Trading Score: 63 | |
| Day Percent Change: -2.25% Day Change: -0.43 | |
| Week Change: 0% Year-to-date Change: 23.1% | |
| VHI Links: Profile News Message Board | |
| Charts:- Daily , Weekly | |
| Add VHI to Watchlist: View: Get Complete VHI Trend Analysis ➞ | |
 | HLF Herbalife Nutrition Ltd. |
| Sector: Consumer Staples | |
| SubSector: Personal Products | |
| MarketCap: 4884.65 Millions | |
| Recent Price: 10.97 Smart Investing & Trading Score: 63 | |
| Day Percent Change: -2.23% Day Change: -0.25 | |
| Week Change: -2.32% Year-to-date Change: -28.1% | |
| HLF Links: Profile News Message Board | |
| Charts:- Daily , Weekly | |
| Add HLF to Watchlist: View: Get Complete HLF Trend Analysis ➞ | |
 | JJSF J & J Snack Foods Corp. |
| Sector: Consumer Staples | |
| SubSector: Processed & Packaged Goods | |
| MarketCap: 2706.28 Millions | |
| Recent Price: 164.14 Smart Investing & Trading Score: 63 | |
| Day Percent Change: -2.19% Day Change: -3.68 | |
| Week Change: 0.79% Year-to-date Change: -1.8% | |
| JJSF Links: Profile News Message Board | |
| Charts:- Daily , Weekly | |
| Add JJSF to Watchlist: View: Get Complete JJSF Trend Analysis ➞ | |
 | AEIS Advanced Energy Industries, Inc. |
| Sector: Technology | |
| SubSector: Diversified Electronics | |
| MarketCap: 1641.86 Millions | |
| Recent Price: 106.80 Smart Investing & Trading Score: 63 | |
| Day Percent Change: -2.00% Day Change: -2.17 | |
| Week Change: 1.33% Year-to-date Change: -2.0% | |
| AEIS Links: Profile News Message Board | |
| Charts:- Daily , Weekly | |
| Add AEIS to Watchlist: View: Get Complete AEIS Trend Analysis ➞ | |
 | STEP StepStone Group Inc. |
| Sector: Financials | |
| SubSector: Asset Management | |
| MarketCap: 30757 Millions | |
| Recent Price: 42.58 Smart Investing & Trading Score: 63 | |
| Day Percent Change: -1.96% Day Change: -0.85 | |
| Week Change: 2.73% Year-to-date Change: 33.7% | |
| STEP Links: Profile News Message Board | |
| Charts:- Daily , Weekly | |
| Add STEP to Watchlist: View: Get Complete STEP Trend Analysis ➞ | |
 | IKNA Ikena Oncology, Inc. |
| Sector: Health Care | |
| SubSector: Biotechnology | |
| MarketCap: 277 Millions | |
| Recent Price: 1.75 Smart Investing & Trading Score: 63 | |
| Day Percent Change: -1.41% Day Change: -0.02 | |
| Week Change: -0.29% Year-to-date Change: -12.8% | |
| IKNA Links: Profile News Message Board | |
| Charts:- Daily , Weekly | |
| Add IKNA to Watchlist: View: Get Complete IKNA Trend Analysis ➞ | |
 | FA First Advantage Corporation |
| Sector: Industrials | |
| SubSector: Specialty Business Services | |
| MarketCap: 2170 Millions | |
| Recent Price: 16.43 Smart Investing & Trading Score: 63 | |
| Day Percent Change: -1.08% Day Change: -0.18 | |
| Week Change: -0.12% Year-to-date Change: -1.5% | |
| FA Links: Profile News Message Board | |
| Charts:- Daily , Weekly | |
| Add FA to Watchlist: View: Get Complete FA Trend Analysis ➞ | |
 | COKE Coca-Cola Consolidated, Inc. |
| Sector: Consumer Staples | |
| SubSector: Beverages - Soft Drinks | |
| MarketCap: 1392.2 Millions | |
| Recent Price: 1002.70 Smart Investing & Trading Score: 63 | |
| Day Percent Change: -0.93% Day Change: -9.39 | |
| Week Change: -1.8% Year-to-date Change: 8.0% | |
| COKE Links: Profile News Message Board | |
| Charts:- Daily , Weekly | |
| Add COKE to Watchlist: View: Get Complete COKE Trend Analysis ➞ | |
 | NTB The Bank of N.T. Butterfield & Son Limited |
| Sector: Financials | |
| SubSector: Foreign Regional Banks | |
| MarketCap: 889.379 Millions | |
| Recent Price: 33.48 Smart Investing & Trading Score: 63 | |
| Day Percent Change: -0.77% Day Change: -0.26 | |
| Week Change: -0.77% Year-to-date Change: 4.6% | |
| NTB Links: Profile News Message Board | |
| Charts:- Daily , Weekly | |
| Add NTB to Watchlist: View: Get Complete NTB Trend Analysis ➞ | |
 | IDCC InterDigital, Inc. |
| Sector: Technology | |
| SubSector: Wireless Communications | |
| MarketCap: 1225.27 Millions | |
| Recent Price: 116.64 Smart Investing & Trading Score: 63 | |
| Day Percent Change: -0.73% Day Change: -0.86 | |
| Week Change: -0.56% Year-to-date Change: 7.5% | |
| IDCC Links: Profile News Message Board | |
| Charts:- Daily , Weekly | |
| Add IDCC to Watchlist: View: Get Complete IDCC Trend Analysis ➞ | |
 | GVA Granite Construction Incorporated |
| Sector: Industrials | |
| SubSector: Heavy Construction | |
| MarketCap: 725.895 Millions | |
| Recent Price: 62.29 Smart Investing & Trading Score: 63 | |
| Day Percent Change: -0.50% Day Change: -0.31 | |
| Week Change: 5.29% Year-to-date Change: 22.5% | |
| GVA Links: Profile News Message Board | |
| Charts:- Daily , Weekly | |
| Add GVA to Watchlist: View: Get Complete GVA Trend Analysis ➞ | |
 | MEC Mayville Engineering Company, Inc. |
| Sector: Industrials | |
| SubSector: Metal Fabrication | |
| MarketCap: 143.55 Millions | |
| Recent Price: 16.45 Smart Investing & Trading Score: 63 | |
| Day Percent Change: -0.24% Day Change: -0.04 | |
| Week Change: 0.24% Year-to-date Change: 14.1% | |
| MEC Links: Profile News Message Board | |
| Charts:- Daily , Weekly | |
| Add MEC to Watchlist: View: Get Complete MEC Trend Analysis ➞ | |
 | HROW Harrow Health, Inc. |
| Sector: Health Care | |
| SubSector: Drug Manufacturers - Other | |
| MarketCap: 104.033 Millions | |
| Recent Price: 17.93 Smart Investing & Trading Score: 63 | |
| Day Percent Change: -0.03% Day Change: -0.01 | |
| Week Change: -1.29% Year-to-date Change: 60.1% | |
| HROW Links: Profile News Message Board | |
| Charts:- Daily , Weekly | |
| Add HROW to Watchlist: View: Get Complete HROW Trend Analysis ➞ | |
 | AUPH Aurinia Pharmaceuticals Inc. |
| Sector: Health Care | |
| SubSector: Biotechnology | |
| MarketCap: 1319.75 Millions | |
| Recent Price: 5.65 Smart Investing & Trading Score: 63 | |
| Day Percent Change: 5.61% Day Change: 0.30 | |
| Week Change: 6.6% Year-to-date Change: -37.2% | |
| AUPH Links: Profile News Message Board | |
| Charts:- Daily , Weekly | |
| Add AUPH to Watchlist: View: Get Complete AUPH Trend Analysis ➞ | |
 | JBGS JBG SMITH Properties |
| Sector: Financials | |
| SubSector: Property Management | |
| MarketCap: 4335.32 Millions | |
| Recent Price: 14.71 Smart Investing & Trading Score: 62 | |
| Day Percent Change: 0.48% Day Change: 0.07 | |
| Week Change: 1.45% Year-to-date Change: -13.5% | |
| JBGS Links: Profile News Message Board | |
| Charts:- Daily , Weekly | |
| Add JBGS to Watchlist: View: Get Complete JBGS Trend Analysis ➞ | |
 | RMAX RE/MAX Holdings, Inc. |
| Sector: Financials | |
| SubSector: Property Management | |
| MarketCap: 334.742 Millions | |
| Recent Price: 8.23 Smart Investing & Trading Score: 62 | |
| Day Percent Change: -4.52% Day Change: -0.39 | |
| Week Change: -3.86% Year-to-date Change: -38.3% | |
| RMAX Links: Profile News Message Board | |
| Charts:- Daily , Weekly | |
| Add RMAX to Watchlist: View: Get Complete RMAX Trend Analysis ➞ | |
 | EOSE Eos Energy Enterprises, Inc. |
| Sector: Industrials | |
| SubSector: Electrical Equipment & Parts | |
| MarketCap: 76627 Millions | |
| Recent Price: 0.81 Smart Investing & Trading Score: 62 | |
| Day Percent Change: -13.87% Day Change: -0.13 | |
| Week Change: 18.01% Year-to-date Change: -26.2% | |
| EOSE Links: Profile News Message Board | |
| Charts:- Daily , Weekly | |
| Add EOSE to Watchlist: View: Get Complete EOSE Trend Analysis ➞ | |
 | PRME Prime Medicine, Inc. |
| Sector: Health Care | |
| SubSector: Biotechnology | |
| MarketCap: 1440 Millions | |
| Recent Price: 7.11 Smart Investing & Trading Score: 62 | |
| Day Percent Change: -10.06% Day Change: -0.79 | |
| Week Change: 8.14% Year-to-date Change: -22.1% | |
| PRME Links: Profile News Message Board | |
| Charts:- Daily , Weekly | |
| Add PRME to Watchlist: View: Get Complete PRME Trend Analysis ➞ | |
 | AAT American Assets Trust, Inc. |
| Sector: Financials | |
| SubSector: REIT - Retail | |
| MarketCap: 1580.54 Millions | |
| Recent Price: 21.65 Smart Investing & Trading Score: 62 | |
| Day Percent Change: -0.87% Day Change: -0.19 | |
| Week Change: 1.12% Year-to-date Change: -3.8% | |
| AAT Links: Profile News Message Board | |
| Charts:- Daily , Weekly | |
| Add AAT to Watchlist: View: Get Complete AAT Trend Analysis ➞ | |
| Too many stocks? View smallcap stocks filtered by marketcap & sector |
| Marketcap: All SmallCap Stocks (default-no microcap), Large, Mid-Range, Small & MicroCap |
| Sector: Tech, Finance, Energy, Staples, Retail, Industrial, Materials, Utilities & Medical |
|
Best Stocks Today 12Stocks.com |
© 2024 12Stocks.com Terms & Conditions Privacy Contact Us
All Information Provided Only For Education And Not To Be Used For Investing or Trading. See Terms & Conditions


One More Thing ... Get Best Stocks Delivered Daily!
Never Ever Miss A Move With Our Top Ten Stocks Lists
Find Best Stocks In Any Market - Bull or Bear Market
Take A Peek At Our Top Ten Stocks Lists: Daily, Weekly, Year-to-Date & Top Trends
Find Best Stocks In Any Market - Bull or Bear Market
Take A Peek At Our Top Ten Stocks Lists: Daily, Weekly, Year-to-Date & Top Trends
Smallcap Stocks With Best Up Trends [0-bearish to 100-bullish]: 2U [100], UroGen Pharma[100], Chimera [100], Terns [100], BRC [100], Rackspace [100], Commvault Systems[100], Instructure [100], Anika [100], United Homes[100], Immersion [100]
Best Smallcap Stocks Year-to-Date:
Li-Cycle [581.56%], 2U [487.8%], CareMax [467.01%], Dominion Midstream[411.32%], Avidity Biosciences[338.83%], Janux [290.88%], Summit [221.46%], Stoke [213.69%], Longboard [203.19%], Novavax [199.9%], Super Micro[197.18%] Best Smallcap Stocks This Week:
Dominion Midstream[683.67%], UroGen Pharma[51.4%], Li-Cycle [49.82%], Avidity Biosciences[49.14%], Kaltura [48.65%], Scilex Holding[45.87%], Biomea Fusion[36.35%], Tango [29.71%], Nerdy [27.89%], United Homes[24.05%], Cipher Mining[23.08%] Best Smallcap Stocks Daily:
2U [3078.02%], Li-Cycle [18.44%], Disc Medicine[17.85%], Ocular Therapeutix[14.48%], UroGen Pharma[14.42%], FTC Solar[12.54%], DMC Global[9.27%], Tutor Perini[7.92%], Grindr [7.64%], Chimera [7.54%], Haverty Furniture[7.48%]