
 Login Sign Up


| |||||
 |  | ||||

| 12Stocks.com Market Intelligence |
Best S&P 500 Stocks
|
On this page, you will find the most comprehensive analysis of S&P 500 stocks and ETFs - from latest trends to performances to charts ➞. First, here are the year-to-date (YTD) performances of the most requested S&P 500 stocks at 12Stocks.com (click stock for review):
| NVIDIA 73% | ||
| Amazon.com 22% | ||
| Google 19% | ||
| Merck 18% | ||
| Walmart 14% | ||
| Caterpillar 13% | ||
| JPMorgan Chase 13% | ||
| Goldman Sachs 12% | ||
| Chevron 8% | ||
| Microsoft 6% | ||
| Johnson & Johnson -4% | ||
| McDonald s -8% | ||
| Apple -10% | ||
| Gilead -19% | ||
| Starbucks -22% | ||
| Boeing -31% | ||
| Intel -39% | ||
| Quick: S&P 500 Stocks Lists: Performances & Trends, S&P 500 Stock Charts
Sort S&P 500 stocks: Daily, Weekly, Year-to-Date, Market Cap & Trends. Filter S&P 500 stocks list by sector: Show all, Tech, Finance, Energy, Staples, Retail, Industrial, Materials, Utilities and HealthCare |
| 12Stocks.com S&P 500 Stocks Performances & Trends Daily Report | |||||||||
|
| 
The overall Smart Investing & Trading Score is 30 (0-bearish to 100-bullish) which puts S&P 500 index in short term bearish to neutral trend. The Smart Investing & Trading Score from previous trading session is 7 and hence an improvement of trend. | ||||||||
Here are the Smart Investing & Trading Scores of the most requested S&P 500 stocks at 12Stocks.com (click stock name for detailed review):
|


| 12Stocks.com: Top Performing S&P 500 Index Stocks | ||||||||||||||||||||||||||||||||||||||||||||||||
 The top performing S&P 500 Index stocks year to date are
Now, more recently, over last week, the top performing S&P 500 Index stocks on the move are


|
||||||||||||||||||||||||||||||||||||||||||||||||
| 12Stocks.com: Investing in S&P 500 Index with Stocks | |
|
The following table helps investors and traders sort through current performance and trends (as measured by Smart Investing & Trading Score) of various
stocks in the S&P 500 Index. Quick View: Move mouse or cursor over stock symbol (ticker) to view short-term technical chart and over stock name to view long term chart. Click on  to add stock symbol to your watchlist and to add stock symbol to your watchlist and  to view watchlist. Click on any ticker or stock name for detailed market intelligence report for that stock. to view watchlist. Click on any ticker or stock name for detailed market intelligence report for that stock. |
12Stocks.com Performance of Stocks in S&P 500 Index
| Ticker | Stock Name | Watchlist | Category | Recent Price | Smart Investing & Trading Score | Change % | YTD Change% |
| LVS | Las Vegas |   | Services & Goods | 46.65 | 25 | 4.74% | -5.20% |
| HST | Host Hotels | | Financials | 18.45 | 0 | -2.07% | -5.24% |
| USB | U.S. Bancorp | | Financials | 40.97 | 24 | -0.19% | -5.34% |
| SPGI | S&P Global | | Services & Goods | 416.96 | 17 | 0.18% | -5.35% |
| STT | State Street | | Financials | 73.20 | 23 | 0.12% | -5.50% |
| TAP | Molson Coors | | Consumer Staples | 57.80 | 17 | 1.26% | -5.57% |
| HII | Huntington Ingalls | | Industrials | 245.19 | 0 | -11.50% | -5.57% |
| LYV | Live Nation | | Services & Goods | 88.27 | 10 | -1.13% | -5.69% |
| MOH | Molina Healthcare | | Health Care | 339.55 | 10 | 0.20% | -6.02% |
| EA | Electronic Arts | | Technology | 128.50 | 49 | 0.25% | -6.07% |
| STE | STERIS | | Health Care | 206.24 | 49 | 0.59% | -6.19% |
| ROP | Roper Technologies | | Industrials | 510.82 | 8 | -0.77% | -6.30% |
| CHRW | C.H. Robinson | | Transports | 80.93 | 100 | 12.26% | -6.32% |
| UNH | UnitedHealth | | Health Care | 492.97 | 75 | 1.83% | -6.36% |
| UPS | United Parcel | | Transports | 147.22 | 73 | 0.89% | -6.37% |
| IPG | Interpublic | | Services & Goods | 30.53 | 18 | 0.10% | -6.46% |
| BKR | Baker Hughes | | Services & Goods | 31.93 | 36 | 0.13% | -6.58% |
| BLK | BlackRock | | Financials | 757.00 | 25 | 0.72% | -6.75% |
| CBRE | CBRE | | Financials | 86.79 | 17 | 0.60% | -6.77% |
| ARE | Alexandria Real | | Financials | 118.17 | 20 | 1.18% | -6.78% |
| CMA | Comerica | | Financials | 51.87 | 68 | 1.29% | -7.06% |
| CF | CF Industries | | Materials | 73.87 | 0 | -5.26% | -7.08% |
| IT | Gartner | | Technology | 419.04 | 10 | -0.79% | -7.11% |
| HPQ | HP | | Technology | 27.94 | 10 | 0.68% | -7.15% |
| FFIV | F5 Networks | | Technology | 166.07 | 0 | -0.33% | -7.21% |
| For chart view version of above stock list: Chart View ➞ 0 - 25 , 25 - 50 , 50 - 75 , 75 - 100 , 100 - 125 , 125 - 150 , 150 - 175 , 175 - 200 , 200 - 225 , 225 - 250 , 250 - 275 , 275 - 300 , 300 - 325 , 325 - 350 , 350 - 375 , 375 - 400 , 400 - 425 , 425 - 450 , 450 - 475 , 475 - 500 | ||
 | Click To Change The Sort Order: By Market Cap or Company Size Performance: Year-to-date, Week and Day |  |
|
Get the most comprehensive stock market coverage daily at 12Stocks.com ➞ Best Stocks Today ➞ Best Stocks Weekly ➞ Best Stocks Year-to-Date ➞ Best Stocks Trends ➞  Best Stocks Today 12Stocks.com Best Nasdaq Stocks ➞ Best S&P 500 Stocks ➞ Best Tech Stocks ➞ Best Biotech Stocks ➞ |
| Detailed Overview of S&P 500 Stocks |
| S&P 500 Technical Overview, Leaders & Laggards, Top S&P 500 ETF Funds & Detailed S&P 500 Stocks List, Charts, Trends & More |
| S&P 500: Technical Analysis, Trends & YTD Performance | |
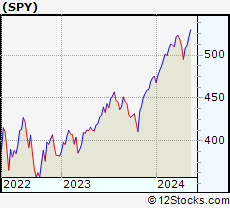
| S&P 500 index as represented by
SPY, an exchange-traded fund [ETF], holds basket of five hundred (mostly largecap) stocks from across all major sectors of the US stock market. The S&P 500 index (contains stocks like Apple and Exxon) is up by 6.25% and is currently outperforming the overall market by 0.63% year-to-date. Below is a quick view of technical charts and trends: | |
 SPY Weekly Chart |
|
| Long Term Trend: Not Good | |
| Medium Term Trend: Not Good | |
 SPY Daily Chart |
|
| Short Term Trend: Deteriorating | |
| Overall Trend Score: 30 | |
| YTD Performance: 6.25% | |
| **Trend Scores & Views Are Only For Educational Purposes And Not For Investing | |
| 12Stocks.com: Investing in S&P 500 Index using Exchange Traded Funds | |
|
The following table shows list of key exchange traded funds (ETF) that
help investors track S&P 500 index. The following list also includes leveraged ETF funds that track twice or thrice the daily returns of S&P 500 indices. Short or inverse ETF funds move in the opposite direction to the index they track and are useful during market pullbacks or during bear markets. Quick View: Move mouse or cursor over ETF symbol (ticker) to view short-term technical chart and over ETF name to view long term chart. Click on ticker or stock name for detailed view. Click on to add stock symbol to your watchlist and to view watchlist. |
12Stocks.com List of ETFs that track S&P 500 Index
| Ticker | ETF Name | Watchlist | Recent Price | Smart Investing & Trading Score | Change % | Week % | Year-to-date % |
| SPY | SPDR S&P 500 ETF | | 505.03 | 30 | 0.94 | -0.64 | 6.25% |
| IVV | iShares Core S&P 500 ETF | | 507.46 | 17 | 0.91 | -0.65 | 6.25% |
| VOO | Vanguard 500 ETF | | 464.22 | 17 | 0.93 | -0.64 | 6.28% |
| OEF | iShares S&P 100 | | 240.23 | 30 | 1.16 | -0.55 | 7.54% |
| SSO | ProShares Ultra S&P500 | | 71.66 | 17 | 1.80 | -1.44 | 10.13% |
| UPRO | ProShares UltraPro S&P500 | | 62.37 | 17 | 2.75 | -2.27 | 13.94% |
| SPXL | Direxion Daily S&P500 Bull 3X ETF | | 118.44 | 17 | 2.68 | -2.23 | 13.9% |
| SH | ProShares Short S&P500 | | 12.38 | 70 | -0.88 | 0.81 | -4.7% |
| SDS | ProShares UltraShort S&P500 | | 26.90 | 83 | -1.82 | 1.39 | -10.09% |
| SPXU | ProShares UltraPro Short S&P500 | | 36.26 | 78 | -2.55 | 2.14 | -15.67% |
| SPXS | Direxion Daily S&P 500 Bear 3X ETF | | 9.81 | 78 | -2.58 | 2.08 | -15.06% |
| 12Stocks.com: Charts, Trends, Fundamental Data and Performances of S&P 500 Stocks | |
|
We now take in-depth look at all S&P 500 stocks including charts, multi-period performances and overall trends (as measured by Smart Investing & Trading Score). One can sort S&P 500 stocks (click link to choose) by Daily, Weekly and by Year-to-Date performances. Also, one can sort by size of the company or by market capitalization. |
| Select Your Default Chart Type: | |||||
| |||||
| Click on stock symbol or name for detailed view. Click on to add stock symbol to your watchlist and to view watchlist. Quick View: Move mouse or cursor over "Daily" to quickly view daily technical stock chart and over "Weekly" to view weekly technical stock chart. | |||||

 | LVS Las Vegas Sands Corp. |
| Sector: Services & Goods | |
| SubSector: Resorts & Casinos | |
| MarketCap: 36431.6 Millions | |
| Recent Price: 46.65 Smart Investing & Trading Score: 25 | |
| Day Percent Change: 4.74% Day Change: 2.11 | |
| Week Change: 2.64% Year-to-date Change: -5.2% | |
| LVS Links: Profile News Message Board | |
| Charts:- Daily , Weekly | |
| Add LVS to Watchlist: View: Get LVS Trend Analysis ➞ | |
 | HST Host Hotels & Resorts, Inc. |
| Sector: Financials | |
| SubSector: REIT - Hotel/Motel | |
| MarketCap: 8253.74 Millions | |
| Recent Price: 18.45 Smart Investing & Trading Score: 0 | |
| Day Percent Change: -2.07% Day Change: -0.39 | |
| Week Change: -2.17% Year-to-date Change: -5.2% | |
| HST Links: Profile News Message Board | |
| Charts:- Daily , Weekly | |
| Add HST to Watchlist: View: Get HST Trend Analysis ➞ | |
 | USB U.S. Bancorp |
| Sector: Financials | |
| SubSector: Regional - Midwest Banks | |
| MarketCap: 56757.8 Millions | |
| Recent Price: 40.97 Smart Investing & Trading Score: 24 | |
| Day Percent Change: -0.19% Day Change: -0.08 | |
| Week Change: -0.36% Year-to-date Change: -5.3% | |
| USB Links: Profile News Message Board | |
| Charts:- Daily , Weekly | |
| Add USB to Watchlist: View: Get USB Trend Analysis ➞ | |
 | SPGI S&P Global Inc. |
| Sector: Services & Goods | |
| SubSector: Business Services | |
| MarketCap: 55247.9 Millions | |
| Recent Price: 416.96 Smart Investing & Trading Score: 17 | |
| Day Percent Change: 0.18% Day Change: 0.76 | |
| Week Change: 0.28% Year-to-date Change: -5.4% | |
| SPGI Links: Profile News Message Board | |
| Charts:- Daily , Weekly | |
| Add SPGI to Watchlist: View: Get SPGI Trend Analysis ➞ | |
 | STT State Street Corporation |
| Sector: Financials | |
| SubSector: Asset Management | |
| MarketCap: 18623 Millions | |
| Recent Price: 73.20 Smart Investing & Trading Score: 23 | |
| Day Percent Change: 0.12% Day Change: 0.09 | |
| Week Change: -0.26% Year-to-date Change: -5.5% | |
| STT Links: Profile News Message Board | |
| Charts:- Daily , Weekly | |
| Add STT to Watchlist: View: Get STT Trend Analysis ➞ | |
 | TAP Molson Coors Beverage Company |
| Sector: Consumer Staples | |
| SubSector: Beverages - Brewers | |
| MarketCap: 8619.97 Millions | |
| Recent Price: 57.80 Smart Investing & Trading Score: 17 | |
| Day Percent Change: 1.26% Day Change: 0.72 | |
| Week Change: -7.58% Year-to-date Change: -5.6% | |
| TAP Links: Profile News Message Board | |
| Charts:- Daily , Weekly | |
| Add TAP to Watchlist: View: Get TAP Trend Analysis ➞ | |
 | HII Huntington Ingalls Industries, Inc. |
| Sector: Industrials | |
| SubSector: Aerospace/Defense Products & Services | |
| MarketCap: 7276.11 Millions | |
| Recent Price: 245.19 Smart Investing & Trading Score: 0 | |
| Day Percent Change: -11.50% Day Change: -31.87 | |
| Week Change: -11.47% Year-to-date Change: -5.6% | |
| HII Links: Profile News Message Board | |
| Charts:- Daily , Weekly | |
| Add HII to Watchlist: View: Get HII Trend Analysis ➞ | |
 | LYV Live Nation Entertainment, Inc. |
| Sector: Services & Goods | |
| SubSector: Entertainment - Diversified | |
| MarketCap: 8457.17 Millions | |
| Recent Price: 88.27 Smart Investing & Trading Score: 10 | |
| Day Percent Change: -1.13% Day Change: -1.01 | |
| Week Change: -1.74% Year-to-date Change: -5.7% | |
| LYV Links: Profile News Message Board | |
| Charts:- Daily , Weekly | |
| Add LYV to Watchlist: View: Get LYV Trend Analysis ➞ | |
 | MOH Molina Healthcare, Inc. |
| Sector: Health Care | |
| SubSector: Health Care Plans | |
| MarketCap: 7235.6 Millions | |
| Recent Price: 339.55 Smart Investing & Trading Score: 10 | |
| Day Percent Change: 0.20% Day Change: 0.68 | |
| Week Change: -0.78% Year-to-date Change: -6.0% | |
| MOH Links: Profile News Message Board | |
| Charts:- Daily , Weekly | |
| Add MOH to Watchlist: View: Get MOH Trend Analysis ➞ | |
 | EA Electronic Arts Inc. |
| Sector: Technology | |
| SubSector: Multimedia & Graphics Software | |
| MarketCap: 27296.5 Millions | |
| Recent Price: 128.50 Smart Investing & Trading Score: 49 | |
| Day Percent Change: 0.25% Day Change: 0.32 | |
| Week Change: 0.47% Year-to-date Change: -6.1% | |
| EA Links: Profile News Message Board | |
| Charts:- Daily , Weekly | |
| Add EA to Watchlist: View: Get EA Trend Analysis ➞ | |
 | STE STERIS plc |
| Sector: Health Care | |
| SubSector: Medical Instruments & Supplies | |
| MarketCap: 10875 Millions | |
| Recent Price: 206.24 Smart Investing & Trading Score: 49 | |
| Day Percent Change: 0.59% Day Change: 1.20 | |
| Week Change: 1.15% Year-to-date Change: -6.2% | |
| STE Links: Profile News Message Board | |
| Charts:- Daily , Weekly | |
| Add STE to Watchlist: View: Get STE Trend Analysis ➞ | |
 | ROP Roper Technologies, Inc. |
| Sector: Industrials | |
| SubSector: Diversified Machinery | |
| MarketCap: 33366.2 Millions | |
| Recent Price: 510.82 Smart Investing & Trading Score: 8 | |
| Day Percent Change: -0.77% Day Change: -3.94 | |
| Week Change: -3.03% Year-to-date Change: -6.3% | |
| ROP Links: Profile News Message Board | |
| Charts:- Daily , Weekly | |
| Add ROP to Watchlist: View: Get ROP Trend Analysis ➞ | |
 | CHRW C.H. Robinson Worldwide, Inc. |
| Sector: Transports | |
| SubSector: Air Delivery & Freight Services | |
| MarketCap: 9194.78 Millions | |
| Recent Price: 80.93 Smart Investing & Trading Score: 100 | |
| Day Percent Change: 12.26% Day Change: 8.84 | |
| Week Change: 15.25% Year-to-date Change: -6.3% | |
| CHRW Links: Profile News Message Board | |
| Charts:- Daily , Weekly | |
| Add CHRW to Watchlist: View: Get CHRW Trend Analysis ➞ | |
 | UNH UnitedHealth Group Incorporated |
| Sector: Health Care | |
| SubSector: Health Care Plans | |
| MarketCap: 217384 Millions | |
| Recent Price: 492.97 Smart Investing & Trading Score: 75 | |
| Day Percent Change: 1.83% Day Change: 8.86 | |
| Week Change: -0.48% Year-to-date Change: -6.4% | |
| UNH Links: Profile News Message Board | |
| Charts:- Daily , Weekly | |
| Add UNH to Watchlist: View: Get UNH Trend Analysis ➞ | |
 | UPS United Parcel Service, Inc. |
| Sector: Transports | |
| SubSector: Air Delivery & Freight Services | |
| MarketCap: 81928.9 Millions | |
| Recent Price: 147.22 Smart Investing & Trading Score: 73 | |
| Day Percent Change: 0.89% Day Change: 1.30 | |
| Week Change: -0.25% Year-to-date Change: -6.4% | |
| UPS Links: Profile News Message Board | |
| Charts:- Daily , Weekly | |
| Add UPS to Watchlist: View: Get UPS Trend Analysis ➞ | |
 | IPG The Interpublic Group of Companies, Inc. |
| Sector: Services & Goods | |
| SubSector: Advertising Agencies | |
| MarketCap: 5730.55 Millions | |
| Recent Price: 30.53 Smart Investing & Trading Score: 18 | |
| Day Percent Change: 0.10% Day Change: 0.03 | |
| Week Change: -2.99% Year-to-date Change: -6.5% | |
| IPG Links: Profile News Message Board | |
| Charts:- Daily , Weekly | |
| Add IPG to Watchlist: View: Get IPG Trend Analysis ➞ | |
 | BKR Baker Hughes Company |
| Sector: Services & Goods | |
| SubSector: Technical Services | |
| MarketCap: 1330 Millions | |
| Recent Price: 31.93 Smart Investing & Trading Score: 36 | |
| Day Percent Change: 0.13% Day Change: 0.04 | |
| Week Change: -2.77% Year-to-date Change: -6.6% | |
| BKR Links: Profile News Message Board | |
| Charts:- Daily , Weekly | |
| Add BKR to Watchlist: View: Get BKR Trend Analysis ➞ | |
 | BLK BlackRock, Inc. |
| Sector: Financials | |
| SubSector: Asset Management | |
| MarketCap: 61284.9 Millions | |
| Recent Price: 757.00 Smart Investing & Trading Score: 25 | |
| Day Percent Change: 0.72% Day Change: 5.42 | |
| Week Change: -0.77% Year-to-date Change: -6.8% | |
| BLK Links: Profile News Message Board | |
| Charts:- Daily , Weekly | |
| Add BLK to Watchlist: View: Get BLK Trend Analysis ➞ | |
 | CBRE CBRE Group, Inc. |
| Sector: Financials | |
| SubSector: Property Management | |
| MarketCap: 12799.2 Millions | |
| Recent Price: 86.79 Smart Investing & Trading Score: 17 | |
| Day Percent Change: 0.60% Day Change: 0.52 | |
| Week Change: -0.62% Year-to-date Change: -6.8% | |
| CBRE Links: Profile News Message Board | |
| Charts:- Daily , Weekly | |
| Add CBRE to Watchlist: View: Get CBRE Trend Analysis ➞ | |
 | ARE Alexandria Real Estate Equities, Inc. |
| Sector: Financials | |
| SubSector: REIT - Office | |
| MarketCap: 16793.6 Millions | |
| Recent Price: 118.17 Smart Investing & Trading Score: 20 | |
| Day Percent Change: 1.18% Day Change: 1.38 | |
| Week Change: 1.66% Year-to-date Change: -6.8% | |
| ARE Links: Profile News Message Board | |
| Charts:- Daily , Weekly | |
| Add ARE to Watchlist: View: Get ARE Trend Analysis ➞ | |
 | CMA Comerica Incorporated |
| Sector: Financials | |
| SubSector: Money Center Banks | |
| MarketCap: 4449.49 Millions | |
| Recent Price: 51.87 Smart Investing & Trading Score: 68 | |
| Day Percent Change: 1.29% Day Change: 0.66 | |
| Week Change: -0.38% Year-to-date Change: -7.1% | |
| CMA Links: Profile News Message Board | |
| Charts:- Daily , Weekly | |
| Add CMA to Watchlist: View: Get CMA Trend Analysis ➞ | |
 | CF CF Industries Holdings, Inc. |
| Sector: Materials | |
| SubSector: Agricultural Chemicals | |
| MarketCap: 5581.89 Millions | |
| Recent Price: 73.87 Smart Investing & Trading Score: 0 | |
| Day Percent Change: -5.26% Day Change: -4.10 | |
| Week Change: -7.66% Year-to-date Change: -7.1% | |
| CF Links: Profile News Message Board | |
| Charts:- Daily , Weekly | |
| Add CF to Watchlist: View: Get CF Trend Analysis ➞ | |
 | IT Gartner, Inc. |
| Sector: Technology | |
| SubSector: Information Technology Services | |
| MarketCap: 7767.98 Millions | |
| Recent Price: 419.04 Smart Investing & Trading Score: 10 | |
| Day Percent Change: -0.79% Day Change: -3.35 | |
| Week Change: -6.63% Year-to-date Change: -7.1% | |
| IT Links: Profile News Message Board | |
| Charts:- Daily , Weekly | |
| Add IT to Watchlist: View: Get IT Trend Analysis ➞ | |
 | HPQ HP Inc. |
| Sector: Technology | |
| SubSector: Diversified Computer Systems | |
| MarketCap: 22107.8 Millions | |
| Recent Price: 27.94 Smart Investing & Trading Score: 10 | |
| Day Percent Change: 0.68% Day Change: 0.19 | |
| Week Change: -0.21% Year-to-date Change: -7.2% | |
| HPQ Links: Profile News Message Board | |
| Charts:- Daily , Weekly | |
| Add HPQ to Watchlist: View: Get HPQ Trend Analysis ➞ | |
 | FFIV F5 Networks, Inc. |
| Sector: Technology | |
| SubSector: Business Software & Services | |
| MarketCap: 6675.38 Millions | |
| Recent Price: 166.07 Smart Investing & Trading Score: 0 | |
| Day Percent Change: -0.33% Day Change: -0.55 | |
| Week Change: -8.72% Year-to-date Change: -7.2% | |
| FFIV Links: Profile News Message Board | |
| Charts:- Daily , Weekly | |
| Add FFIV to Watchlist: View: Get FFIV Trend Analysis ➞ | |
| For tabular summary view of above stock list: Summary View ➞ 0 - 25 , 25 - 50 , 50 - 75 , 75 - 100 , 100 - 125 , 125 - 150 , 150 - 175 , 175 - 200 , 200 - 225 , 225 - 250 , 250 - 275 , 275 - 300 , 300 - 325 , 325 - 350 , 350 - 375 , 375 - 400 , 400 - 425 , 425 - 450 , 450 - 475 , 475 - 500 | ||
| Click To Change The Sort Order: By Market Cap or Company Size Performance: Year-to-date, Week and Day | |
| Select Chart Type: | ||
|
Best Stocks Today 12Stocks.com |
© 2024 12Stocks.com Terms & Conditions Privacy Contact Us
All Information Provided Only For Education And Not To Be Used For Investing or Trading. See Terms & Conditions


One More Thing ... Get Best Stocks Delivered Daily!
Never Ever Miss A Move With Our Top Ten Stocks Lists
Find Best Stocks In Any Market - Bull or Bear Market
Take A Peek At Our Top Ten Stocks Lists: Daily, Weekly, Year-to-Date & Top Trends
Find Best Stocks In Any Market - Bull or Bear Market
Take A Peek At Our Top Ten Stocks Lists: Daily, Weekly, Year-to-Date & Top Trends
S&P 500 Stocks With Best Up Trends [0-bearish to 100-bullish]: C.H. Robinson[100], QUALCOMM [100], BorgWarner [100], Kellogg [100], WestRock [100], Ventas [100], AES [100], Xylem [100], Bio-Techne [100], Becton Dickinson[100], Air Products[100]
Best S&P 500 Stocks Year-to-Date:
NVIDIA [73.29%], Constellation [58.62%], NRG [45.32%], Chipotle Mexican[37.39%], DaVita [35.78%], Western Digital[33.13%], Leidos Holdings[31.8%], Micron [31.63%], Progressive [31.23%], Eaton [30.92%], Targa Resources[30.07%] Best S&P 500 Stocks This Week:
Bio-Techne [18.01%], Moderna [16.32%], C.H. Robinson[15.25%], Garmin [15.25%], Amcor [10.03%], AES [9.99%], Leidos Holdings[9.44%], Aptiv [9.24%], Pfizer [9.06%], QUALCOMM [8.72%], WestRock [8.17%] Best S&P 500 Stocks Daily:
Moderna [12.68%], C.H. Robinson[12.26%], Aptiv [11.53%], QUALCOMM [9.74%], Monolithic Power[9.24%], BorgWarner [8.40%], Kellogg [7.55%], WestRock [6.70%], Estee Lauder[5.94%], Corteva [5.69%], Zoetis [5.51%]