
 Login Sign Up


| |||||
 |  | ||||

| 12Stocks.com Market Intelligence |
Best S&P 500 Stocks
|
On this page, you will find the most comprehensive analysis of S&P 500 stocks and ETFs - from latest trends to performances to charts ➞. First, here are the year-to-date (YTD) performances of the most requested S&P 500 stocks at 12Stocks.com (click stock for review):
| NVIDIA 67% | ||
| Merck 20% | ||
| Walmart 15% | ||
| Caterpillar 14% | ||
| Amazon.com 14% | ||
| JPMorgan Chase 14% | ||
| Google 12% | ||
| Chevron 11% | ||
| Goldman Sachs 9% | ||
| Microsoft 6% | ||
| Johnson & Johnson -6% | ||
| McDonald s -7% | ||
| Starbucks -9% | ||
| Apple -12% | ||
| Gilead -19% | ||
| Intel -30% | ||
| Boeing -36% | ||
| Quick: S&P 500 Stocks Lists: Performances & Trends, S&P 500 Stock Charts
Sort S&P 500 stocks: Daily, Weekly, Year-to-Date, Market Cap & Trends. Filter S&P 500 stocks list by sector: Show all, Tech, Finance, Energy, Staples, Retail, Industrial, Materials, Utilities and HealthCare |
| 12Stocks.com S&P 500 Stocks Performances & Trends Daily Report | |||||||||
|
| 
The overall Smart Investing & Trading Score is 44 (0-bearish to 100-bullish) which puts S&P 500 index in short term neutral trend. The Smart Investing & Trading Score from previous trading session is 58 and hence a deterioration of trend. | ||||||||
Here are the Smart Investing & Trading Scores of the most requested S&P 500 stocks at 12Stocks.com (click stock name for detailed review):
|


| 12Stocks.com: Top Performing S&P 500 Index Stocks | ||||||||||||||||||||||||||||||||||||||||||||||||
 The top performing S&P 500 Index stocks year to date are
Now, more recently, over last week, the top performing S&P 500 Index stocks on the move are


|
||||||||||||||||||||||||||||||||||||||||||||||||
| 12Stocks.com: Investing in S&P 500 Index with Stocks | |
|
The following table helps investors and traders sort through current performance and trends (as measured by Smart Investing & Trading Score) of various
stocks in the S&P 500 Index. Quick View: Move mouse or cursor over stock symbol (ticker) to view short-term technical chart and over stock name to view long term chart. Click on  to add stock symbol to your watchlist and to add stock symbol to your watchlist and  to view watchlist. Click on any ticker or stock name for detailed market intelligence report for that stock. to view watchlist. Click on any ticker or stock name for detailed market intelligence report for that stock. |
12Stocks.com Performance of Stocks in S&P 500 Index
| Ticker | Stock Name | Watchlist | Category | Recent Price | Smart Investing & Trading Score | Change % | YTD Change% |
| ESS | Essex Property |   | Financials | 247.21 | 100 | -0.21% | -0.29% |
| ADI | Analog Devices | | Technology | 197.94 | 100 | 0.73% | -0.31% |
| FRT | Federal Realty | | Financials | 102.57 | 100 | -0.99% | -0.47% |
| EIX | Edison | | Utilities | 71.13 | 78 | 0.44% | -0.50% |
| MS | Morgan Stanley | | Financials | 92.56 | 68 | -1.37% | -0.74% |
| UDR | UDR | | Financials | 37.97 | 100 | 0.21% | -0.84% |
| UNP | Union Pacific | | Transports | 243.55 | 70 | 4.99% | -0.84% |
| EL | Estee Lauder | | Consumer Staples | 144.99 | 58 | -1.61% | -0.86% |
| ROP | Roper Technologies | | Industrials | 540.41 | 62 | 0.45% | -0.87% |
| CE | Celanese | | Materials | 153.89 | 44 | -0.99% | -0.95% |
| IT | Gartner | | Technology | 446.31 | 25 | -1.05% | -1.06% |
| CPT | Camden Property | | Financials | 98.21 | 81 | -0.66% | -1.09% |
| NTRS | Northern Trust | | Financials | 83.44 | 54 | -1.02% | -1.11% |
| T | AT&T | | Technology | 16.58 | 44 | -1.37% | -1.19% |
| BKNG | Booking Holdings | | Services & Goods | 3502.48 | 48 | -0.43% | -1.26% |
| NWSA | News | | Services & Goods | 24.21 | 10 | -1.43% | -1.38% |
| ALLE | Allegion | | Services & Goods | 124.87 | 44 | -1.32% | -1.44% |
| DE | Deere & | | Industrials | 394.06 | 23 | -0.14% | -1.45% |
| LHX | L3Harris Technologies | | Technology | 207.36 | 53 | -0.17% | -1.55% |
| ZBH | Zimmer Biomet | | Health Care | 119.75 | 30 | -1.17% | -1.60% |
| WEC | WEC | | Utilities | 82.81 | 100 | 0.22% | -1.62% |
| NDSN | Nordson | | Industrials | 259.66 | 44 | -0.15% | -1.70% |
| DGX | Quest Diagnostics | | Health Care | 135.42 | 93 | -1.55% | -1.78% |
| CSX | CSX | | Transports | 34.03 | 10 | 1.07% | -1.85% |
| GPN | Global Payments | | Services & Goods | 124.63 | 25 | -2.23% | -1.87% |
| For chart view version of above stock list: Chart View ➞ 0 - 25 , 25 - 50 , 50 - 75 , 75 - 100 , 100 - 125 , 125 - 150 , 150 - 175 , 175 - 200 , 200 - 225 , 225 - 250 , 250 - 275 , 275 - 300 , 300 - 325 , 325 - 350 , 350 - 375 , 375 - 400 , 400 - 425 , 425 - 450 , 450 - 475 , 475 - 500 | ||
 | Click To Change The Sort Order: By Market Cap or Company Size Performance: Year-to-date, Week and Day |  |
|
Get the most comprehensive stock market coverage daily at 12Stocks.com ➞ Best Stocks Today ➞ Best Stocks Weekly ➞ Best Stocks Year-to-Date ➞ Best Stocks Trends ➞  Best Stocks Today 12Stocks.com Best Nasdaq Stocks ➞ Best S&P 500 Stocks ➞ Best Tech Stocks ➞ Best Biotech Stocks ➞ |
| Detailed Overview of S&P 500 Stocks |
| S&P 500 Technical Overview, Leaders & Laggards, Top S&P 500 ETF Funds & Detailed S&P 500 Stocks List, Charts, Trends & More |
| S&P 500: Technical Analysis, Trends & YTD Performance | |
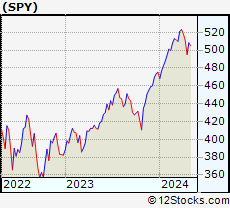
| S&P 500 index as represented by
SPY, an exchange-traded fund [ETF], holds basket of five hundred (mostly largecap) stocks from across all major sectors of the US stock market. The S&P 500 index (contains stocks like Apple and Exxon) is up by 5.93% and is currently outperforming the overall market by 0.77% year-to-date. Below is a quick view of technical charts and trends: | |
 SPY Weekly Chart |
|
| Long Term Trend: Good | |
| Medium Term Trend: Not Good | |
 SPY Daily Chart |
|
| Short Term Trend: Very Good | |
| Overall Trend Score: 44 | |
| YTD Performance: 5.93% | |
| **Trend Scores & Views Are Only For Educational Purposes And Not For Investing | |
| 12Stocks.com: Investing in S&P 500 Index using Exchange Traded Funds | |
|
The following table shows list of key exchange traded funds (ETF) that
help investors track S&P 500 index. The following list also includes leveraged ETF funds that track twice or thrice the daily returns of S&P 500 indices. Short or inverse ETF funds move in the opposite direction to the index they track and are useful during market pullbacks or during bear markets. Quick View: Move mouse or cursor over ETF symbol (ticker) to view short-term technical chart and over ETF name to view long term chart. Click on ticker or stock name for detailed view. Click on to add stock symbol to your watchlist and to view watchlist. |
12Stocks.com List of ETFs that track S&P 500 Index
| Ticker | ETF Name | Watchlist | Recent Price | Smart Investing & Trading Score | Change % | Week % | Year-to-date % |
| SPY | SPDR S&P 500 ETF | | 503.49 | 44 | -0.38 | 1.68 | 5.93% |
| IVV | iShares Core S&P 500 ETF | | 505.82 | 56 | -0.42 | 1.67 | 5.9% |
| VOO | Vanguard 500 ETF | | 462.58 | 56 | -0.41 | 1.64 | 5.9% |
| OEF | iShares S&P 100 | | 238.34 | 44 | -0.60 | 1.56 | 6.69% |
| SSO | ProShares Ultra S&P500 | | 71.32 | 51 | -0.88 | 3.2 | 9.61% |
| UPRO | ProShares UltraPro S&P500 | | 62.03 | 51 | -1.35 | 4.85 | 13.32% |
| SPXL | Direxion Daily S&P500 Bull 3X ETF | | 117.84 | 56 | -1.27 | 4.7 | 13.32% |
| SH | ProShares Short S&P500 | | 12.39 | 57 | 0.49 | -1.59 | -4.62% |
| SDS | ProShares UltraShort S&P500 | | 27.04 | 49 | 0.90 | -3.08 | -9.63% |
| SPXU | ProShares UltraPro Short S&P500 | | 36.52 | 49 | 1.33 | -4.72 | -15.07% |
| SPXS | Direxion Daily S&P 500 Bear 3X ETF | | 9.88 | 32 | 1.33 | -4.63 | -14.46% |
| 12Stocks.com: Charts, Trends, Fundamental Data and Performances of S&P 500 Stocks | |
|
We now take in-depth look at all S&P 500 stocks including charts, multi-period performances and overall trends (as measured by Smart Investing & Trading Score). One can sort S&P 500 stocks (click link to choose) by Daily, Weekly and by Year-to-Date performances. Also, one can sort by size of the company or by market capitalization. |
| Select Your Default Chart Type: | |||||
| |||||
| Click on stock symbol or name for detailed view. Click on to add stock symbol to your watchlist and to view watchlist. Quick View: Move mouse or cursor over "Daily" to quickly view daily technical stock chart and over "Weekly" to view weekly technical stock chart. | |||||

 | ESS Essex Property Trust, Inc. |
| Sector: Financials | |
| SubSector: REIT - Residential | |
| MarketCap: 13725.5 Millions | |
| Recent Price: 247.21 Smart Investing & Trading Score: 100 | |
| Day Percent Change: -0.21% Day Change: -0.53 | |
| Week Change: 5.12% Year-to-date Change: -0.3% | |
| ESS Links: Profile News Message Board | |
| Charts:- Daily , Weekly | |
| Add ESS to Watchlist: View: Get ESS Trend Analysis ➞ | |
 | ADI Analog Devices, Inc. |
| Sector: Technology | |
| SubSector: Semiconductor - Integrated Circuits | |
| MarketCap: 32859 Millions | |
| Recent Price: 197.94 Smart Investing & Trading Score: 100 | |
| Day Percent Change: 0.73% Day Change: 1.44 | |
| Week Change: 7.95% Year-to-date Change: -0.3% | |
| ADI Links: Profile News Message Board | |
| Charts:- Daily , Weekly | |
| Add ADI to Watchlist: View: Get ADI Trend Analysis ➞ | |
 | FRT Federal Realty Investment Trust |
| Sector: Financials | |
| SubSector: REIT - Retail | |
| MarketCap: 5878.64 Millions | |
| Recent Price: 102.57 Smart Investing & Trading Score: 100 | |
| Day Percent Change: -0.99% Day Change: -1.03 | |
| Week Change: 2.81% Year-to-date Change: -0.5% | |
| FRT Links: Profile News Message Board | |
| Charts:- Daily , Weekly | |
| Add FRT to Watchlist: View: Get FRT Trend Analysis ➞ | |
 | EIX Edison International |
| Sector: Utilities | |
| SubSector: Electric Utilities | |
| MarketCap: 19358.1 Millions | |
| Recent Price: 71.13 Smart Investing & Trading Score: 78 | |
| Day Percent Change: 0.44% Day Change: 0.31 | |
| Week Change: 1.72% Year-to-date Change: -0.5% | |
| EIX Links: Profile News Message Board | |
| Charts:- Daily , Weekly | |
| Add EIX to Watchlist: View: Get EIX Trend Analysis ➞ | |
 | MS Morgan Stanley |
| Sector: Financials | |
| SubSector: Investment Brokerage - National | |
| MarketCap: 55876.7 Millions | |
| Recent Price: 92.56 Smart Investing & Trading Score: 68 | |
| Day Percent Change: -1.37% Day Change: -1.29 | |
| Week Change: 2.1% Year-to-date Change: -0.7% | |
| MS Links: Profile News Message Board | |
| Charts:- Daily , Weekly | |
| Add MS to Watchlist: View: Get MS Trend Analysis ➞ | |
 | UDR UDR, Inc. |
| Sector: Financials | |
| SubSector: REIT - Residential | |
| MarketCap: 10180.1 Millions | |
| Recent Price: 37.97 Smart Investing & Trading Score: 100 | |
| Day Percent Change: 0.21% Day Change: 0.08 | |
| Week Change: 4.31% Year-to-date Change: -0.8% | |
| UDR Links: Profile News Message Board | |
| Charts:- Daily , Weekly | |
| Add UDR to Watchlist: View: Get UDR Trend Analysis ➞ | |
 | UNP Union Pacific Corporation |
| Sector: Transports | |
| SubSector: Railroads | |
| MarketCap: 87198.1 Millions | |
| Recent Price: 243.55 Smart Investing & Trading Score: 70 | |
| Day Percent Change: 4.99% Day Change: 11.57 | |
| Week Change: 4.94% Year-to-date Change: -0.8% | |
| UNP Links: Profile News Message Board | |
| Charts:- Daily , Weekly | |
| Add UNP to Watchlist: View: Get UNP Trend Analysis ➞ | |
 | EL The Estee Lauder Companies Inc. |
| Sector: Consumer Staples | |
| SubSector: Personal Products | |
| MarketCap: 59521.1 Millions | |
| Recent Price: 144.99 Smart Investing & Trading Score: 58 | |
| Day Percent Change: -1.61% Day Change: -2.37 | |
| Week Change: 0.4% Year-to-date Change: -0.9% | |
| EL Links: Profile News Message Board | |
| Charts:- Daily , Weekly | |
| Add EL to Watchlist: View: Get EL Trend Analysis ➞ | |
 | ROP Roper Technologies, Inc. |
| Sector: Industrials | |
| SubSector: Diversified Machinery | |
| MarketCap: 33366.2 Millions | |
| Recent Price: 540.41 Smart Investing & Trading Score: 62 | |
| Day Percent Change: 0.45% Day Change: 2.40 | |
| Week Change: 1.13% Year-to-date Change: -0.9% | |
| ROP Links: Profile News Message Board | |
| Charts:- Daily , Weekly | |
| Add ROP to Watchlist: View: Get ROP Trend Analysis ➞ | |
 | CE Celanese Corporation |
| Sector: Materials | |
| SubSector: Chemicals - Major Diversified | |
| MarketCap: 8521.06 Millions | |
| Recent Price: 153.89 Smart Investing & Trading Score: 44 | |
| Day Percent Change: -0.99% Day Change: -1.54 | |
| Week Change: -0.36% Year-to-date Change: -1.0% | |
| CE Links: Profile News Message Board | |
| Charts:- Daily , Weekly | |
| Add CE to Watchlist: View: Get CE Trend Analysis ➞ | |
 | IT Gartner, Inc. |
| Sector: Technology | |
| SubSector: Information Technology Services | |
| MarketCap: 7767.98 Millions | |
| Recent Price: 446.31 Smart Investing & Trading Score: 25 | |
| Day Percent Change: -1.05% Day Change: -4.75 | |
| Week Change: 1.35% Year-to-date Change: -1.1% | |
| IT Links: Profile News Message Board | |
| Charts:- Daily , Weekly | |
| Add IT to Watchlist: View: Get IT Trend Analysis ➞ | |
 | CPT Camden Property Trust |
| Sector: Financials | |
| SubSector: REIT - Residential | |
| MarketCap: 7535.21 Millions | |
| Recent Price: 98.21 Smart Investing & Trading Score: 81 | |
| Day Percent Change: -0.66% Day Change: -0.65 | |
| Week Change: 1.99% Year-to-date Change: -1.1% | |
| CPT Links: Profile News Message Board | |
| Charts:- Daily , Weekly | |
| Add CPT to Watchlist: View: Get CPT Trend Analysis ➞ | |
 | NTRS Northern Trust Corporation |
| Sector: Financials | |
| SubSector: Asset Management | |
| MarketCap: 15316.8 Millions | |
| Recent Price: 83.44 Smart Investing & Trading Score: 54 | |
| Day Percent Change: -1.02% Day Change: -0.86 | |
| Week Change: 2.44% Year-to-date Change: -1.1% | |
| NTRS Links: Profile News Message Board | |
| Charts:- Daily , Weekly | |
| Add NTRS to Watchlist: View: Get NTRS Trend Analysis ➞ | |
 | T AT&T Inc. |
| Sector: Technology | |
| SubSector: Telecom Services - Domestic | |
| MarketCap: 224847 Millions | |
| Recent Price: 16.58 Smart Investing & Trading Score: 44 | |
| Day Percent Change: -1.37% Day Change: -0.23 | |
| Week Change: 0.42% Year-to-date Change: -1.2% | |
| T Links: Profile News Message Board | |
| Charts:- Daily , Weekly | |
| Add T to Watchlist: View: Get T Trend Analysis ➞ | |
 | BKNG Booking Holdings Inc. |
| Sector: Services & Goods | |
| SubSector: Business Services | |
| MarketCap: 54467.9 Millions | |
| Recent Price: 3502.48 Smart Investing & Trading Score: 48 | |
| Day Percent Change: -0.43% Day Change: -15.04 | |
| Week Change: 2.57% Year-to-date Change: -1.3% | |
| BKNG Links: Profile News Message Board | |
| Charts:- Daily , Weekly | |
| Add BKNG to Watchlist: View: Get BKNG Trend Analysis ➞ | |
 | NWSA News Corporation |
| Sector: Services & Goods | |
| SubSector: Broadcasting - TV | |
| MarketCap: 5857.53 Millions | |
| Recent Price: 24.21 Smart Investing & Trading Score: 10 | |
| Day Percent Change: -1.43% Day Change: -0.35 | |
| Week Change: 0.79% Year-to-date Change: -1.4% | |
| NWSA Links: Profile News Message Board | |
| Charts:- Daily , Weekly | |
| Add NWSA to Watchlist: View: Get NWSA Trend Analysis ➞ | |
 | ALLE Allegion plc |
| Sector: Services & Goods | |
| SubSector: Security & Protection Services | |
| MarketCap: 8515.93 Millions | |
| Recent Price: 124.87 Smart Investing & Trading Score: 44 | |
| Day Percent Change: -1.32% Day Change: -1.67 | |
| Week Change: -0.27% Year-to-date Change: -1.4% | |
| ALLE Links: Profile News Message Board | |
| Charts:- Daily , Weekly | |
| Add ALLE to Watchlist: View: Get ALLE Trend Analysis ➞ | |
 | DE Deere & Company |
| Sector: Industrials | |
| SubSector: Farm & Construction Machinery | |
| MarketCap: 39168.7 Millions | |
| Recent Price: 394.06 Smart Investing & Trading Score: 23 | |
| Day Percent Change: -0.14% Day Change: -0.56 | |
| Week Change: -1.56% Year-to-date Change: -1.5% | |
| DE Links: Profile News Message Board | |
| Charts:- Daily , Weekly | |
| Add DE to Watchlist: View: Get DE Trend Analysis ➞ | |
 | LHX L3Harris Technologies, Inc. |
| Sector: Technology | |
| SubSector: Communication Equipment | |
| MarketCap: 37906.1 Millions | |
| Recent Price: 207.36 Smart Investing & Trading Score: 53 | |
| Day Percent Change: -0.17% Day Change: -0.35 | |
| Week Change: 0.93% Year-to-date Change: -1.6% | |
| LHX Links: Profile News Message Board | |
| Charts:- Daily , Weekly | |
| Add LHX to Watchlist: View: Get LHX Trend Analysis ➞ | |
 | ZBH Zimmer Biomet Holdings, Inc. |
| Sector: Health Care | |
| SubSector: Medical Appliances & Equipment | |
| MarketCap: 19339.4 Millions | |
| Recent Price: 119.75 Smart Investing & Trading Score: 30 | |
| Day Percent Change: -1.17% Day Change: -1.42 | |
| Week Change: 0.27% Year-to-date Change: -1.6% | |
| ZBH Links: Profile News Message Board | |
| Charts:- Daily , Weekly | |
| Add ZBH to Watchlist: View: Get ZBH Trend Analysis ➞ | |
 | WEC WEC Energy Group, Inc. |
| Sector: Utilities | |
| SubSector: Electric Utilities | |
| MarketCap: 24852 Millions | |
| Recent Price: 82.81 Smart Investing & Trading Score: 100 | |
| Day Percent Change: 0.22% Day Change: 0.18 | |
| Week Change: 1.53% Year-to-date Change: -1.6% | |
| WEC Links: Profile News Message Board | |
| Charts:- Daily , Weekly | |
| Add WEC to Watchlist: View: Get WEC Trend Analysis ➞ | |
 | NDSN Nordson Corporation |
| Sector: Industrials | |
| SubSector: Diversified Machinery | |
| MarketCap: 7117.56 Millions | |
| Recent Price: 259.66 Smart Investing & Trading Score: 44 | |
| Day Percent Change: -0.15% Day Change: -0.40 | |
| Week Change: 0.03% Year-to-date Change: -1.7% | |
| NDSN Links: Profile News Message Board | |
| Charts:- Daily , Weekly | |
| Add NDSN to Watchlist: View: Get NDSN Trend Analysis ➞ | |
 | DGX Quest Diagnostics Incorporated |
| Sector: Health Care | |
| SubSector: Medical Laboratories & Research | |
| MarketCap: 11076.1 Millions | |
| Recent Price: 135.42 Smart Investing & Trading Score: 93 | |
| Day Percent Change: -1.55% Day Change: -2.13 | |
| Week Change: 5.43% Year-to-date Change: -1.8% | |
| DGX Links: Profile News Message Board | |
| Charts:- Daily , Weekly | |
| Add DGX to Watchlist: View: Get DGX Trend Analysis ➞ | |
 | CSX CSX Corporation |
| Sector: Transports | |
| SubSector: Railroads | |
| MarketCap: 42131.2 Millions | |
| Recent Price: 34.03 Smart Investing & Trading Score: 10 | |
| Day Percent Change: 1.07% Day Change: 0.36 | |
| Week Change: -0.9% Year-to-date Change: -1.9% | |
| CSX Links: Profile News Message Board | |
| Charts:- Daily , Weekly | |
| Add CSX to Watchlist: View: Get CSX Trend Analysis ➞ | |
 | GPN Global Payments Inc. |
| Sector: Services & Goods | |
| SubSector: Business Services | |
| MarketCap: 39068.8 Millions | |
| Recent Price: 124.63 Smart Investing & Trading Score: 25 | |
| Day Percent Change: -2.23% Day Change: -2.84 | |
| Week Change: 2.07% Year-to-date Change: -1.9% | |
| GPN Links: Profile News Message Board | |
| Charts:- Daily , Weekly | |
| Add GPN to Watchlist: View: Get GPN Trend Analysis ➞ | |
| For tabular summary view of above stock list: Summary View ➞ 0 - 25 , 25 - 50 , 50 - 75 , 75 - 100 , 100 - 125 , 125 - 150 , 150 - 175 , 175 - 200 , 200 - 225 , 225 - 250 , 250 - 275 , 275 - 300 , 300 - 325 , 325 - 350 , 350 - 375 , 375 - 400 , 400 - 425 , 425 - 450 , 450 - 475 , 475 - 500 | ||
| Click To Change The Sort Order: By Market Cap or Company Size Performance: Year-to-date, Week and Day | |
| Select Chart Type: | ||
|
Best Stocks Today 12Stocks.com |
© 2024 12Stocks.com Terms & Conditions Privacy Contact Us
All Information Provided Only For Education And Not To Be Used For Investing or Trading. See Terms & Conditions


One More Thing ... Get Best Stocks Delivered Daily!
Never Ever Miss A Move With Our Top Ten Stocks Lists
Find Best Stocks In Any Market - Bull or Bear Market
Take A Peek At Our Top Ten Stocks Lists: Daily, Weekly, Year-to-Date & Top Trends
Find Best Stocks In Any Market - Bull or Bear Market
Take A Peek At Our Top Ten Stocks Lists: Daily, Weekly, Year-to-Date & Top Trends
S&P 500 Stocks With Best Up Trends [0-bearish to 100-bullish]: Newmont [100], Teradyne [100], Chipotle Mexican[100], Dover [100], Merck [100], Northrop Grumman[100], Tractor Supply[100], EQT [100], Microchip [100], Hess [100], Altria [100]
Best S&P 500 Stocks Year-to-Date:
NVIDIA [66.86%], Constellation [60.54%], NRG [40.93%], Chipotle Mexican[36.07%], Targa Resources[35.47%], Marathon [34.48%], Diamondback [33.54%], Western Digital[32.59%], Progressive [31.89%], Eaton [31.68%], Micron [30.75%] Best S&P 500 Stocks This Week:
Hasbro [17.55%], Tesla [15.73%], Tyler Technologies[13.57%], Teradyne [13.48%], Wabtec [13.19%], Globe Life[13.19%], Microchip [12.89%], Monolithic Power[11.63%], Newmont [11.25%], NXP Semiconductors[10.67%], EQT [10.26%] Best S&P 500 Stocks Daily:
Newmont [12.46%], Tyler Technologies[9.32%], Teradyne [8.15%], Carrier Global[7.19%], Chipotle Mexican[6.33%], United Rentals[5.45%], Zebra Technologies[5.40%], Union Pacific[4.99%], Tesla [4.97%], Keurig Dr[4.73%], Dover [4.47%]