
 Login Sign Up


| |||||
 |  | ||||

| 12Stocks.com Market Intelligence |
Best S&P 500 Stocks
|
On this page, you will find the most comprehensive analysis of S&P 500 stocks and ETFs - from latest trends to performances to charts ➞. First, here are the year-to-date (YTD) performances of the most requested S&P 500 stocks at 12Stocks.com (click stock for review):
| NVIDIA 77% | ||
| Amazon.com 22% | ||
| Google 18% | ||
| Merck 17% | ||
| Goldman Sachs 14% | ||
| Caterpillar 13% | ||
| Walmart 13% | ||
| JPMorgan Chase 12% | ||
| Microsoft 8% | ||
| Chevron 5% | ||
| Apple -4% | ||
| Johnson & Johnson -5% | ||
| McDonald s -9% | ||
| Gilead -20% | ||
| Starbucks -23% | ||
| Boeing -31% | ||
| Intel -39% | ||
| Quick: S&P 500 Stocks Lists: Performances & Trends, S&P 500 Stock Charts
Sort S&P 500 stocks: Daily, Weekly, Year-to-Date, Market Cap & Trends. Filter S&P 500 stocks list by sector: Show all, Tech, Finance, Energy, Staples, Retail, Industrial, Materials, Utilities and HealthCare |
| 12Stocks.com S&P 500 Stocks Performances & Trends Daily Report | |||||||||
|
| 
The overall Smart Investing & Trading Score is 60 (0-bearish to 100-bullish) which puts S&P 500 index in short term neutral to bullish trend. The Smart Investing & Trading Score from previous trading session is 30 and hence an improvement of trend. | ||||||||
Here are the Smart Investing & Trading Scores of the most requested S&P 500 stocks at 12Stocks.com (click stock name for detailed review):
|


| 12Stocks.com: Top Performing S&P 500 Index Stocks | ||||||||||||||||||||||||||||||||||||||||||||||||
 The top performing S&P 500 Index stocks year to date are
Now, more recently, over last week, the top performing S&P 500 Index stocks on the move are


|
||||||||||||||||||||||||||||||||||||||||||||||||
| 12Stocks.com: Investing in S&P 500 Index with Stocks | |
|
The following table helps investors and traders sort through current performance and trends (as measured by Smart Investing & Trading Score) of various
stocks in the S&P 500 Index. Quick View: Move mouse or cursor over stock symbol (ticker) to view short-term technical chart and over stock name to view long term chart. Click on  to add stock symbol to your watchlist and to add stock symbol to your watchlist and  to view watchlist. Click on any ticker or stock name for detailed market intelligence report for that stock. to view watchlist. Click on any ticker or stock name for detailed market intelligence report for that stock. |
12Stocks.com Performance of Stocks in S&P 500 Index
| Ticker | Stock Name | Watchlist | Category | Recent Price | Smart Investing & Trading Score | Change % | YTD Change% |
| DD | DuPont de |   | Materials | 77.52 | 100 | -0.30% | 0.77% |
| HAL | Halliburton | | Energy | 36.41 | 36 | -0.79% | 0.72% |
| ADI | Analog Devices | | Technology | 199.79 | 83 | 1.68% | 0.62% |
| DG | Dollar General | | Services & Goods | 136.75 | 27 | -0.29% | 0.59% |
| LHX | L3Harris Technologies | | Technology | 211.85 | 50 | 0.24% | 0.59% |
| MS | Morgan Stanley | | Financials | 93.77 | 93 | 1.21% | 0.56% |
| EIX | Edison | | Utilities | 71.84 | 95 | -0.17% | 0.50% |
| AMD | Advanced Micro | | Technology | 147.91 | 17 | 1.20% | 0.34% |
| AAL | American Airlines | | Transports | 13.79 | 37 | -0.54% | 0.33% |
| INTU | Intuit | | Technology | 626.46 | 57 | 2.02% | 0.23% |
| SHW | Sherwin-Williams | | Materials | 312.13 | 39 | 2.52% | 0.07% |
| T | AT&T | | Technology | 16.79 | 45 | -0.18% | 0.06% |
| CNC | Centene | | Health Care | 74.23 | 57 | -0.13% | 0.03% |
| NDSN | Nordson | | Industrials | 264.25 | 60 | 0.55% | 0.03% |
| PAYX | Paychex | | Services & Goods | 119.14 | 25 | 0.58% | 0.03% |
| NTRS | Northern Trust | | Financials | 84.30 | 76 | 0.96% | -0.09% |
| TEL | TE Connectivity | | Technology | 140.35 | 17 | 0.24% | -0.11% |
| BG | Bunge | | Consumer Staples | 100.82 | 46 | -0.54% | -0.13% |
| JKHY | Jack Henry | | Technology | 163.15 | 18 | 0.39% | -0.16% |
| NOC | Northrop Grumman | | Industrials | 466.98 | 48 | -1.69% | -0.25% |
| SPG | Simon Property | | Financials | 142.26 | 32 | 0.64% | -0.27% |
| NSC | Norfolk Southern | | Transports | 235.58 | 32 | 0.76% | -0.34% |
| AFL | Aflac | | Financials | 82.21 | 41 | -2.18% | -0.35% |
| UDR | UDR | | Financials | 38.15 | 93 | 1.53% | -0.38% |
| PTC | PTC | | Technology | 174.28 | 10 | 2.16% | -0.39% |
| For chart view version of above stock list: Chart View ➞ 0 - 25 , 25 - 50 , 50 - 75 , 75 - 100 , 100 - 125 , 125 - 150 , 150 - 175 , 175 - 200 , 200 - 225 , 225 - 250 , 250 - 275 , 275 - 300 , 300 - 325 , 325 - 350 , 350 - 375 , 375 - 400 , 400 - 425 , 425 - 450 , 450 - 475 , 475 - 500 | ||
 | Click To Change The Sort Order: By Market Cap or Company Size Performance: Year-to-date, Week and Day |  |
|
Get the most comprehensive stock market coverage daily at 12Stocks.com ➞ Best Stocks Today ➞ Best Stocks Weekly ➞ Best Stocks Year-to-Date ➞ Best Stocks Trends ➞  Best Stocks Today 12Stocks.com Best Nasdaq Stocks ➞ Best S&P 500 Stocks ➞ Best Tech Stocks ➞ Best Biotech Stocks ➞ |
| Detailed Overview of S&P 500 Stocks |
| S&P 500 Technical Overview, Leaders & Laggards, Top S&P 500 ETF Funds & Detailed S&P 500 Stocks List, Charts, Trends & More |
| S&P 500: Technical Analysis, Trends & YTD Performance | |
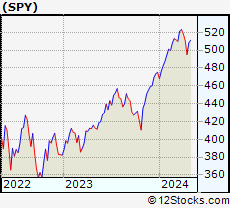
| S&P 500 index as represented by
SPY, an exchange-traded fund [ETF], holds basket of five hundred (mostly largecap) stocks from across all major sectors of the US stock market. The S&P 500 index (contains stocks like Apple and Exxon) is up by 7.05% and is currently outperforming the overall market by 0.56% year-to-date. Below is a quick view of technical charts and trends: | |
 SPY Weekly Chart |
|
| Long Term Trend: Good | |
| Medium Term Trend: Not Good | |
 SPY Daily Chart |
|
| Short Term Trend: Very Good | |
| Overall Trend Score: 60 | |
| YTD Performance: 7.05% | |
| **Trend Scores & Views Are Only For Educational Purposes And Not For Investing | |
| 12Stocks.com: Investing in S&P 500 Index using Exchange Traded Funds | |
|
The following table shows list of key exchange traded funds (ETF) that
help investors track S&P 500 index. The following list also includes leveraged ETF funds that track twice or thrice the daily returns of S&P 500 indices. Short or inverse ETF funds move in the opposite direction to the index they track and are useful during market pullbacks or during bear markets. Quick View: Move mouse or cursor over ETF symbol (ticker) to view short-term technical chart and over ETF name to view long term chart. Click on ticker or stock name for detailed view. Click on to add stock symbol to your watchlist and to view watchlist. |
12Stocks.com List of ETFs that track S&P 500 Index
| Ticker | ETF Name | Watchlist | Recent Price | Smart Investing & Trading Score | Change % | Week % | Year-to-date % |
| SPY | SPDR S&P 500 ETF | | 508.84 | 60 | 0.75 | 0.11 | 7.05% |
| IVV | iShares Core S&P 500 ETF | | 511.36 | 60 | 0.77 | 0.12 | 7.06% |
| VOO | Vanguard 500 ETF | | 467.73 | 60 | 0.76 | 0.11 | 7.08% |
| OEF | iShares S&P 100 | | 242.65 | 60 | 1.01 | 0.45 | 8.62% |
| SSO | ProShares Ultra S&P500 | | 72.86 | 39 | 1.67 | 0.21 | 11.97% |
| UPRO | ProShares UltraPro S&P500 | | 63.93 | 39 | 2.50 | 0.17 | 16.79% |
| SH | ProShares Short S&P500 | | 12.29 | 48 | -0.73 | 0.08 | -5.39% |
| SDS | ProShares UltraShort S&P500 | | 26.52 | 48 | -1.41 | -0.04 | -11.36% |
| SPXU | ProShares UltraPro Short S&P500 | | 35.38 | 30 | -2.43 | -0.34 | -17.72% |
| SPXS | Direxion Daily S&P 500 Bear 3X ETF | | 9.57 | 30 | -2.45 | -0.42 | -17.14% |
| 12Stocks.com: Charts, Trends, Fundamental Data and Performances of S&P 500 Stocks | |
|
We now take in-depth look at all S&P 500 stocks including charts, multi-period performances and overall trends (as measured by Smart Investing & Trading Score). One can sort S&P 500 stocks (click link to choose) by Daily, Weekly and by Year-to-Date performances. Also, one can sort by size of the company or by market capitalization. |
| Select Your Default Chart Type: | |||||
| |||||
| Click on stock symbol or name for detailed view. Click on to add stock symbol to your watchlist and to view watchlist. Quick View: Move mouse or cursor over "Daily" to quickly view daily technical stock chart and over "Weekly" to view weekly technical stock chart. | |||||

 | DD DuPont de Nemours, Inc. |
| Sector: Materials | |
| SubSector: Agricultural Chemicals | |
| MarketCap: 25631.6 Millions | |
| Recent Price: 77.52 Smart Investing & Trading Score: 100 | |
| Day Percent Change: -0.30% Day Change: -0.23 | |
| Week Change: 5.17% Year-to-date Change: 0.8% | |
| DD Links: Profile News Message Board | |
| Charts:- Daily , Weekly | |
| Add DD to Watchlist: View: Get DD Trend Analysis ➞ | |
 | HAL Halliburton Company |
| Sector: Energy | |
| SubSector: Oil & Gas Equipment & Services | |
| MarketCap: 5419.41 Millions | |
| Recent Price: 36.41 Smart Investing & Trading Score: 36 | |
| Day Percent Change: -0.79% Day Change: -0.29 | |
| Week Change: -5.53% Year-to-date Change: 0.7% | |
| HAL Links: Profile News Message Board | |
| Charts:- Daily , Weekly | |
| Add HAL to Watchlist: View: Get HAL Trend Analysis ➞ | |
 | ADI Analog Devices, Inc. |
| Sector: Technology | |
| SubSector: Semiconductor - Integrated Circuits | |
| MarketCap: 32859 Millions | |
| Recent Price: 199.79 Smart Investing & Trading Score: 83 | |
| Day Percent Change: 1.68% Day Change: 3.30 | |
| Week Change: -1.08% Year-to-date Change: 0.6% | |
| ADI Links: Profile News Message Board | |
| Charts:- Daily , Weekly | |
| Add ADI to Watchlist: View: Get ADI Trend Analysis ➞ | |
 | DG Dollar General Corporation |
| Sector: Services & Goods | |
| SubSector: Discount, Variety Stores | |
| MarketCap: 39611.9 Millions | |
| Recent Price: 136.75 Smart Investing & Trading Score: 27 | |
| Day Percent Change: -0.29% Day Change: -0.40 | |
| Week Change: -3.74% Year-to-date Change: 0.6% | |
| DG Links: Profile News Message Board | |
| Charts:- Daily , Weekly | |
| Add DG to Watchlist: View: Get DG Trend Analysis ➞ | |
 | LHX L3Harris Technologies, Inc. |
| Sector: Technology | |
| SubSector: Communication Equipment | |
| MarketCap: 37906.1 Millions | |
| Recent Price: 211.85 Smart Investing & Trading Score: 50 | |
| Day Percent Change: 0.24% Day Change: 0.51 | |
| Week Change: -1.25% Year-to-date Change: 0.6% | |
| LHX Links: Profile News Message Board | |
| Charts:- Daily , Weekly | |
| Add LHX to Watchlist: View: Get LHX Trend Analysis ➞ | |
 | MS Morgan Stanley |
| Sector: Financials | |
| SubSector: Investment Brokerage - National | |
| MarketCap: 55876.7 Millions | |
| Recent Price: 93.77 Smart Investing & Trading Score: 93 | |
| Day Percent Change: 1.21% Day Change: 1.12 | |
| Week Change: 1.01% Year-to-date Change: 0.6% | |
| MS Links: Profile News Message Board | |
| Charts:- Daily , Weekly | |
| Add MS to Watchlist: View: Get MS Trend Analysis ➞ | |
 | EIX Edison International |
| Sector: Utilities | |
| SubSector: Electric Utilities | |
| MarketCap: 19358.1 Millions | |
| Recent Price: 71.84 Smart Investing & Trading Score: 95 | |
| Day Percent Change: -0.17% Day Change: -0.13 | |
| Week Change: 2.43% Year-to-date Change: 0.5% | |
| EIX Links: Profile News Message Board | |
| Charts:- Daily , Weekly | |
| Add EIX to Watchlist: View: Get EIX Trend Analysis ➞ | |
 | AMD Advanced Micro Devices, Inc. |
| Sector: Technology | |
| SubSector: Semiconductor - Broad Line | |
| MarketCap: 54275.1 Millions | |
| Recent Price: 147.91 Smart Investing & Trading Score: 17 | |
| Day Percent Change: 1.20% Day Change: 1.75 | |
| Week Change: -6.03% Year-to-date Change: 0.3% | |
| AMD Links: Profile News Message Board | |
| Charts:- Daily , Weekly | |
| Add AMD to Watchlist: View: Get AMD Trend Analysis ➞ | |
 | AAL American Airlines Group Inc. |
| Sector: Transports | |
| SubSector: Major Airlines | |
| MarketCap: 5346.45 Millions | |
| Recent Price: 13.79 Smart Investing & Trading Score: 37 | |
| Day Percent Change: -0.54% Day Change: -0.07 | |
| Week Change: -0.68% Year-to-date Change: 0.3% | |
| AAL Links: Profile News Message Board | |
| Charts:- Daily , Weekly | |
| Add AAL to Watchlist: View: Get AAL Trend Analysis ➞ | |
 | INTU Intuit Inc. |
| Sector: Technology | |
| SubSector: Application Software | |
| MarketCap: 577035 Millions | |
| Recent Price: 626.46 Smart Investing & Trading Score: 57 | |
| Day Percent Change: 2.02% Day Change: 12.42 | |
| Week Change: -1.59% Year-to-date Change: 0.2% | |
| INTU Links: Profile News Message Board | |
| Charts:- Daily , Weekly | |
| Add INTU to Watchlist: View: Get INTU Trend Analysis ➞ | |
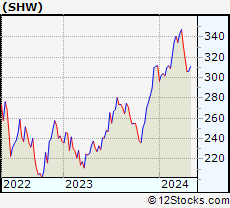 | SHW The Sherwin-Williams Company |
| Sector: Materials | |
| SubSector: Specialty Chemicals | |
| MarketCap: 40832.5 Millions | |
| Recent Price: 312.13 Smart Investing & Trading Score: 39 | |
| Day Percent Change: 2.52% Day Change: 7.67 | |
| Week Change: 1.85% Year-to-date Change: 0.1% | |
| SHW Links: Profile News Message Board | |
| Charts:- Daily , Weekly | |
| Add SHW to Watchlist: View: Get SHW Trend Analysis ➞ | |
 | T AT&T Inc. |
| Sector: Technology | |
| SubSector: Telecom Services - Domestic | |
| MarketCap: 224847 Millions | |
| Recent Price: 16.79 Smart Investing & Trading Score: 45 | |
| Day Percent Change: -0.18% Day Change: -0.03 | |
| Week Change: 0.24% Year-to-date Change: 0.1% | |
| T Links: Profile News Message Board | |
| Charts:- Daily , Weekly | |
| Add T to Watchlist: View: Get T Trend Analysis ➞ | |
 | CNC Centene Corporation |
| Sector: Health Care | |
| SubSector: Health Care Plans | |
| MarketCap: 29075 Millions | |
| Recent Price: 74.23 Smart Investing & Trading Score: 57 | |
| Day Percent Change: -0.13% Day Change: -0.10 | |
| Week Change: 0.31% Year-to-date Change: 0.0% | |
| CNC Links: Profile News Message Board | |
| Charts:- Daily , Weekly | |
| Add CNC to Watchlist: View: Get CNC Trend Analysis ➞ | |
 | NDSN Nordson Corporation |
| Sector: Industrials | |
| SubSector: Diversified Machinery | |
| MarketCap: 7117.56 Millions | |
| Recent Price: 264.25 Smart Investing & Trading Score: 60 | |
| Day Percent Change: 0.55% Day Change: 1.45 | |
| Week Change: 1.48% Year-to-date Change: 0.0% | |
| NDSN Links: Profile News Message Board | |
| Charts:- Daily , Weekly | |
| Add NDSN to Watchlist: View: Get NDSN Trend Analysis ➞ | |
 | PAYX Paychex, Inc. |
| Sector: Services & Goods | |
| SubSector: Staffing & Outsourcing Services | |
| MarketCap: 20928.8 Millions | |
| Recent Price: 119.14 Smart Investing & Trading Score: 25 | |
| Day Percent Change: 0.58% Day Change: 0.69 | |
| Week Change: -0.69% Year-to-date Change: 0.0% | |
| PAYX Links: Profile News Message Board | |
| Charts:- Daily , Weekly | |
| Add PAYX to Watchlist: View: Get PAYX Trend Analysis ➞ | |
 | NTRS Northern Trust Corporation |
| Sector: Financials | |
| SubSector: Asset Management | |
| MarketCap: 15316.8 Millions | |
| Recent Price: 84.30 Smart Investing & Trading Score: 76 | |
| Day Percent Change: 0.96% Day Change: 0.80 | |
| Week Change: 1.1% Year-to-date Change: -0.1% | |
| NTRS Links: Profile News Message Board | |
| Charts:- Daily , Weekly | |
| Add NTRS to Watchlist: View: Get NTRS Trend Analysis ➞ | |
 | TEL TE Connectivity Ltd. |
| Sector: Technology | |
| SubSector: Diversified Electronics | |
| MarketCap: 20044.9 Millions | |
| Recent Price: 140.35 Smart Investing & Trading Score: 17 | |
| Day Percent Change: 0.24% Day Change: 0.34 | |
| Week Change: 0.1% Year-to-date Change: -0.1% | |
| TEL Links: Profile News Message Board | |
| Charts:- Daily , Weekly | |
| Add TEL to Watchlist: View: Get TEL Trend Analysis ➞ | |
 | BG Bunge Limited |
| Sector: Consumer Staples | |
| SubSector: Farm Products | |
| MarketCap: 4975.77 Millions | |
| Recent Price: 100.82 Smart Investing & Trading Score: 46 | |
| Day Percent Change: -0.54% Day Change: -0.55 | |
| Week Change: -1.86% Year-to-date Change: -0.1% | |
| BG Links: Profile News Message Board | |
| Charts:- Daily , Weekly | |
| Add BG to Watchlist: View: Get BG Trend Analysis ➞ | |
 | JKHY Jack Henry & Associates, Inc. |
| Sector: Technology | |
| SubSector: Information Technology Services | |
| MarketCap: 10695.4 Millions | |
| Recent Price: 163.15 Smart Investing & Trading Score: 18 | |
| Day Percent Change: 0.39% Day Change: 0.64 | |
| Week Change: -1.05% Year-to-date Change: -0.2% | |
| JKHY Links: Profile News Message Board | |
| Charts:- Daily , Weekly | |
| Add JKHY to Watchlist: View: Get JKHY Trend Analysis ➞ | |
 | NOC Northrop Grumman Corporation |
| Sector: Industrials | |
| SubSector: Aerospace/Defense - Major Diversified | |
| MarketCap: 52094.9 Millions | |
| Recent Price: 466.98 Smart Investing & Trading Score: 48 | |
| Day Percent Change: -1.69% Day Change: -8.02 | |
| Week Change: -2.8% Year-to-date Change: -0.3% | |
| NOC Links: Profile News Message Board | |
| Charts:- Daily , Weekly | |
| Add NOC to Watchlist: View: Get NOC Trend Analysis ➞ | |
 | SPG Simon Property Group, Inc. |
| Sector: Financials | |
| SubSector: REIT - Retail | |
| MarketCap: 17959.6 Millions | |
| Recent Price: 142.26 Smart Investing & Trading Score: 32 | |
| Day Percent Change: 0.64% Day Change: 0.90 | |
| Week Change: -0.07% Year-to-date Change: -0.3% | |
| SPG Links: Profile News Message Board | |
| Charts:- Daily , Weekly | |
| Add SPG to Watchlist: View: Get SPG Trend Analysis ➞ | |
 | NSC Norfolk Southern Corporation |
| Sector: Transports | |
| SubSector: Railroads | |
| MarketCap: 36165.4 Millions | |
| Recent Price: 235.58 Smart Investing & Trading Score: 32 | |
| Day Percent Change: 0.76% Day Change: 1.78 | |
| Week Change: -1.82% Year-to-date Change: -0.3% | |
| NSC Links: Profile News Message Board | |
| Charts:- Daily , Weekly | |
| Add NSC to Watchlist: View: Get NSC Trend Analysis ➞ | |
 | AFL Aflac Incorporated |
| Sector: Financials | |
| SubSector: Accident & Health Insurance | |
| MarketCap: 22706 Millions | |
| Recent Price: 82.21 Smart Investing & Trading Score: 41 | |
| Day Percent Change: -2.18% Day Change: -1.83 | |
| Week Change: -1.67% Year-to-date Change: -0.4% | |
| AFL Links: Profile News Message Board | |
| Charts:- Daily , Weekly | |
| Add AFL to Watchlist: View: Get AFL Trend Analysis ➞ | |
 | UDR UDR, Inc. |
| Sector: Financials | |
| SubSector: REIT - Residential | |
| MarketCap: 10180.1 Millions | |
| Recent Price: 38.15 Smart Investing & Trading Score: 93 | |
| Day Percent Change: 1.53% Day Change: 0.58 | |
| Week Change: 0.62% Year-to-date Change: -0.4% | |
| UDR Links: Profile News Message Board | |
| Charts:- Daily , Weekly | |
| Add UDR to Watchlist: View: Get UDR Trend Analysis ➞ | |
 | PTC PTC Inc. |
| Sector: Technology | |
| SubSector: Technical & System Software | |
| MarketCap: 6166.7 Millions | |
| Recent Price: 174.28 Smart Investing & Trading Score: 10 | |
| Day Percent Change: 2.16% Day Change: 3.68 | |
| Week Change: -3.71% Year-to-date Change: -0.4% | |
| PTC Links: Profile News Message Board | |
| Charts:- Daily , Weekly | |
| Add PTC to Watchlist: View: Get PTC Trend Analysis ➞ | |
| For tabular summary view of above stock list: Summary View ➞ 0 - 25 , 25 - 50 , 50 - 75 , 75 - 100 , 100 - 125 , 125 - 150 , 150 - 175 , 175 - 200 , 200 - 225 , 225 - 250 , 250 - 275 , 275 - 300 , 300 - 325 , 325 - 350 , 350 - 375 , 375 - 400 , 400 - 425 , 425 - 450 , 450 - 475 , 475 - 500 | ||
| Click To Change The Sort Order: By Market Cap or Company Size Performance: Year-to-date, Week and Day | |
| Select Chart Type: | ||
|
Best Stocks Today 12Stocks.com |
© 2024 12Stocks.com Terms & Conditions Privacy Contact Us
All Information Provided Only For Education And Not To Be Used For Investing or Trading. See Terms & Conditions


One More Thing ... Get Best Stocks Delivered Daily!
Never Ever Miss A Move With Our Top Ten Stocks Lists
Find Best Stocks In Any Market - Bull or Bear Market
Take A Peek At Our Top Ten Stocks Lists: Daily, Weekly, Year-to-Date & Top Trends
Find Best Stocks In Any Market - Bull or Bear Market
Take A Peek At Our Top Ten Stocks Lists: Daily, Weekly, Year-to-Date & Top Trends
S&P 500 Stocks With Best Up Trends [0-bearish to 100-bullish]: Amgen [100], Apple [100], First Solar[100], Camden Property[100], Comerica [100], BorgWarner [100], Zions Ban[100], Teradyne [100], Extra Space[100], Fifth Third[100], Mid-America Apartment[100]
Best S&P 500 Stocks Year-to-Date:
NVIDIA [77.16%], Constellation [66.92%], NRG [48.12%], Chipotle Mexican[37.99%], Western Digital[34.49%], Micron [33.23%], Eaton [33.05%], Leidos Holdings[31.25%], Progressive [29.83%], Garmin [28.43%], Diamondback [28.35%] Best S&P 500 Stocks This Week:
Bio-Techne [19.34%], C.H. Robinson[16.15%], Amgen [16.13%], Garmin [15.09%], Moderna [15.09%], Aptiv [12.36%], Albemarle [10.87%], Amcor [10.59%], BorgWarner [9.69%], WestRock [9.1%], Leidos Holdings[8.98%] Best S&P 500 Stocks Daily:
Amgen [12.62%], Live Nation[8.46%], Enphase [6.67%], Apple [6.55%], Constellation [5.23%], Digital Realty[5.18%], Booking Holdings[5.15%], Motorola Solutions[5.04%], First Solar[4.37%], Builders FirstSource[4.21%], Arista Networks[4.10%]