
 Login Sign Up


| |||||
 |  | ||||

| 12Stocks.com Market Intelligence |
Best S&P 500 Stocks
|
On this page, you will find the most comprehensive analysis of S&P 500 stocks and ETFs - from latest trends to performances to charts ➞. First, here are the year-to-date (YTD) performances of the most requested S&P 500 stocks at 12Stocks.com (click stock for review):
| NVIDIA 67% | ||
| Caterpillar 21% | ||
| Amazon.com 16% | ||
| Merck 15% | ||
| Walmart 13% | ||
| Google 11% | ||
| JPMorgan Chase 8% | ||
| Chevron 8% | ||
| Microsoft 7% | ||
| Goldman Sachs 5% | ||
| Johnson & Johnson -7% | ||
| Starbucks -8% | ||
| McDonald s -8% | ||
| Apple -14% | ||
| Gilead -18% | ||
| Intel -31% | ||
| Boeing -34% | ||
| Quick: S&P 500 Stocks Lists: Performances & Trends, S&P 500 Stock Charts
Sort S&P 500 stocks: Daily, Weekly, Year-to-Date, Market Cap & Trends. Filter S&P 500 stocks list by sector: Show all, Tech, Finance, Energy, Staples, Retail, Industrial, Materials, Utilities and HealthCare |
| 12Stocks.com S&P 500 Stocks Performances & Trends Daily Report | |||||||||
|
| 
The overall Smart Investing & Trading Score is 36 (0-bearish to 100-bullish) which puts S&P 500 index in short term bearish to neutral trend. The Smart Investing & Trading Score from previous trading session is 26 and an improvement of trend continues. | ||||||||
Here are the Smart Investing & Trading Scores of the most requested S&P 500 stocks at 12Stocks.com (click stock name for detailed review):
|


| 12Stocks.com: Top Performing S&P 500 Index Stocks | ||||||||||||||||||||||||||||||||||||||||||||||||
 The top performing S&P 500 Index stocks year to date are
Now, more recently, over last week, the top performing S&P 500 Index stocks on the move are


|
||||||||||||||||||||||||||||||||||||||||||||||||
| 12Stocks.com: Investing in S&P 500 Index with Stocks | |
|
The following table helps investors and traders sort through current performance and trends (as measured by Smart Investing & Trading Score) of various
stocks in the S&P 500 Index. Quick View: Move mouse or cursor over stock symbol (ticker) to view short-term technical chart and over stock name to view long term chart. Click on  to add stock symbol to your watchlist and to add stock symbol to your watchlist and  to view watchlist. Click on any ticker or stock name for detailed market intelligence report for that stock. to view watchlist. Click on any ticker or stock name for detailed market intelligence report for that stock. |
12Stocks.com Performance of Stocks in S&P 500 Index
| Ticker | Stock Name | Watchlist | Category | Recent Price | Smart Investing & Trading Score | Change % | YTD Change% |
| SLB | Schlumberger |   | Energy | 50.08 | 26 | -1.69% | -3.77% |
| TYL | Tyler Technologies | | Technology | 402.23 | 25 | -0.18% | -3.80% |
| TXN | Texas Instruments | | Technology | 163.97 | 46 | 0.18% | -3.81% |
| LYV | Live Nation | | Services & Goods | 90.00 | 26 | 0.40% | -3.85% |
| HST | Host Hotels | | Financials | 18.67 | 10 | 0.43% | -4.11% |
| A | Agilent Technologies | | Health Care | 133.26 | 36 | 0.62% | -4.15% |
| PANW | Palo Alto | | Technology | 282.46 | 50 | 0.47% | -4.21% |
| RF | Regions Financial | | Financials | 18.56 | 33 | -2.32% | -4.23% |
| COO | Cooper | | Health Care | 90.50 | 18 | 0.10% | -4.34% |
| CSCO | Cisco Systems | | Technology | 48.31 | 25 | 0.41% | -4.38% |
| ESS | Essex Property | | Financials | 236.64 | 68 | 1.14% | -4.56% |
| ITW | Illinois Tool | | Industrials | 249.96 | 25 | 0.45% | -4.57% |
| UNH | UnitedHealth | | Health Care | 502.15 | 74 | 1.82% | -4.62% |
| ROST | Ross Stores | | Services & Goods | 131.98 | 10 | 0.14% | -4.63% |
| MCO | Moody s | | Services & Goods | 372.22 | 25 | -0.64% | -4.70% |
| NXPI | NXP Semiconductors | | Technology | 218.68 | 26 | -0.31% | -4.79% |
| MGM | MGM Resorts | | Services & Goods | 42.53 | 18 | 1.18% | -4.80% |
| QRVO | Qorvo | | Technology | 107.18 | 31 | -0.61% | -4.82% |
| BKR | Baker Hughes | | Services & Goods | 32.52 | 61 | 1.01% | -4.84% |
| STT | State Street | | Financials | 73.65 | 50 | 0.84% | -4.92% |
| UDR | UDR | | Financials | 36.39 | 55 | 1.70% | -4.96% |
| EQT | EQT | | Energy | 36.66 | 71 | 1.21% | -5.17% |
| NEM | Newmont | | Materials | 39.15 | 83 | 1.54% | -5.42% |
| BMY | Bristol-Myers | | Health Care | 48.51 | 35 | 0.43% | -5.46% |
| DHI | D.R. Horton | | Industrials | 143.60 | 44 | -1.56% | -5.51% |
| For chart view version of above stock list: Chart View ➞ 0 - 25 , 25 - 50 , 50 - 75 , 75 - 100 , 100 - 125 , 125 - 150 , 150 - 175 , 175 - 200 , 200 - 225 , 225 - 250 , 250 - 275 , 275 - 300 , 300 - 325 , 325 - 350 , 350 - 375 , 375 - 400 , 400 - 425 , 425 - 450 , 450 - 475 , 475 - 500 | ||
 | Click To Change The Sort Order: By Market Cap or Company Size Performance: Year-to-date, Week and Day |  |
|
Get the most comprehensive stock market coverage daily at 12Stocks.com ➞ Best Stocks Today ➞ Best Stocks Weekly ➞ Best Stocks Year-to-Date ➞ Best Stocks Trends ➞  Best Stocks Today 12Stocks.com Best Nasdaq Stocks ➞ Best S&P 500 Stocks ➞ Best Tech Stocks ➞ Best Biotech Stocks ➞ |
| Detailed Overview of S&P 500 Stocks |
| S&P 500 Technical Overview, Leaders & Laggards, Top S&P 500 ETF Funds & Detailed S&P 500 Stocks List, Charts, Trends & More |
| S&P 500: Technical Analysis, Trends & YTD Performance | |
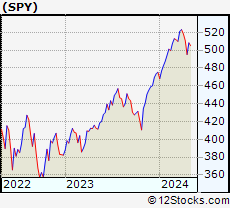
| S&P 500 index as represented by
SPY, an exchange-traded fund [ETF], holds basket of five hundred (mostly largecap) stocks from across all major sectors of the US stock market. The S&P 500 index (contains stocks like Apple and Exxon) is up by 4.95% and is currently outperforming the overall market by 0.87% year-to-date. Below is a quick view of technical charts and trends: | |
 SPY Weekly Chart |
|
| Long Term Trend: Good | |
| Medium Term Trend: Not Good | |
 SPY Daily Chart |
|
| Short Term Trend: Deteriorating | |
| Overall Trend Score: 36 | |
| YTD Performance: 4.95% | |
| **Trend Scores & Views Are Only For Educational Purposes And Not For Investing | |
| 12Stocks.com: Investing in S&P 500 Index using Exchange Traded Funds | |
|
The following table shows list of key exchange traded funds (ETF) that
help investors track S&P 500 index. The following list also includes leveraged ETF funds that track twice or thrice the daily returns of S&P 500 indices. Short or inverse ETF funds move in the opposite direction to the index they track and are useful during market pullbacks or during bear markets. Quick View: Move mouse or cursor over ETF symbol (ticker) to view short-term technical chart and over ETF name to view long term chart. Click on ticker or stock name for detailed view. Click on to add stock symbol to your watchlist and to view watchlist. |
12Stocks.com List of ETFs that track S&P 500 Index
| Ticker | ETF Name | Watchlist | Recent Price | Smart Investing & Trading Score | Change % | Week % | Year-to-date % |
| SPY | SPDR S&P 500 ETF | | 498.82 | 36 | -0.14 | -2.35 | 4.95% |
| OEF | iShares S&P 100 | | 236.60 | 36 | -0.43 | -2.69 | 5.91% |
| SSO | ProShares Ultra S&P500 | | 70.13 | 36 | -0.28 | -4.79 | 7.78% |
| UPRO | ProShares UltraPro S&P500 | | 60.52 | 36 | -0.43 | -7.18 | 10.56% |
| SH | ProShares Short S&P500 | | 12.50 | 62 | 0.24 | 2.54 | -3.77% |
| SDS | ProShares UltraShort S&P500 | | 27.50 | 69 | 0.33 | 5.08 | -8.09% |
| SPXU | ProShares UltraPro Short S&P500 | | 37.53 | 69 | 0.54 | 7.66 | -12.72% |
| 12Stocks.com: Charts, Trends, Fundamental Data and Performances of S&P 500 Stocks | |
|
We now take in-depth look at all S&P 500 stocks including charts, multi-period performances and overall trends (as measured by Smart Investing & Trading Score). One can sort S&P 500 stocks (click link to choose) by Daily, Weekly and by Year-to-Date performances. Also, one can sort by size of the company or by market capitalization. |
| Select Your Default Chart Type: | |||||
| |||||
| Click on stock symbol or name for detailed view. Click on to add stock symbol to your watchlist and to view watchlist. Quick View: Move mouse or cursor over "Daily" to quickly view daily technical stock chart and over "Weekly" to view weekly technical stock chart. | |||||

 | SLB Schlumberger Limited |
| Sector: Energy | |
| SubSector: Oil & Gas Equipment & Services | |
| MarketCap: 23892 Millions | |
| Recent Price: 50.08 Smart Investing & Trading Score: 26 | |
| Day Percent Change: -1.69% Day Change: -0.86 | |
| Week Change: -3.69% Year-to-date Change: -3.8% | |
| SLB Links: Profile News Message Board | |
| Charts:- Daily , Weekly | |
| Add SLB to Watchlist: View: Get SLB Trend Analysis ➞ | |
 | TYL Tyler Technologies, Inc. |
| Sector: Technology | |
| SubSector: Technical & System Software | |
| MarketCap: 10785 Millions | |
| Recent Price: 402.23 Smart Investing & Trading Score: 25 | |
| Day Percent Change: -0.18% Day Change: -0.72 | |
| Week Change: -2.69% Year-to-date Change: -3.8% | |
| TYL Links: Profile News Message Board | |
| Charts:- Daily , Weekly | |
| Add TYL to Watchlist: View: Get TYL Trend Analysis ➞ | |
 | TXN Texas Instruments Incorporated |
| Sector: Technology | |
| SubSector: Semiconductor - Broad Line | |
| MarketCap: 99509.1 Millions | |
| Recent Price: 163.97 Smart Investing & Trading Score: 46 | |
| Day Percent Change: 0.18% Day Change: 0.30 | |
| Week Change: -1.42% Year-to-date Change: -3.8% | |
| TXN Links: Profile News Message Board | |
| Charts:- Daily , Weekly | |
| Add TXN to Watchlist: View: Get TXN Trend Analysis ➞ | |
 | LYV Live Nation Entertainment, Inc. |
| Sector: Services & Goods | |
| SubSector: Entertainment - Diversified | |
| MarketCap: 8457.17 Millions | |
| Recent Price: 90.00 Smart Investing & Trading Score: 26 | |
| Day Percent Change: 0.40% Day Change: 0.36 | |
| Week Change: -10.93% Year-to-date Change: -3.9% | |
| LYV Links: Profile News Message Board | |
| Charts:- Daily , Weekly | |
| Add LYV to Watchlist: View: Get LYV Trend Analysis ➞ | |
 | HST Host Hotels & Resorts, Inc. |
| Sector: Financials | |
| SubSector: REIT - Hotel/Motel | |
| MarketCap: 8253.74 Millions | |
| Recent Price: 18.67 Smart Investing & Trading Score: 10 | |
| Day Percent Change: 0.43% Day Change: 0.08 | |
| Week Change: -6.65% Year-to-date Change: -4.1% | |
| HST Links: Profile News Message Board | |
| Charts:- Daily , Weekly | |
| Add HST to Watchlist: View: Get HST Trend Analysis ➞ | |
 | A Agilent Technologies, Inc. |
| Sector: Health Care | |
| SubSector: Medical Laboratories & Research | |
| MarketCap: 22337.9 Millions | |
| Recent Price: 133.26 Smart Investing & Trading Score: 36 | |
| Day Percent Change: 0.62% Day Change: 0.82 | |
| Week Change: -5.31% Year-to-date Change: -4.2% | |
| A Links: Profile News Message Board | |
| Charts:- Daily , Weekly | |
| Add A to Watchlist: View: Get A Trend Analysis ➞ | |
 | PANW Palo Alto Networks, Inc. |
| Sector: Technology | |
| SubSector: Networking & Communication Devices | |
| MarketCap: 16039.4 Millions | |
| Recent Price: 282.46 Smart Investing & Trading Score: 50 | |
| Day Percent Change: 0.47% Day Change: 1.32 | |
| Week Change: 1.21% Year-to-date Change: -4.2% | |
| PANW Links: Profile News Message Board | |
| Charts:- Daily , Weekly | |
| Add PANW to Watchlist: View: Get PANW Trend Analysis ➞ | |
 | RF Regions Financial Corporation |
| Sector: Financials | |
| SubSector: Regional - Southeast Banks | |
| MarketCap: 8936.25 Millions | |
| Recent Price: 18.56 Smart Investing & Trading Score: 33 | |
| Day Percent Change: -2.32% Day Change: -0.44 | |
| Week Change: -3.28% Year-to-date Change: -4.2% | |
| RF Links: Profile News Message Board | |
| Charts:- Daily , Weekly | |
| Add RF to Watchlist: View: Get RF Trend Analysis ➞ | |
 | COO The Cooper Companies, Inc. |
| Sector: Health Care | |
| SubSector: Medical Instruments & Supplies | |
| MarketCap: 15460 Millions | |
| Recent Price: 90.50 Smart Investing & Trading Score: 18 | |
| Day Percent Change: 0.10% Day Change: 0.09 | |
| Week Change: -3.23% Year-to-date Change: -4.3% | |
| COO Links: Profile News Message Board | |
| Charts:- Daily , Weekly | |
| Add COO to Watchlist: View: Get COO Trend Analysis ➞ | |
 | CSCO Cisco Systems, Inc. |
| Sector: Technology | |
| SubSector: Communication Equipment | |
| MarketCap: 168483 Millions | |
| Recent Price: 48.31 Smart Investing & Trading Score: 25 | |
| Day Percent Change: 0.41% Day Change: 0.20 | |
| Week Change: -0.38% Year-to-date Change: -4.4% | |
| CSCO Links: Profile News Message Board | |
| Charts:- Daily , Weekly | |
| Add CSCO to Watchlist: View: Get CSCO Trend Analysis ➞ | |
 | ESS Essex Property Trust, Inc. |
| Sector: Financials | |
| SubSector: REIT - Residential | |
| MarketCap: 13725.5 Millions | |
| Recent Price: 236.64 Smart Investing & Trading Score: 68 | |
| Day Percent Change: 1.14% Day Change: 2.67 | |
| Week Change: -1.11% Year-to-date Change: -4.6% | |
| ESS Links: Profile News Message Board | |
| Charts:- Daily , Weekly | |
| Add ESS to Watchlist: View: Get ESS Trend Analysis ➞ | |
 | ITW Illinois Tool Works Inc. |
| Sector: Industrials | |
| SubSector: Diversified Machinery | |
| MarketCap: 45324.8 Millions | |
| Recent Price: 249.96 Smart Investing & Trading Score: 25 | |
| Day Percent Change: 0.45% Day Change: 1.13 | |
| Week Change: -1.4% Year-to-date Change: -4.6% | |
| ITW Links: Profile News Message Board | |
| Charts:- Daily , Weekly | |
| Add ITW to Watchlist: View: Get ITW Trend Analysis ➞ | |
 | UNH UnitedHealth Group Incorporated |
| Sector: Health Care | |
| SubSector: Health Care Plans | |
| MarketCap: 217384 Millions | |
| Recent Price: 502.15 Smart Investing & Trading Score: 74 | |
| Day Percent Change: 1.82% Day Change: 8.97 | |
| Week Change: 14.33% Year-to-date Change: -4.6% | |
| UNH Links: Profile News Message Board | |
| Charts:- Daily , Weekly | |
| Add UNH to Watchlist: View: Get UNH Trend Analysis ➞ | |
 | ROST Ross Stores, Inc. |
| Sector: Services & Goods | |
| SubSector: Apparel Stores | |
| MarketCap: 24938.8 Millions | |
| Recent Price: 131.98 Smart Investing & Trading Score: 10 | |
| Day Percent Change: 0.14% Day Change: 0.18 | |
| Week Change: -2.95% Year-to-date Change: -4.6% | |
| ROST Links: Profile News Message Board | |
| Charts:- Daily , Weekly | |
| Add ROST to Watchlist: View: Get ROST Trend Analysis ➞ | |
 | MCO Moody s Corporation |
| Sector: Services & Goods | |
| SubSector: Business Services | |
| MarketCap: 35998.5 Millions | |
| Recent Price: 372.22 Smart Investing & Trading Score: 25 | |
| Day Percent Change: -0.64% Day Change: -2.38 | |
| Week Change: -1.31% Year-to-date Change: -4.7% | |
| MCO Links: Profile News Message Board | |
| Charts:- Daily , Weekly | |
| Add MCO to Watchlist: View: Get MCO Trend Analysis ➞ | |
 | NXPI NXP Semiconductors N.V. |
| Sector: Technology | |
| SubSector: Semiconductor - Broad Line | |
| MarketCap: 22497.9 Millions | |
| Recent Price: 218.68 Smart Investing & Trading Score: 26 | |
| Day Percent Change: -0.31% Day Change: -0.67 | |
| Week Change: -6.39% Year-to-date Change: -4.8% | |
| NXPI Links: Profile News Message Board | |
| Charts:- Daily , Weekly | |
| Add NXPI to Watchlist: View: Get NXPI Trend Analysis ➞ | |
 | MGM MGM Resorts International |
| Sector: Services & Goods | |
| SubSector: Resorts & Casinos | |
| MarketCap: 5315.04 Millions | |
| Recent Price: 42.53 Smart Investing & Trading Score: 18 | |
| Day Percent Change: 1.18% Day Change: 0.49 | |
| Week Change: 0.13% Year-to-date Change: -4.8% | |
| MGM Links: Profile News Message Board | |
| Charts:- Daily , Weekly | |
| Add MGM to Watchlist: View: Get MGM Trend Analysis ➞ | |
 | QRVO Qorvo, Inc. |
| Sector: Technology | |
| SubSector: Semiconductor - Broad Line | |
| MarketCap: 9524.32 Millions | |
| Recent Price: 107.18 Smart Investing & Trading Score: 31 | |
| Day Percent Change: -0.61% Day Change: -0.66 | |
| Week Change: -3.75% Year-to-date Change: -4.8% | |
| QRVO Links: Profile News Message Board | |
| Charts:- Daily , Weekly | |
| Add QRVO to Watchlist: View: Get QRVO Trend Analysis ➞ | |
 | BKR Baker Hughes Company |
| Sector: Services & Goods | |
| SubSector: Technical Services | |
| MarketCap: 1330 Millions | |
| Recent Price: 32.52 Smart Investing & Trading Score: 61 | |
| Day Percent Change: 1.01% Day Change: 0.32 | |
| Week Change: -1.59% Year-to-date Change: -4.8% | |
| BKR Links: Profile News Message Board | |
| Charts:- Daily , Weekly | |
| Add BKR to Watchlist: View: Get BKR Trend Analysis ➞ | |
 | STT State Street Corporation |
| Sector: Financials | |
| SubSector: Asset Management | |
| MarketCap: 18623 Millions | |
| Recent Price: 73.65 Smart Investing & Trading Score: 50 | |
| Day Percent Change: 0.84% Day Change: 0.61 | |
| Week Change: -2.81% Year-to-date Change: -4.9% | |
| STT Links: Profile News Message Board | |
| Charts:- Daily , Weekly | |
| Add STT to Watchlist: View: Get STT Trend Analysis ➞ | |
 | UDR UDR, Inc. |
| Sector: Financials | |
| SubSector: REIT - Residential | |
| MarketCap: 10180.1 Millions | |
| Recent Price: 36.39 Smart Investing & Trading Score: 55 | |
| Day Percent Change: 1.70% Day Change: 0.61 | |
| Week Change: -0.68% Year-to-date Change: -5.0% | |
| UDR Links: Profile News Message Board | |
| Charts:- Daily , Weekly | |
| Add UDR to Watchlist: View: Get UDR Trend Analysis ➞ | |
 | EQT EQT Corporation |
| Sector: Energy | |
| SubSector: Independent Oil & Gas | |
| MarketCap: 1886.63 Millions | |
| Recent Price: 36.66 Smart Investing & Trading Score: 71 | |
| Day Percent Change: 1.21% Day Change: 0.44 | |
| Week Change: -1.58% Year-to-date Change: -5.2% | |
| EQT Links: Profile News Message Board | |
| Charts:- Daily , Weekly | |
| Add EQT to Watchlist: View: Get EQT Trend Analysis ➞ | |
 | NEM Newmont Corporation |
| Sector: Materials | |
| SubSector: Gold | |
| MarketCap: 33928.8 Millions | |
| Recent Price: 39.15 Smart Investing & Trading Score: 83 | |
| Day Percent Change: 1.54% Day Change: 0.60 | |
| Week Change: 1.31% Year-to-date Change: -5.4% | |
| NEM Links: Profile News Message Board | |
| Charts:- Daily , Weekly | |
| Add NEM to Watchlist: View: Get NEM Trend Analysis ➞ | |
 | BMY Bristol-Myers Squibb Company |
| Sector: Health Care | |
| SubSector: Drug Manufacturers - Major | |
| MarketCap: 117052 Millions | |
| Recent Price: 48.51 Smart Investing & Trading Score: 35 | |
| Day Percent Change: 0.43% Day Change: 0.21 | |
| Week Change: 0.48% Year-to-date Change: -5.5% | |
| BMY Links: Profile News Message Board | |
| Charts:- Daily , Weekly | |
| Add BMY to Watchlist: View: Get BMY Trend Analysis ➞ | |
 | DHI D.R. Horton, Inc. |
| Sector: Industrials | |
| SubSector: Residential Construction | |
| MarketCap: 13372.6 Millions | |
| Recent Price: 143.60 Smart Investing & Trading Score: 44 | |
| Day Percent Change: -1.56% Day Change: -2.28 | |
| Week Change: -5.35% Year-to-date Change: -5.5% | |
| DHI Links: Profile News Message Board | |
| Charts:- Daily , Weekly | |
| Add DHI to Watchlist: View: Get DHI Trend Analysis ➞ | |
| For tabular summary view of above stock list: Summary View ➞ 0 - 25 , 25 - 50 , 50 - 75 , 75 - 100 , 100 - 125 , 125 - 150 , 150 - 175 , 175 - 200 , 200 - 225 , 225 - 250 , 250 - 275 , 275 - 300 , 300 - 325 , 325 - 350 , 350 - 375 , 375 - 400 , 400 - 425 , 425 - 450 , 450 - 475 , 475 - 500 | ||
| Click To Change The Sort Order: By Market Cap or Company Size Performance: Year-to-date, Week and Day | |
| Select Chart Type: | ||
|
Best Stocks Today 12Stocks.com |
© 2024 12Stocks.com Terms & Conditions Privacy Contact Us
All Information Provided Only For Education And Not To Be Used For Investing or Trading. See Terms & Conditions


One More Thing ... Get Best Stocks Delivered Daily!
Never Ever Miss A Move With Our Top Ten Stocks Lists
Find Best Stocks In Any Market - Bull or Bear Market
Take A Peek At Our Top Ten Stocks Lists: Daily, Weekly, Year-to-Date & Top Trends
Find Best Stocks In Any Market - Bull or Bear Market
Take A Peek At Our Top Ten Stocks Lists: Daily, Weekly, Year-to-Date & Top Trends
S&P 500 Stocks With Best Up Trends [0-bearish to 100-bullish]: Wells Fargo[100], Bunge [100], Lockheed Martin[100], Conagra Brands[100], Genuine Parts[100], United Airlines[100], Kinder Morgan[93], Generac Holdings[93], Freeport-McMoRan [93], Philip Morris[93], Progressive [90]
Best S&P 500 Stocks Year-to-Date:
NVIDIA [66.66%], Constellation [57.45%], Meta Platforms[38.28%], NRG [36.11%], Progressive [34.35%], Marathon [33.2%], Targa Resources[31.03%], Diamondback [30.74%], Western Digital[29.2%], Eaton [28.4%], Micron [27.36%] Best S&P 500 Stocks This Week:
United Airlines[23.18%], UnitedHealth [14.33%], Genuine Parts[10.93%], Globe Life[10.86%], American Airlines[8.4%], ProShares UltraPro[7.66%], Southwest Airlines[7.43%], Wells Fargo[7.31%], V.F [6.11%], Morgan Stanley[5.88%], Centene [5.68%] Best S&P 500 Stocks Daily:
Fifth Third[5.13%], American Express[4.47%], Kinder Morgan[3.51%], Bank of America[3.40%], Wells Fargo[3.17%], Bunge [2.96%], PNC Financial[2.77%], Generac Holdings[2.63%], Synchrony Financial[2.48%], Citizens Financial[2.46%], Truist Financial[2.42%]