
 Login Sign Up


| |||||
 |  | ||||

| 12Stocks.com Market Intelligence |
Best S&P 500 Stocks
|
On this page, you will find the most comprehensive analysis of S&P 500 stocks and ETFs - from latest trends to performances to charts ➞. First, here are the year-to-date (YTD) performances of the most requested S&P 500 stocks at 12Stocks.com (click stock for review):
| Intel Corp 84% | ||
| Caterpillar Inc 38% | ||
| Goldman Sachs 37% | ||
| NVIDIA Corp 37% | ||
| Johnson & Johnson 31% | ||
| JPMorgan Chase 30% | ||
| Google Inc 30% | ||
| Boeing Co 27% | ||
| Microsoft 24% | ||
| Gilead 22% | ||
| Walmart Inc 13% | ||
| Chevron Corp 7% | ||
| Apple Inc 6% | ||
| McDonald's Corp 4% | ||
| Amazon.com Inc 1% | ||
| Starbucks Corp -5% | ||
| Merck & Co Inc -8% | ||
| Quick: S&P 500 Stocks Lists: Performances & Trends, S&P 500 Stock Charts
Sort S&P 500 stocks: Daily, Weekly, Year-to-Date, Market Cap & Trends. Filter S&P 500 stocks list by sector: Show all, Tech, Finance, Energy, Staples, Retail, Industrial, Materials, Utilities and HealthCare |
| 12Stocks.com S&P 500 Stocks Performances & Trends Daily Report | |||||||||
|
| 
The overall Smart Investing & Trading Score is 90 (0-bearish to 100-bullish) which puts S&P 500 index in short term bullish trend. The Smart Investing & Trading Score from previous trading session is 80 and an improvement of trend continues. | ||||||||
Here are the Smart Investing & Trading Scores of the most requested S&P 500 stocks at 12Stocks.com (click stock name for detailed review):
|


| 12Stocks.com: Top Performing S&P 500 Index Stocks | ||||||||||||||||||||||||||||||||||||||||||||||||
 The top performing S&P 500 Index stocks year to date are
Now, more recently, over last week, the top performing S&P 500 Index stocks on the move are


|
||||||||||||||||||||||||||||||||||||||||||||||||
| 12Stocks.com: Investing in S&P 500 Index with Stocks | |
|
The following table helps investors and traders sort through current performance and trends (as measured by Smart Investing & Trading Score) of various
stocks in the S&P 500 Index. Quick View: Move mouse or cursor over stock symbol (ticker) to view short-term technical chart and over stock name to view long term chart. Click on  to add stock symbol to your watchlist and to add stock symbol to your watchlist and  to view watchlist. Click on any ticker or stock name for detailed market intelligence report for that stock. to view watchlist. Click on any ticker or stock name for detailed market intelligence report for that stock. |
12Stocks.com Performance of Stocks in S&P 500 Index
| Ticker | Stock Name | Watchlist | Category | Recent Price | Smart Investing & Trading Score | Change % | YTD Change% |
| AMZN | Amazon.com Inc |   | Services & Goods | 222.42 | 50 | 0.81% | 1.00% |
| TSLA | Tesla Inc | | Services & Goods | 435.91 | 60 | -5.13% | 14.93% |
| HD | Home Depot | | Services & Goods | 395.01 | 10 | -0.51% | 2.97% |
| MCD | McDonald's Corp | | Services & Goods | 299.88 | 10 | -0.21% | 3.70% |
| BKNG | Booking Holdings | | Services & Goods | 5430.36 | 30 | 1.49% | 10.67% |
| TJX | TJX | | Services & Goods | 142.49 | 50 | -1.27% | 18.35% |
| LOW | Lowe's Cos. | | Services & Goods | 247.33 | 30 | -0.27% | 1.65% |
| NKE | Nike Inc | | Services & Goods | 74.57 | 90 | 0.50% | 2.41% |
| SBUX | Starbucks Corp | | Services & Goods | 86.73 | 80 | 2.76% | -4.73% |
| RCL | Royal Caribbean | | Services & Goods | 320.11 | 20 | 1.29% | 40.66% |
| ORLY | O'Reilly Automotive | | Services & Goods | 104.97 | 30 | -0.67% | 32.57% |
| ABNB | Airbnb Inc | | Services & Goods | 121.49 | 0 | -0.68% | -7.60% |
| MAR | Marriott | | Services & Goods | 266.40 | 50 | 1.81% | -2.47% |
| AZO | Autozone Inc | | Services & Goods | 4253.71 | 40 | 0.14% | 30.88% |
| HLT | Hilton Worldwide | | Services & Goods | 258.91 | 10 | 0.84% | 5.75% |
| GM | General Motors | | Services & Goods | 59.36 | 50 | -3.23% | 16.22% |
| CMG | Chipotle Mexican | | Services & Goods | 40.27 | 60 | 3.34% | -32.76% |
| DHI | D.R. Horton | | Services & Goods | 171.47 | 80 | -0.56% | 25.67% |
| ROST | Ross Stores | | Services & Goods | 156.17 | 100 | 1.94% | 2.96% |
| F | Ford Motor | | Services & Goods | 12.22 | 100 | -0.41% | 34.46% |
| EBAY | EBay Inc | | Services & Goods | 88.40 | 0 | 0.94% | 43.18% |
| CCL | Carnival Corp | | Services & Goods | 28.85 | 10 | 1.73% | 15.35% |
| YUM | Yum Brands | | Services & Goods | 151.35 | 50 | -1.20% | 14.42% |
| LVS | Las Vegas | | Services & Goods | 55.05 | 80 | 0.51% | 12.23% |
| LEN | Lennar Corp | | Services & Goods | 128.33 | 80 | 0.09% | 8.42% |
| For chart view version of above stock list: Chart View ➞ 0 - 25 , 25 - 50 , 50 - 75 | ||
 | Click To Change The Sort Order: By Market Cap or Company Size Performance: Year-to-date, Week and Day |  |
|
Get the most comprehensive stock market coverage daily at 12Stocks.com ➞ Best Stocks Today ➞ Best Stocks Weekly ➞ Best Stocks Year-to-Date ➞ Best Stocks Trends ➞  Best Stocks Today 12Stocks.com Best Nasdaq Stocks ➞ Best S&P 500 Stocks ➞ Best Tech Stocks ➞ Best Biotech Stocks ➞ |
| Detailed Overview of S&P 500 Stocks |
| S&P 500 Technical Overview, Leaders & Laggards, Top S&P 500 ETF Funds & Detailed S&P 500 Stocks List, Charts, Trends & More |
| S&P 500: Technical Analysis, Trends & YTD Performance | |
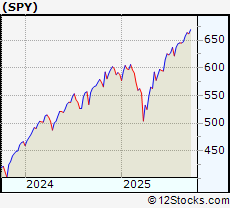
| S&P 500 index as represented by
SPY, an exchange-traded fund [ETF], holds basket of five hundred (mostly largecap) stocks from across all major sectors of the US stock market. The S&P 500 index (contains stocks like Apple and Exxon) is up by 15.1527% and is currently outperforming the overall market by 0.3948% year-to-date. Below is a quick view of technical charts and trends: | |
 SPY Weekly Chart |
|
| Long Term Trend: Very Good | |
| Medium Term Trend: Good | |
 SPY Daily Chart |
|
| Short Term Trend: Very Good | |
| Overall Trend Score: 90 | |
| YTD Performance: 15.1527% | |
| **Trend Scores & Views Are Only For Educational Purposes And Not For Investing | |
| 12Stocks.com: Investing in S&P 500 Index using Exchange Traded Funds | |
|
The following table shows list of key exchange traded funds (ETF) that
help investors track S&P 500 index. The following list also includes leveraged ETF funds that track twice or thrice the daily returns of S&P 500 indices. Short or inverse ETF funds move in the opposite direction to the index they track and are useful during market pullbacks or during bear markets. Quick View: Move mouse or cursor over ETF symbol (ticker) to view short-term technical chart and over ETF name to view long term chart. Click on ticker or stock name for detailed view. Click on to add stock symbol to your watchlist and to view watchlist. |
12Stocks.com List of ETFs that track S&P 500 Index
| Ticker | ETF Name | Watchlist | Recent Price | Smart Investing & Trading Score | Change % | Week % | Year-to-date % |
| SPY | SPDR S&P 500 ETF Trust | | 669.22 | 90 | 0.115192 | 1.22826 | 15.1527% |
| IVV | iShares Core S&P 500 ETF | | 672.50 | 90 | 0.0982377 | 1.24048 | 15.1922% |
| VOO | Vanguard S&P 500 ETF | | 615.25 | 90 | 0.107389 | 0.943396 | 15.2251% |
| OEF | iShares S&P 100 ETF | | 334.28 | 90 | 0.00598337 | 1.05505 | 16.5396% |
| SSO | ProShares Ultra S&P500 2x Shares | | 113.12 | 90 | 0.177117 | 2.334 | 23.4297% |
| UPRO | ProShares UltraPro S&P 500 ETF 3x Shares | | 113.01 | 90 | 0.275067 | 3.45112 | 29.2069% |
| SPXL | Direxion Daily S&P 500 Bull 3X Shares | | 214.76 | 90 | 0.28953 | 3.47386 | 29.2396% |
| SH | ProShares Short S&P500 -1x Shares | | 36.80 | 10 | -0.0543183 | -1.07527 | -11.8852% |
| SDS | ProShares UltraShort S&P500 -2x Shares | | 14.33 | 10 | -0.139373 | -2.1843 | -25.9516% |
| SPXU | ProShares UltraPro Short S&P 500 | | 13.34 | 10 | -0.224383 | -3.26323 | -40.0301% |
| SPXS | Direxion Daily S&P 500 Bear -3X Shares | | 37.50 | 70 | -0.239425 | 868.992 | 503.962% |
| 12Stocks.com: Charts, Trends, Fundamental Data and Performances of S&P 500 Stocks | |
|
We now take in-depth look at all S&P 500 stocks including charts, multi-period performances and overall trends (as measured by Smart Investing & Trading Score). One can sort S&P 500 stocks (click link to choose) by Daily, Weekly and by Year-to-Date performances. Also, one can sort by size of the company or by market capitalization. |
| Select Your Default Chart Type: | |||||
| |||||
| Click on stock symbol or name for detailed view. Click on to add stock symbol to your watchlist and to view watchlist. Quick View: Move mouse or cursor over "Daily" to quickly view daily technical stock chart and over "Weekly" to view weekly technical stock chart. | |||||

 | AMZN Amazon.com Inc |
| Sector: Services & Goods | |
| SubSector: Internet Retail | |
| MarketCap: 2477780 Millions | |
| Recent Price: 222.42 Smart Investing & Trading Score: 50 | |
| Day Percent Change: 0.811313% Day Change: 1.41 | |
| Week Change: 1.00359% Year-to-date Change: 1.0% | |
| AMZN Links: Profile News Message Board | |
| Charts:- Daily , Weekly | |
| Add AMZN to Watchlist: View: Get AMZN Trend Analysis ➞ | |
 | TSLA Tesla Inc |
| Sector: Services & Goods | |
| SubSector: Auto Manufacturers | |
| MarketCap: 1131620 Millions | |
| Recent Price: 435.91 Smart Investing & Trading Score: 60 | |
| Day Percent Change: -5.12558% Day Change: -18.23 | |
| Week Change: -1.55378% Year-to-date Change: 14.9% | |
| TSLA Links: Profile News Message Board | |
| Charts:- Daily , Weekly | |
| Add TSLA to Watchlist: View: Get TSLA Trend Analysis ➞ | |
 | HD Home Depot, Inc |
| Sector: Services & Goods | |
| SubSector: Home Improvement Retail | |
| MarketCap: 417017 Millions | |
| Recent Price: 395.01 Smart Investing & Trading Score: 10 | |
| Day Percent Change: -0.506272% Day Change: -0.97 | |
| Week Change: -3.60202% Year-to-date Change: 3.0% | |
| HD Links: Profile News Message Board | |
| Charts:- Daily , Weekly | |
| Add HD to Watchlist: View: Get HD Trend Analysis ➞ | |
 | MCD McDonald's Corp |
| Sector: Services & Goods | |
| SubSector: Restaurants | |
| MarketCap: 224343 Millions | |
| Recent Price: 299.88 Smart Investing & Trading Score: 10 | |
| Day Percent Change: -0.212964% Day Change: 1.48 | |
| Week Change: -1.46223% Year-to-date Change: 3.7% | |
| MCD Links: Profile News Message Board | |
| Charts:- Daily , Weekly | |
| Add MCD to Watchlist: View: Get MCD Trend Analysis ➞ | |
 | BKNG Booking Holdings Inc |
| Sector: Services & Goods | |
| SubSector: Travel Services | |
| MarketCap: 178442 Millions | |
| Recent Price: 5430.36 Smart Investing & Trading Score: 30 | |
| Day Percent Change: 1.49143% Day Change: 25.47 | |
| Week Change: -1.72361% Year-to-date Change: 10.7% | |
| BKNG Links: Profile News Message Board | |
| Charts:- Daily , Weekly | |
| Add BKNG to Watchlist: View: Get BKNG Trend Analysis ➞ | |
 | TJX TJX Companies, Inc |
| Sector: Services & Goods | |
| SubSector: Apparel Retail | |
| MarketCap: 154988 Millions | |
| Recent Price: 142.49 Smart Investing & Trading Score: 50 | |
| Day Percent Change: -1.26802% Day Change: -1.41 | |
| Week Change: 1.4597% Year-to-date Change: 18.4% | |
| TJX Links: Profile News Message Board | |
| Charts:- Daily , Weekly | |
| Add TJX to Watchlist: View: Get TJX Trend Analysis ➞ | |
 | LOW Lowe's Cos., Inc |
| Sector: Services & Goods | |
| SubSector: Home Improvement Retail | |
| MarketCap: 151406 Millions | |
| Recent Price: 247.33 Smart Investing & Trading Score: 30 | |
| Day Percent Change: -0.26614% Day Change: 0.05 | |
| Week Change: -3.88606% Year-to-date Change: 1.6% | |
| LOW Links: Profile News Message Board | |
| Charts:- Daily , Weekly | |
| Add LOW to Watchlist: View: Get LOW Trend Analysis ➞ | |
 | NKE Nike, Inc |
| Sector: Services & Goods | |
| SubSector: Footwear & Accessories | |
| MarketCap: 109158 Millions | |
| Recent Price: 74.57 Smart Investing & Trading Score: 90 | |
| Day Percent Change: 0.498652% Day Change: -0.02 | |
| Week Change: 4.70373% Year-to-date Change: 2.4% | |
| NKE Links: Profile News Message Board | |
| Charts:- Daily , Weekly | |
| Add NKE to Watchlist: View: Get NKE Trend Analysis ➞ | |
 | SBUX Starbucks Corp |
| Sector: Services & Goods | |
| SubSector: Restaurants | |
| MarketCap: 97108.3 Millions | |
| Recent Price: 86.73 Smart Investing & Trading Score: 80 | |
| Day Percent Change: 2.76066% Day Change: 2.34 | |
| Week Change: 2.91919% Year-to-date Change: -4.7% | |
| SBUX Links: Profile News Message Board | |
| Charts:- Daily , Weekly | |
| Add SBUX to Watchlist: View: Get SBUX Trend Analysis ➞ | |
 | RCL Royal Caribbean Group |
| Sector: Services & Goods | |
| SubSector: Travel Services | |
| MarketCap: 95686.3 Millions | |
| Recent Price: 320.11 Smart Investing & Trading Score: 20 | |
| Day Percent Change: 1.29422% Day Change: 2.73 | |
| Week Change: -2.11601% Year-to-date Change: 40.7% | |
| RCL Links: Profile News Message Board | |
| Charts:- Daily , Weekly | |
| Add RCL to Watchlist: View: Get RCL Trend Analysis ➞ | |
 | ORLY O'Reilly Automotive, Inc |
| Sector: Services & Goods | |
| SubSector: Auto Parts | |
| MarketCap: 88956.4 Millions | |
| Recent Price: 104.97 Smart Investing & Trading Score: 30 | |
| Day Percent Change: -0.67184% Day Change: -0.53 | |
| Week Change: 1.4497% Year-to-date Change: 32.6% | |
| ORLY Links: Profile News Message Board | |
| Charts:- Daily , Weekly | |
| Add ORLY to Watchlist: View: Get ORLY Trend Analysis ➞ | |
 | ABNB Airbnb Inc |
| Sector: Services & Goods | |
| SubSector: Travel Services | |
| MarketCap: 76940 Millions | |
| Recent Price: 121.49 Smart Investing & Trading Score: 0 | |
| Day Percent Change: -0.678548% Day Change: -1.02 | |
| Week Change: -1.29184% Year-to-date Change: -7.6% | |
| ABNB Links: Profile News Message Board | |
| Charts:- Daily , Weekly | |
| Add ABNB to Watchlist: View: Get ABNB Trend Analysis ➞ | |
 | MAR Marriott International, Inc |
| Sector: Services & Goods | |
| SubSector: Lodging | |
| MarketCap: 71854.9 Millions | |
| Recent Price: 266.40 Smart Investing & Trading Score: 50 | |
| Day Percent Change: 1.81151% Day Change: 3.49 | |
| Week Change: 1.62509% Year-to-date Change: -2.5% | |
| MAR Links: Profile News Message Board | |
| Charts:- Daily , Weekly | |
| Add MAR to Watchlist: View: Get MAR Trend Analysis ➞ | |
 | AZO Autozone Inc |
| Sector: Services & Goods | |
| SubSector: Auto Parts | |
| MarketCap: 70585.3 Millions | |
| Recent Price: 4253.71 Smart Investing & Trading Score: 40 | |
| Day Percent Change: 0.135359% Day Change: 26.85 | |
| Week Change: 1.83917% Year-to-date Change: 30.9% | |
| AZO Links: Profile News Message Board | |
| Charts:- Daily , Weekly | |
| Add AZO to Watchlist: View: Get AZO Trend Analysis ➞ | |
 | HLT Hilton Worldwide Holdings Inc |
| Sector: Services & Goods | |
| SubSector: Lodging | |
| MarketCap: 64043.3 Millions | |
| Recent Price: 258.91 Smart Investing & Trading Score: 10 | |
| Day Percent Change: 0.841285% Day Change: 2.23 | |
| Week Change: -1.61873% Year-to-date Change: 5.7% | |
| HLT Links: Profile News Message Board | |
| Charts:- Daily , Weekly | |
| Add HLT to Watchlist: View: Get HLT Trend Analysis ➞ | |
 | GM General Motors Company |
| Sector: Services & Goods | |
| SubSector: Auto Manufacturers | |
| MarketCap: 55477.6 Millions | |
| Recent Price: 59.36 Smart Investing & Trading Score: 50 | |
| Day Percent Change: -3.22791% Day Change: -1.63 | |
| Week Change: -0.934579% Year-to-date Change: 16.2% | |
| GM Links: Profile News Message Board | |
| Charts:- Daily , Weekly | |
| Add GM to Watchlist: View: Get GM Trend Analysis ➞ | |
 | CMG Chipotle Mexican Grill |
| Sector: Services & Goods | |
| SubSector: Restaurants | |
| MarketCap: 55056.7 Millions | |
| Recent Price: 40.27 Smart Investing & Trading Score: 60 | |
| Day Percent Change: 3.3359% Day Change: 1.25 | |
| Week Change: 1.82048% Year-to-date Change: -32.8% | |
| CMG Links: Profile News Message Board | |
| Charts:- Daily , Weekly | |
| Add CMG to Watchlist: View: Get CMG Trend Analysis ➞ | |
 | DHI D.R. Horton Inc |
| Sector: Services & Goods | |
| SubSector: Residential Construction | |
| MarketCap: 54198.9 Millions | |
| Recent Price: 171.47 Smart Investing & Trading Score: 80 | |
| Day Percent Change: -0.562514% Day Change: -1.17 | |
| Week Change: 2.40072% Year-to-date Change: 25.7% | |
| DHI Links: Profile News Message Board | |
| Charts:- Daily , Weekly | |
| Add DHI to Watchlist: View: Get DHI Trend Analysis ➞ | |
 | ROST Ross Stores, Inc |
| Sector: Services & Goods | |
| SubSector: Apparel Retail | |
| MarketCap: 49371.3 Millions | |
| Recent Price: 156.17 Smart Investing & Trading Score: 100 | |
| Day Percent Change: 1.93864% Day Change: 3.42 | |
| Week Change: 4.51047% Year-to-date Change: 3.0% | |
| ROST Links: Profile News Message Board | |
| Charts:- Daily , Weekly | |
| Add ROST to Watchlist: View: Get ROST Trend Analysis ➞ | |
 | F Ford Motor Co |
| Sector: Services & Goods | |
| SubSector: Auto Manufacturers | |
| MarketCap: 46723.6 Millions | |
| Recent Price: 12.22 Smart Investing & Trading Score: 100 | |
| Day Percent Change: -0.407498% Day Change: -0.08 | |
| Week Change: 5.07309% Year-to-date Change: 34.5% | |
| F Links: Profile News Message Board | |
| Charts:- Daily , Weekly | |
| Add F to Watchlist: View: Get F Trend Analysis ➞ | |
 | EBAY EBay Inc |
| Sector: Services & Goods | |
| SubSector: Internet Retail | |
| MarketCap: 42345.6 Millions | |
| Recent Price: 88.40 Smart Investing & Trading Score: 0 | |
| Day Percent Change: 0.936287% Day Change: 0.98 | |
| Week Change: -5.31277% Year-to-date Change: 43.2% | |
| EBAY Links: Profile News Message Board | |
| Charts:- Daily , Weekly | |
| Add EBAY to Watchlist: View: Get EBAY Trend Analysis ➞ | |
 | CCL Carnival Corp |
| Sector: Services & Goods | |
| SubSector: Travel Services | |
| MarketCap: 41060.4 Millions | |
| Recent Price: 28.85 Smart Investing & Trading Score: 10 | |
| Day Percent Change: 1.72779% Day Change: 0.45 | |
| Week Change: -5.00494% Year-to-date Change: 15.4% | |
| CCL Links: Profile News Message Board | |
| Charts:- Daily , Weekly | |
| Add CCL to Watchlist: View: Get CCL Trend Analysis ➞ | |
 | YUM Yum Brands Inc |
| Sector: Services & Goods | |
| SubSector: Restaurants | |
| MarketCap: 40126.1 Millions | |
| Recent Price: 151.35 Smart Investing & Trading Score: 50 | |
| Day Percent Change: -1.20112% Day Change: -1.65 | |
| Week Change: 1.27133% Year-to-date Change: 14.4% | |
| YUM Links: Profile News Message Board | |
| Charts:- Daily , Weekly | |
| Add YUM to Watchlist: View: Get YUM Trend Analysis ➞ | |
 | LVS Las Vegas Sands Corp |
| Sector: Services & Goods | |
| SubSector: Resorts & Casinos | |
| MarketCap: 36862.6 Millions | |
| Recent Price: 55.05 Smart Investing & Trading Score: 80 | |
| Day Percent Change: 0.511229% Day Change: 0.08 | |
| Week Change: 3.88753% Year-to-date Change: 12.2% | |
| LVS Links: Profile News Message Board | |
| Charts:- Daily , Weekly | |
| Add LVS to Watchlist: View: Get LVS Trend Analysis ➞ | |
 | LEN Lennar Corp |
| Sector: Services & Goods | |
| SubSector: Residential Construction | |
| MarketCap: 36567.6 Millions | |
| Recent Price: 128.33 Smart Investing & Trading Score: 80 | |
| Day Percent Change: 0.0935964% Day Change: 0.01 | |
| Week Change: 2.10041% Year-to-date Change: 8.4% | |
| LEN Links: Profile News Message Board | |
| Charts:- Daily , Weekly | |
| Add LEN to Watchlist: View: Get LEN Trend Analysis ➞ | |
| For tabular summary view of above stock list: Summary View ➞ 0 - 25 , 25 - 50 , 50 - 75 | ||
| Click To Change The Sort Order: By Market Cap or Company Size Performance: Year-to-date, Week and Day | |
| Select Chart Type: | ||
|
Best Stocks Today 12Stocks.com |
© 2025 12Stocks.com Terms & Conditions Privacy Contact Us
All Information Provided Only For Education And Not To Be Used For Investing or Trading. See Terms & Conditions


One More Thing ... Get Best Stocks Delivered Daily!
Never Ever Miss A Move With Our Top Ten Stocks Lists
Find Best Stocks In Any Market - Bull or Bear Market
Take A Peek At Our Top Ten Stocks Lists: Daily, Weekly, Year-to-Date & Top Trends
Find Best Stocks In Any Market - Bull or Bear Market
Take A Peek At Our Top Ten Stocks Lists: Daily, Weekly, Year-to-Date & Top Trends
S&P 500 Stocks With Best Up Trends [0-bearish to 100-bullish]: Fair Isaac[100], Intel Corp[100], Bio-Techne Corp[100], DuPont de[100], First Solar[100], Centene Corp[100], Lam Research[100], Charles River[100], Applied Materials[100], Steel Dynamics[100], Teradyne Inc[100]
Best S&P 500 Stocks Year-to-Date:
Seagate [198.865%], Western Digital[181.204%], Newmont Corp[127.671%], Micron [110.87%], Lam Research[103.976%], Intel Corp[84.4708%], Warner Bros.[84.2%], NRG [82.3658%], CVS Health[81.156%], Amphenol Corp[79.8571%], KLA Corp[79.7904%] Best S&P 500 Stocks This Week:
Pioneer Natural[108.1%], Bio-Techne Corp[21.2222%], Electronic Arts[20.1076%], Western Digital[19.6645%], Intel Corp[19.4747%], Charles River[17.3369%], Fair Isaac[15.6495%], Lamb Weston[15.5663%], Lam Research[14.5184%], Seagate [13.8757%], Micron [13.6232%] Best S&P 500 Stocks Daily:
Fair Isaac[17.979%], Celanese Corp[6.98937%], Humana Inc[3.99157%], CF Industries[3.94539%], Eastman Chemical[3.88961%], Intel Corp[3.78408%], Albemarle Corp[3.7173%], Caesars Entertainment[3.66089%], Bio-Techne Corp[3.6215%], DuPont de[3.54129%], Advanced Micro[3.48759%]