
 Login Sign Up


| |||||
 |  | ||||

| 12Stocks.com Market Intelligence |
Best S&P 500 Stocks
|
On this page, you will find the most comprehensive analysis of S&P 500 stocks and ETFs - from latest trends to performances to charts ➞. First, here are the year-to-date (YTD) performances of the most requested S&P 500 stocks at 12Stocks.com (click stock for review):
| NVIDIA 54% | ||
| Caterpillar 20% | ||
| Merck 15% | ||
| Amazon.com 15% | ||
| Walmart 13% | ||
| Google 10% | ||
| JPMorgan Chase 9% | ||
| Chevron 7% | ||
| Microsoft 6% | ||
| Goldman Sachs 5% | ||
| Johnson & Johnson -6% | ||
| McDonald s -8% | ||
| Starbucks -9% | ||
| Apple -14% | ||
| Gilead -18% | ||
| Intel -32% | ||
| Boeing -35% | ||
| Quick: S&P 500 Stocks Lists: Performances & Trends, S&P 500 Stock Charts
Sort S&P 500 stocks: Daily, Weekly, Year-to-Date, Market Cap & Trends. Filter S&P 500 stocks list by sector: Show all, Tech, Finance, Energy, Staples, Retail, Industrial, Materials, Utilities and HealthCare |
| 12Stocks.com S&P 500 Stocks Performances & Trends Daily Report | |||||||||
|
| 
The overall Smart Investing & Trading Score is 26 (0-bearish to 100-bullish) which puts S&P 500 index in short term bearish to neutral trend. The Smart Investing & Trading Score from previous trading session is 36 and hence a deterioration of trend. | ||||||||
Here are the Smart Investing & Trading Scores of the most requested S&P 500 stocks at 12Stocks.com (click stock name for detailed review):
|


| 12Stocks.com: Top Performing S&P 500 Index Stocks | ||||||||||||||||||||||||||||||||||||||||||||||||
 The top performing S&P 500 Index stocks year to date are
Now, more recently, over last week, the top performing S&P 500 Index stocks on the move are


|
||||||||||||||||||||||||||||||||||||||||||||||||
| 12Stocks.com: Investing in S&P 500 Index with Stocks | |
|
The following table helps investors and traders sort through current performance and trends (as measured by Smart Investing & Trading Score) of various
stocks in the S&P 500 Index. Quick View: Move mouse or cursor over stock symbol (ticker) to view short-term technical chart and over stock name to view long term chart. Click on  to add stock symbol to your watchlist and to add stock symbol to your watchlist and  to view watchlist. Click on any ticker or stock name for detailed market intelligence report for that stock. to view watchlist. Click on any ticker or stock name for detailed market intelligence report for that stock. |
12Stocks.com Performance of Stocks in S&P 500 Index
| Ticker | Stock Name | Watchlist | Category | Recent Price | Smart Investing & Trading Score | Change % | YTD Change% |
| AMZN | Amazon.com |   | Services & Goods | 174.63 | 31 | -2.56% | 14.93% |
| WMT | Walmart | | Services & Goods | 59.53 | 49 | 0.46% | 13.28% |
| HD | Home Depot | | Services & Goods | 335.36 | 18 | 0.74% | -3.23% |
| DIS | Walt Disney | | Services & Goods | 112.61 | 46 | 0.16% | 24.72% |
| CMCSA | Comcast | | Services & Goods | 40.24 | 32 | 1.56% | -8.23% |
| COST | Costco Wholesale | | Services & Goods | 709.51 | 33 | -0.24% | 7.49% |
| MCD | McDonald s | | Services & Goods | 271.99 | 49 | 0.37% | -8.27% |
| SBUX | Starbucks | | Services & Goods | 87.61 | 49 | 0.53% | -8.75% |
| LOW | Lowe s | | Services & Goods | 230.24 | 58 | 0.63% | 3.46% |
| TGT | Target | | Services & Goods | 168.30 | 68 | 1.03% | 18.17% |
| SPGI | S&P Global | | Services & Goods | 412.56 | 25 | -0.20% | -6.35% |
| BKNG | Booking Holdings | | Services & Goods | 3414.82 | 0 | -0.45% | -3.73% |
| TJX | TJX | | Services & Goods | 93.36 | 18 | 0.76% | -0.48% |
| WBA | Walgreens Boots | | Services & Goods | 18.24 | 42 | 3.70% | -30.14% |
| DG | Dollar General | | Services & Goods | 144.82 | 61 | -0.59% | 6.52% |
| GPN | Global Payments | | Services & Goods | 122.10 | 10 | -0.07% | -3.86% |
| LVS | Las Vegas | | Services & Goods | 45.46 | 0 | -0.92% | -7.62% |
| MCO | Moody s | | Services & Goods | 374.67 | 25 | 0.02% | -4.07% |
| KR | Kroger Co | | Services & Goods | 56.57 | 68 | 1.80% | 23.76% |
| MAR | Marriott | | Services & Goods | 236.00 | 0 | -0.13% | 4.65% |
| ROST | Ross Stores | | Services & Goods | 133.34 | 18 | 1.17% | -3.65% |
| FOX | Twenty-First Century | | Services & Goods | 28.87 | 74 | 2.05% | 4.41% |
| MCK | McKesson | | Services & Goods | 524.83 | 44 | 1.16% | 13.36% |
| EBAY | eBay | | Services & Goods | 50.39 | 61 | 0.88% | 15.52% |
| ORLY | O Reilly | | Services & Goods | 1090.94 | 44 | -0.92% | 14.83% |
| For chart view version of above stock list: Chart View ➞ 0 - 25 , 25 - 50 , 50 - 75 | ||
 | Click To Change The Sort Order: By Market Cap or Company Size Performance: Year-to-date, Week and Day |  |
|
Get the most comprehensive stock market coverage daily at 12Stocks.com ➞ Best Stocks Today ➞ Best Stocks Weekly ➞ Best Stocks Year-to-Date ➞ Best Stocks Trends ➞  Best Stocks Today 12Stocks.com Best Nasdaq Stocks ➞ Best S&P 500 Stocks ➞ Best Tech Stocks ➞ Best Biotech Stocks ➞ |
| Detailed Overview of S&P 500 Stocks |
| S&P 500 Technical Overview, Leaders & Laggards, Top S&P 500 ETF Funds & Detailed S&P 500 Stocks List, Charts, Trends & More |
| S&P 500: Technical Analysis, Trends & YTD Performance | |
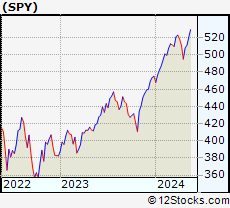
| S&P 500 index as represented by
SPY, an exchange-traded fund [ETF], holds basket of five hundred (mostly largecap) stocks from across all major sectors of the US stock market. The S&P 500 index (contains stocks like Apple and Exxon) is up by 4.18% and is currently outperforming the overall market by 0.8% year-to-date. Below is a quick view of technical charts and trends: | |
 SPY Weekly Chart |
|
| Long Term Trend: Good | |
| Medium Term Trend: Not Good | |
 SPY Daily Chart |
|
| Short Term Trend: Not Good | |
| Overall Trend Score: 26 | |
| YTD Performance: 4.18% | |
| **Trend Scores & Views Are Only For Educational Purposes And Not For Investing | |
| 12Stocks.com: Investing in S&P 500 Index using Exchange Traded Funds | |
|
The following table shows list of key exchange traded funds (ETF) that
help investors track S&P 500 index. The following list also includes leveraged ETF funds that track twice or thrice the daily returns of S&P 500 indices. Short or inverse ETF funds move in the opposite direction to the index they track and are useful during market pullbacks or during bear markets. Quick View: Move mouse or cursor over ETF symbol (ticker) to view short-term technical chart and over ETF name to view long term chart. Click on ticker or stock name for detailed view. Click on to add stock symbol to your watchlist and to view watchlist. |
12Stocks.com List of ETFs that track S&P 500 Index
| Ticker | ETF Name | Watchlist | Recent Price | Smart Investing & Trading Score | Change % | Week % | Year-to-date % |
| SPY | SPDR S&P 500 ETF | | 495.16 | 26 | -0.87 | -3.07 | 4.18% |
| IVV | iShares Core S&P 500 ETF | | 497.53 | 36 | -0.87 | -3.07 | 4.17% |
| VOO | Vanguard 500 ETF | | 455.10 | 36 | -0.84 | -3.08 | 4.19% |
| OEF | iShares S&P 100 | | 234.68 | 26 | -1.24 | -3.48 | 5.05% |
| SSO | ProShares Ultra S&P500 | | 69.11 | 26 | -1.73 | -6.18 | 6.21% |
| UPRO | ProShares UltraPro S&P500 | | 59.16 | 26 | -2.67 | -9.26 | 8.07% |
| SPXL | Direxion Daily S&P500 Bull 3X ETF | | 112.55 | 36 | -2.58 | -9.12 | 8.23% |
| SH | ProShares Short S&P500 | | 12.59 | 74 | 0.96 | 3.28 | -3.08% |
| SDS | ProShares UltraShort S&P500 | | 27.90 | 74 | 1.79 | 6.61 | -6.75% |
| SPXU | ProShares UltraPro Short S&P500 | | 38.33 | 74 | 2.68 | 9.95 | -10.86% |
| SPXS | Direxion Daily S&P 500 Bear 3X ETF | | 10.36 | 49 | 2.47 | 9.98 | -10.3% |
| 12Stocks.com: Charts, Trends, Fundamental Data and Performances of S&P 500 Stocks | |
|
We now take in-depth look at all S&P 500 stocks including charts, multi-period performances and overall trends (as measured by Smart Investing & Trading Score). One can sort S&P 500 stocks (click link to choose) by Daily, Weekly and by Year-to-Date performances. Also, one can sort by size of the company or by market capitalization. |
| Select Your Default Chart Type: | |||||
| |||||
| Click on stock symbol or name for detailed view. Click on to add stock symbol to your watchlist and to view watchlist. Quick View: Move mouse or cursor over "Daily" to quickly view daily technical stock chart and over "Weekly" to view weekly technical stock chart. | |||||

 | AMZN Amazon.com, Inc. |
| Sector: Services & Goods | |
| SubSector: Catalog & Mail Order Houses | |
| MarketCap: 998070 Millions | |
| Recent Price: 174.63 Smart Investing & Trading Score: 31 | |
| Day Percent Change: -2.56% Day Change: -4.59 | |
| Week Change: -6.18% Year-to-date Change: 14.9% | |
| AMZN Links: Profile News Message Board | |
| Charts:- Daily , Weekly | |
| Add AMZN to Watchlist: View: Get AMZN Trend Analysis ➞ | |
 | WMT Walmart Inc. |
| Sector: Services & Goods | |
| SubSector: Discount, Variety Stores | |
| MarketCap: 355610 Millions | |
| Recent Price: 59.53 Smart Investing & Trading Score: 49 | |
| Day Percent Change: 0.46% Day Change: 0.27 | |
| Week Change: -1.01% Year-to-date Change: 13.3% | |
| WMT Links: Profile News Message Board | |
| Charts:- Daily , Weekly | |
| Add WMT to Watchlist: View: Get WMT Trend Analysis ➞ | |
 | HD The Home Depot, Inc. |
| Sector: Services & Goods | |
| SubSector: Home Improvement Stores | |
| MarketCap: 185389 Millions | |
| Recent Price: 335.36 Smart Investing & Trading Score: 18 | |
| Day Percent Change: 0.74% Day Change: 2.47 | |
| Week Change: -2.19% Year-to-date Change: -3.2% | |
| HD Links: Profile News Message Board | |
| Charts:- Daily , Weekly | |
| Add HD to Watchlist: View: Get HD Trend Analysis ➞ | |
 | DIS The Walt Disney Company |
| Sector: Services & Goods | |
| SubSector: Entertainment - Diversified | |
| MarketCap: 178396 Millions | |
| Recent Price: 112.61 Smart Investing & Trading Score: 46 | |
| Day Percent Change: 0.16% Day Change: 0.18 | |
| Week Change: -1.23% Year-to-date Change: 24.7% | |
| DIS Links: Profile News Message Board | |
| Charts:- Daily , Weekly | |
| Add DIS to Watchlist: View: Get DIS Trend Analysis ➞ | |
 | CMCSA Comcast Corporation |
| Sector: Services & Goods | |
| SubSector: Entertainment - Diversified | |
| MarketCap: 164849 Millions | |
| Recent Price: 40.24 Smart Investing & Trading Score: 32 | |
| Day Percent Change: 1.56% Day Change: 0.62 | |
| Week Change: 2.21% Year-to-date Change: -8.2% | |
| CMCSA Links: Profile News Message Board | |
| Charts:- Daily , Weekly | |
| Add CMCSA to Watchlist: View: Get CMCSA Trend Analysis ➞ | |
 | COST Costco Wholesale Corporation |
| Sector: Services & Goods | |
| SubSector: Discount, Variety Stores | |
| MarketCap: 136355 Millions | |
| Recent Price: 709.51 Smart Investing & Trading Score: 33 | |
| Day Percent Change: -0.24% Day Change: -1.74 | |
| Week Change: -2.98% Year-to-date Change: 7.5% | |
| COST Links: Profile News Message Board | |
| Charts:- Daily , Weekly | |
| Add COST to Watchlist: View: Get COST Trend Analysis ➞ | |
 | MCD McDonald s Corporation |
| Sector: Services & Goods | |
| SubSector: Restaurants | |
| MarketCap: 122481 Millions | |
| Recent Price: 271.99 Smart Investing & Trading Score: 49 | |
| Day Percent Change: 0.37% Day Change: 1.01 | |
| Week Change: 1.72% Year-to-date Change: -8.3% | |
| MCD Links: Profile News Message Board | |
| Charts:- Daily , Weekly | |
| Add MCD to Watchlist: View: Get MCD Trend Analysis ➞ | |
 | SBUX Starbucks Corporation |
| Sector: Services & Goods | |
| SubSector: Specialty Eateries | |
| MarketCap: 74909.7 Millions | |
| Recent Price: 87.61 Smart Investing & Trading Score: 49 | |
| Day Percent Change: 0.53% Day Change: 0.46 | |
| Week Change: 3.17% Year-to-date Change: -8.8% | |
| SBUX Links: Profile News Message Board | |
| Charts:- Daily , Weekly | |
| Add SBUX to Watchlist: View: Get SBUX Trend Analysis ➞ | |
 | LOW Lowe s Companies, Inc. |
| Sector: Services & Goods | |
| SubSector: Home Improvement Stores | |
| MarketCap: 56084.2 Millions | |
| Recent Price: 230.24 Smart Investing & Trading Score: 58 | |
| Day Percent Change: 0.63% Day Change: 1.45 | |
| Week Change: -0.78% Year-to-date Change: 3.5% | |
| LOW Links: Profile News Message Board | |
| Charts:- Daily , Weekly | |
| Add LOW to Watchlist: View: Get LOW Trend Analysis ➞ | |
 | TGT Target Corporation |
| Sector: Services & Goods | |
| SubSector: Discount, Variety Stores | |
| MarketCap: 55980.6 Millions | |
| Recent Price: 168.30 Smart Investing & Trading Score: 68 | |
| Day Percent Change: 1.03% Day Change: 1.72 | |
| Week Change: 1.31% Year-to-date Change: 18.2% | |
| TGT Links: Profile News Message Board | |
| Charts:- Daily , Weekly | |
| Add TGT to Watchlist: View: Get TGT Trend Analysis ➞ | |
 | SPGI S&P Global Inc. |
| Sector: Services & Goods | |
| SubSector: Business Services | |
| MarketCap: 55247.9 Millions | |
| Recent Price: 412.56 Smart Investing & Trading Score: 25 | |
| Day Percent Change: -0.20% Day Change: -0.81 | |
| Week Change: -1.26% Year-to-date Change: -6.4% | |
| SPGI Links: Profile News Message Board | |
| Charts:- Daily , Weekly | |
| Add SPGI to Watchlist: View: Get SPGI Trend Analysis ➞ | |
 | BKNG Booking Holdings Inc. |
| Sector: Services & Goods | |
| SubSector: Business Services | |
| MarketCap: 54467.9 Millions | |
| Recent Price: 3414.82 Smart Investing & Trading Score: 0 | |
| Day Percent Change: -0.45% Day Change: -15.32 | |
| Week Change: -3.31% Year-to-date Change: -3.7% | |
| BKNG Links: Profile News Message Board | |
| Charts:- Daily , Weekly | |
| Add BKNG to Watchlist: View: Get BKNG Trend Analysis ➞ | |
 | TJX The TJX Companies, Inc. |
| Sector: Services & Goods | |
| SubSector: Department Stores | |
| MarketCap: 50656.2 Millions | |
| Recent Price: 93.36 Smart Investing & Trading Score: 18 | |
| Day Percent Change: 0.76% Day Change: 0.70 | |
| Week Change: -1.12% Year-to-date Change: -0.5% | |
| TJX Links: Profile News Message Board | |
| Charts:- Daily , Weekly | |
| Add TJX to Watchlist: View: Get TJX Trend Analysis ➞ | |
 | WBA Walgreens Boots Alliance, Inc. |
| Sector: Services & Goods | |
| SubSector: Drug Stores | |
| MarketCap: 46184.1 Millions | |
| Recent Price: 18.24 Smart Investing & Trading Score: 42 | |
| Day Percent Change: 3.70% Day Change: 0.65 | |
| Week Change: 2.18% Year-to-date Change: -30.1% | |
| WBA Links: Profile News Message Board | |
| Charts:- Daily , Weekly | |
| Add WBA to Watchlist: View: Get WBA Trend Analysis ➞ | |
 | DG Dollar General Corporation |
| Sector: Services & Goods | |
| SubSector: Discount, Variety Stores | |
| MarketCap: 39611.9 Millions | |
| Recent Price: 144.82 Smart Investing & Trading Score: 61 | |
| Day Percent Change: -0.59% Day Change: -0.86 | |
| Week Change: -2% Year-to-date Change: 6.5% | |
| DG Links: Profile News Message Board | |
| Charts:- Daily , Weekly | |
| Add DG to Watchlist: View: Get DG Trend Analysis ➞ | |
 | GPN Global Payments Inc. |
| Sector: Services & Goods | |
| SubSector: Business Services | |
| MarketCap: 39068.8 Millions | |
| Recent Price: 122.10 Smart Investing & Trading Score: 10 | |
| Day Percent Change: -0.07% Day Change: -0.08 | |
| Week Change: -1.33% Year-to-date Change: -3.9% | |
| GPN Links: Profile News Message Board | |
| Charts:- Daily , Weekly | |
| Add GPN to Watchlist: View: Get GPN Trend Analysis ➞ | |
 | LVS Las Vegas Sands Corp. |
| Sector: Services & Goods | |
| SubSector: Resorts & Casinos | |
| MarketCap: 36431.6 Millions | |
| Recent Price: 45.46 Smart Investing & Trading Score: 0 | |
| Day Percent Change: -0.92% Day Change: -0.42 | |
| Week Change: -9.86% Year-to-date Change: -7.6% | |
| LVS Links: Profile News Message Board | |
| Charts:- Daily , Weekly | |
| Add LVS to Watchlist: View: Get LVS Trend Analysis ➞ | |
 | MCO Moody s Corporation |
| Sector: Services & Goods | |
| SubSector: Business Services | |
| MarketCap: 35998.5 Millions | |
| Recent Price: 374.67 Smart Investing & Trading Score: 25 | |
| Day Percent Change: 0.02% Day Change: 0.07 | |
| Week Change: -0.66% Year-to-date Change: -4.1% | |
| MCO Links: Profile News Message Board | |
| Charts:- Daily , Weekly | |
| Add MCO to Watchlist: View: Get MCO Trend Analysis ➞ | |
 | KR The Kroger Co. |
| Sector: Services & Goods | |
| SubSector: Grocery Stores | |
| MarketCap: 26718.5 Millions | |
| Recent Price: 56.57 Smart Investing & Trading Score: 68 | |
| Day Percent Change: 1.80% Day Change: 1.00 | |
| Week Change: 2.48% Year-to-date Change: 23.8% | |
| KR Links: Profile News Message Board | |
| Charts:- Daily , Weekly | |
| Add KR to Watchlist: View: Get KR Trend Analysis ➞ | |
 | MAR Marriott International, Inc. |
| Sector: Services & Goods | |
| SubSector: Lodging | |
| MarketCap: 25831.6 Millions | |
| Recent Price: 236.00 Smart Investing & Trading Score: 0 | |
| Day Percent Change: -0.13% Day Change: -0.30 | |
| Week Change: -6% Year-to-date Change: 4.7% | |
| MAR Links: Profile News Message Board | |
| Charts:- Daily , Weekly | |
| Add MAR to Watchlist: View: Get MAR Trend Analysis ➞ | |
 | ROST Ross Stores, Inc. |
| Sector: Services & Goods | |
| SubSector: Apparel Stores | |
| MarketCap: 24938.8 Millions | |
| Recent Price: 133.34 Smart Investing & Trading Score: 18 | |
| Day Percent Change: 1.17% Day Change: 1.54 | |
| Week Change: -1.95% Year-to-date Change: -3.7% | |
| ROST Links: Profile News Message Board | |
| Charts:- Daily , Weekly | |
| Add ROST to Watchlist: View: Get ROST Trend Analysis ➞ | |
 | FOX Twenty-First Century Fox, Inc. |
| Sector: Services & Goods | |
| SubSector: Entertainment - Diversified | |
| MarketCap: 24211.2 Millions | |
| Recent Price: 28.87 Smart Investing & Trading Score: 74 | |
| Day Percent Change: 2.05% Day Change: 0.58 | |
| Week Change: 2.23% Year-to-date Change: 4.4% | |
| FOX Links: Profile News Message Board | |
| Charts:- Daily , Weekly | |
| Add FOX to Watchlist: View: Get FOX Trend Analysis ➞ | |
 | MCK McKesson Corporation |
| Sector: Services & Goods | |
| SubSector: Drugs Wholesale | |
| MarketCap: 24096.7 Millions | |
| Recent Price: 524.83 Smart Investing & Trading Score: 44 | |
| Day Percent Change: 1.16% Day Change: 6.02 | |
| Week Change: 0.35% Year-to-date Change: 13.4% | |
| MCK Links: Profile News Message Board | |
| Charts:- Daily , Weekly | |
| Add MCK to Watchlist: View: Get MCK Trend Analysis ➞ | |
 | EBAY eBay Inc. |
| Sector: Services & Goods | |
| SubSector: Specialty Retail, Other | |
| MarketCap: 23152.3 Millions | |
| Recent Price: 50.39 Smart Investing & Trading Score: 61 | |
| Day Percent Change: 0.88% Day Change: 0.44 | |
| Week Change: -1.79% Year-to-date Change: 15.5% | |
| EBAY Links: Profile News Message Board | |
| Charts:- Daily , Weekly | |
| Add EBAY to Watchlist: View: Get EBAY Trend Analysis ➞ | |
 | ORLY O Reilly Automotive, Inc. |
| Sector: Services & Goods | |
| SubSector: Auto Parts Stores | |
| MarketCap: 22391.5 Millions | |
| Recent Price: 1090.94 Smart Investing & Trading Score: 44 | |
| Day Percent Change: -0.92% Day Change: -10.12 | |
| Week Change: 1.34% Year-to-date Change: 14.8% | |
| ORLY Links: Profile News Message Board | |
| Charts:- Daily , Weekly | |
| Add ORLY to Watchlist: View: Get ORLY Trend Analysis ➞ | |
| For tabular summary view of above stock list: Summary View ➞ 0 - 25 , 25 - 50 , 50 - 75 | ||
| Click To Change The Sort Order: By Market Cap or Company Size Performance: Year-to-date, Week and Day | |
| Select Chart Type: | ||
|
Best Stocks Today 12Stocks.com |
© 2024 12Stocks.com Terms & Conditions Privacy Contact Us
All Information Provided Only For Education And Not To Be Used For Investing or Trading. See Terms & Conditions


One More Thing ... Get Best Stocks Delivered Daily!
Never Ever Miss A Move With Our Top Ten Stocks Lists
Find Best Stocks In Any Market - Bull or Bear Market
Take A Peek At Our Top Ten Stocks Lists: Daily, Weekly, Year-to-Date & Top Trends
Find Best Stocks In Any Market - Bull or Bear Market
Take A Peek At Our Top Ten Stocks Lists: Daily, Weekly, Year-to-Date & Top Trends
S&P 500 Stocks With Best Up Trends [0-bearish to 100-bullish]: Kinder Morgan[100], Entergy [100], Bunge [100], Philip Morris[100], Wells Fargo[100], Dominion [100], Duke [100], Tyson Foods[100], Lockheed Martin[100], Genuine Parts[100], Consolidated Edison[100]
Best S&P 500 Stocks Year-to-Date:
Constellation [54.47%], NVIDIA [53.87%], Meta Platforms[38.28%], NRG [35.34%], Progressive [34.79%], Marathon [32.37%], Targa Resources[29.99%], Diamondback [29.44%], Western Digital[26.12%], Valero [26.07%], Eaton [25.83%] Best S&P 500 Stocks This Week:
United Airlines[22.92%], UnitedHealth [14.1%], Globe Life[12.95%], Genuine Parts[11.7%], ProShares UltraPro[9.95%], American Airlines[7.3%], Wells Fargo[6.87%], Southwest Airlines[6.68%], M&T Bank[6.55%], General Mills[6.37%], Centene [6.25%] Best S&P 500 Stocks Daily:
American Express[6.23%], Fifth Third[5.93%], Walgreens Boots[3.70%], Kinder Morgan[3.46%], Bank of America[3.35%], Citizens Financial[3.31%], J. M.[3.29%], Truist Financial[3.05%], PNC Financial[2.98%], M&T Bank[2.93%], Entergy [2.91%]