
 Login Sign Up


| |||||
 |  | ||||

| 12Stocks.com Market Intelligence |
Best Financial Stocks
| In a hurry? Financial Stocks Lists: Performance Trends Table, Stock Charts
Sort Financial stocks: Daily, Weekly, Year-to-Date, Market Cap & Trends. Filter Financial stocks list by size:All Financial Large Mid-Range Small & MicroCap |
| 12Stocks.com Financial Stocks Performances & Trends Daily | |||||||||
|
|  The overall Smart Investing & Trading Score is 58 (0-bearish to 100-bullish) which puts Financial sector in short term neutral trend. The Smart Investing & Trading Score from previous trading session is 63 and hence a deterioration of trend.
| ||||||||
Here are the Smart Investing & Trading Scores of the most requested Financial stocks at 12Stocks.com (click stock name for detailed review):
|


| 12Stocks.com: Investing in Financial sector with Stocks | |
|
The following table helps investors and traders sort through current performance and trends (as measured by Smart Investing & Trading Score) of various
stocks in the Financial sector. Quick View: Move mouse or cursor over stock symbol (ticker) to view short-term Technical chart and over stock name to view long term chart. Click on  to add stock symbol to your watchlist and to add stock symbol to your watchlist and  to view watchlist. Click on any ticker or stock name for detailed market intelligence report for that stock. to view watchlist. Click on any ticker or stock name for detailed market intelligence report for that stock. |
12Stocks.com Performance of Stocks in Financial Sector
| Ticker | Stock Name | Watchlist | Category | Recent Price | Smart Investing & Trading Score | Change % | YTD Change% |
| MBNKP | Medallion Bank |   | Banks Regional | 24.50 | 59 | -1.23 | 5.56% |
| PVBC | Provident Bancorp | | Banks | 8.77 | 45 | -1.24 | -12.91% |
| CMA | Comerica | | Banks | 51.42 | 18 | -1.25 | -7.87% |
| BCS | Barclays | | Foreign Banks | 10.29 | 88 | -1.25 | 30.58% |
| QCRH | QCR | | Regional - Southwest Banks | 55.50 | 13 | -1.26 | -4.95% |
| CWH | Camping World | | REIT - Office | 21.18 | 17 | -1.26 | -19.35% |
| RNST | Renasant | | Banks | 29.47 | 42 | -1.27 | -12.50% |
| AMSF | Amerisafe | | Insurance | 44.98 | 0 | -1.27 | -3.85% |
| OSBC | Old Second | | Regional Banks | 13.85 | 68 | -1.28 | -10.30% |
| FFBC | First | | Regional Banks | 22.28 | 88 | -1.28 | -6.19% |
| EFC | Ellington | | Mortgage | 11.56 | 50 | -1.28 | -9.05% |
| TSI | TCW Strategic | | Closed-End Fund - Debt | 4.54 | 10 | -1.30 | -1.09% |
| FNB | F.N.B | | Regional Banks | 13.56 | 86 | -1.31 | -1.53% |
| UCBI | United Community | | Regional Banks | 25.64 | 42 | -1.31 | -12.37% |
| HOMB | Home Bancshares | | Banks | 24.10 | 68 | -1.31 | -4.86% |
| GSBC | Great Southern | | Regional - Southwest Banks | 52.01 | 68 | -1.33 | -12.37% |
| VBTX | Veritex | | Regional - Southwest Banks | 19.90 | 42 | -1.34 | -14.48% |
| CITE | Cartica Acquisition | | SPAC | 11.00 | 86 | -1.35 | 0.82% |
| SAN | Banco Santander | | Foreign Banks | 5.04 | 63 | -1.37 | 21.74% |
| UNIT | Uniti | | REIT - Industrial | 5.70 | 85 | -1.38 | -1.38% |
| AON | Aon | | Insurance | 281.04 | 0 | -1.40 | -3.43% |
| CTBI | Community Trust | | Regional Banks | 42.03 | 68 | -1.43 | -4.17% |
| IVZ | Invesco | | Asset Mgmt | 14.46 | 25 | -1.43 | -18.95% |
| BWFG | Bankwell | | Regional Banks | 23.50 | 17 | -1.43 | -22.13% |
| TREE | LendingTree | | Mortgage | 37.35 | 55 | -1.45 | 23.19% |
| For chart view version of above stock list: Chart View ➞ 0 - 25 , 25 - 50 , 50 - 75 , 75 - 100 , 100 - 125 , 125 - 150 , 150 - 175 , 175 - 200 , 200 - 225 , 225 - 250 , 250 - 275 , 275 - 300 , 300 - 325 , 325 - 350 , 350 - 375 , 375 - 400 , 400 - 425 , 425 - 450 , 450 - 475 , 475 - 500 , 500 - 525 , 525 - 550 , 550 - 575 , 575 - 600 , 600 - 625 , 625 - 650 , 650 - 675 , 675 - 700 , 700 - 725 , 725 - 750 , 750 - 775 , 775 - 800 , 800 - 825 , 825 - 850 , 850 - 875 , 875 - 900 , 900 - 925 , 925 - 950 , 950 - 975 , 975 - 1000 , 1000 - 1025 , 1025 - 1050 , 1050 - 1075 , 1075 - 1100 , 1100 - 1125 , 1125 - 1150 , 1150 - 1175 , 1175 - 1200 , 1200 - 1225 , 1225 - 1250 | ||
 | Click To Change The Sort Order: By Market Cap or Company Size Performance: Year-to-date, Week and Day |  |
|
Get the most comprehensive stock market coverage daily at 12Stocks.com ➞ Best Stocks Today ➞ Best Stocks Weekly ➞ Best Stocks Year-to-Date ➞ Best Stocks Trends ➞  Best Stocks Today 12Stocks.com Best Nasdaq Stocks ➞ Best S&P 500 Stocks ➞ Best Tech Stocks ➞ Best Biotech Stocks ➞ |
| Detailed Overview of Financial Stocks |
| Financial Technical Overview, Leaders & Laggards, Top Financial ETF Funds & Detailed Financial Stocks List, Charts, Trends & More |
| Financial Sector: Technical Analysis, Trends & YTD Performance | |
| Financial sector is composed of stocks
from banks, brokers, insurance, REITs
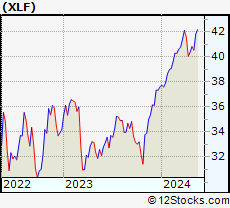
and services subsectors. Financial sector, as represented by XLF, an exchange-traded fund [ETF] that holds basket of Financial stocks (e.g, Bank of America, Goldman Sachs) is up by 8.4% and is currently outperforming the overall market by 1.84% year-to-date. Below is a quick view of Technical charts and trends: |
|
 XLF Weekly Chart |
|
| Long Term Trend: Very Good | |
| Medium Term Trend: Good | |
 XLF Daily Chart |
|
| Short Term Trend: Deteriorating | |
| Overall Trend Score: 58 | |
| YTD Performance: 8.4% | |
| **Trend Scores & Views Are Only For Educational Purposes And Not For Investing | |
| 12Stocks.com: Top Performing Financial Sector Stocks | ||||||||||||||||||||||||||||||||||||||||||||||||
 The top performing Financial sector stocks year to date are
Now, more recently, over last week, the top performing Financial sector stocks on the move are


|
||||||||||||||||||||||||||||||||||||||||||||||||
| 12Stocks.com: Investing in Financial Sector using Exchange Traded Funds | |
|
The following table shows list of key exchange traded funds (ETF) that
help investors track Financial Index. For detailed view, check out our ETF Funds section of our website. Quick View: Move mouse or cursor over ETF symbol (ticker) to view short-term Technical chart and over ETF name to view long term chart. Click on ticker or stock name for detailed view. Click on to add stock symbol to your watchlist and to view watchlist. |
12Stocks.com List of ETFs that track Financial Index
| Ticker | ETF Name | Watchlist | Recent Price | Smart Investing & Trading Score | Change % | Week % | Year-to-date % |
| XLF | Financial | | 40.76 | 58 | -0.15 | -0.15 | 8.4% |
| IAI | Broker-Dealers & Secs | | 112.90 | 75 | -0.10 | -0.1 | 4.03% |
| IYF | Financials | | 92.16 | 76 | -0.01 | -0.01 | 7.9% |
| IYG | Financial Services | | 64.34 | 76 | -0.42 | -0.42 | 7.71% |
| KRE | Regional Banking | | 47.77 | 47 | -0.87 | -0.87 | -8.89% |
| IXG | Global Financials | | 84.35 | 83 | 0.19 | 0.19 | 7.34% |
| VFH | Financials | | 98.74 | 76 | -0.19 | -0.19 | 7.02% |
| KBE | Bank | | 45.10 | 55 | -0.51 | -0.51 | -2% |
| FAS | Financial Bull 3X | | 100.33 | 58 | -0.30 | -0.3 | 21.39% |
| FAZ | Financial Bear 3X | | 10.93 | 42 | 0.64 | 0.64 | -20.04% |
| UYG | Financials | | 63.42 | 53 | -0.36 | -0.36 | 14.89% |
| IAT | Regional Banks | | 41.57 | 73 | -0.36 | -0.36 | -0.65% |
| KIE | Insurance | | 48.79 | 58 | 0.54 | 0.54 | 7.89% |
| PSCF | SmallCap Financials | | 46.33 | 47 | -0.06 | -0.06 | -5.79% |
| EUFN | Europe Financials | | 22.50 | 83 | 0.18 | 0.18 | 7.35% |
| PGF | Financial Preferred | | 14.64 | 39 | 0.48 | 0.48 | 0.41% |
| 12Stocks.com: Charts, Trends, Fundamental Data and Performances of Financial Stocks | |
|
We now take in-depth look at all Financial stocks including charts, multi-period performances and overall trends (as measured by Smart Investing & Trading Score). One can sort Financial stocks (click link to choose) by Daily, Weekly and by Year-to-Date performances. Also, one can sort by size of the company or by market capitalization. |
| Select Your Default Chart Type: | |||||
| |||||
| Click on stock symbol or name for detailed view. Click on to add stock symbol to your watchlist and to view watchlist. Quick View: Move mouse or cursor over "Daily" to quickly view daily Technical stock chart and over "Weekly" to view weekly Technical stock chart. | |||||

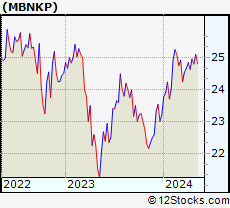 | MBNKP Medallion Bank |
| Sector: Financials | |
| SubSector: Banks Regional | |
| MarketCap: 60157 Millions | |
| Recent Price: 24.50 Smart Investing & Trading Score: 59 | |
| Day Percent Change: -1.23% Day Change: -0.30 | |
| Week Change: -1.23% Year-to-date Change: 5.6% | |
| MBNKP Links: Profile News Message Board | |
| Charts:- Daily , Weekly | |
| Add MBNKP to Watchlist: View: Get Complete MBNKP Trend Analysis ➞ | |
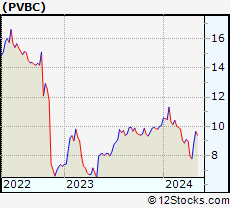 | PVBC Provident Bancorp, Inc. |
| Sector: Financials | |
| SubSector: Money Center Banks | |
| MarketCap: 168.599 Millions | |
| Recent Price: 8.77 Smart Investing & Trading Score: 45 | |
| Day Percent Change: -1.24% Day Change: -0.11 | |
| Week Change: -1.24% Year-to-date Change: -12.9% | |
| PVBC Links: Profile News Message Board | |
| Charts:- Daily , Weekly | |
| Add PVBC to Watchlist: View: Get Complete PVBC Trend Analysis ➞ | |
 | CMA Comerica Incorporated |
| Sector: Financials | |
| SubSector: Money Center Banks | |
| MarketCap: 4449.49 Millions | |
| Recent Price: 51.42 Smart Investing & Trading Score: 18 | |
| Day Percent Change: -1.25% Day Change: -0.65 | |
| Week Change: -1.25% Year-to-date Change: -7.9% | |
| CMA Links: Profile News Message Board | |
| Charts:- Daily , Weekly | |
| Add CMA to Watchlist: View: Get Complete CMA Trend Analysis ➞ | |
 | BCS Barclays PLC |
| Sector: Financials | |
| SubSector: Foreign Money Center Banks | |
| MarketCap: 21013.4 Millions | |
| Recent Price: 10.29 Smart Investing & Trading Score: 88 | |
| Day Percent Change: -1.25% Day Change: -0.13 | |
| Week Change: -1.25% Year-to-date Change: 30.6% | |
| BCS Links: Profile News Message Board | |
| Charts:- Daily , Weekly | |
| Add BCS to Watchlist: View: Get Complete BCS Trend Analysis ➞ | |
 | QCRH QCR Holdings, Inc. |
| Sector: Financials | |
| SubSector: Regional - Southwest Banks | |
| MarketCap: 465.765 Millions | |
| Recent Price: 55.50 Smart Investing & Trading Score: 13 | |
| Day Percent Change: -1.26% Day Change: -0.71 | |
| Week Change: -1.26% Year-to-date Change: -5.0% | |
| QCRH Links: Profile News Message Board | |
| Charts:- Daily , Weekly | |
| Add QCRH to Watchlist: View: Get Complete QCRH Trend Analysis ➞ | |
 | CWH Camping World Holdings, Inc. |
| Sector: Financials | |
| SubSector: REIT - Office | |
| MarketCap: 473.566 Millions | |
| Recent Price: 21.18 Smart Investing & Trading Score: 17 | |
| Day Percent Change: -1.26% Day Change: -0.27 | |
| Week Change: -1.26% Year-to-date Change: -19.4% | |
| CWH Links: Profile News Message Board | |
| Charts:- Daily , Weekly | |
| Add CWH to Watchlist: View: Get Complete CWH Trend Analysis ➞ | |
 | RNST Renasant Corporation |
| Sector: Financials | |
| SubSector: Money Center Banks | |
| MarketCap: 1279.39 Millions | |
| Recent Price: 29.47 Smart Investing & Trading Score: 42 | |
| Day Percent Change: -1.27% Day Change: -0.38 | |
| Week Change: -1.27% Year-to-date Change: -12.5% | |
| RNST Links: Profile News Message Board | |
| Charts:- Daily , Weekly | |
| Add RNST to Watchlist: View: Get Complete RNST Trend Analysis ➞ | |
 | AMSF Amerisafe, Inc. |
| Sector: Financials | |
| SubSector: Property & Casualty Insurance | |
| MarketCap: 1159.32 Millions | |
| Recent Price: 44.98 Smart Investing & Trading Score: 0 | |
| Day Percent Change: -1.27% Day Change: -0.58 | |
| Week Change: -1.27% Year-to-date Change: -3.9% | |
| AMSF Links: Profile News Message Board | |
| Charts:- Daily , Weekly | |
| Add AMSF to Watchlist: View: Get Complete AMSF Trend Analysis ➞ | |
 | OSBC Old Second Bancorp, Inc. |
| Sector: Financials | |
| SubSector: Regional - Midwest Banks | |
| MarketCap: 237.17 Millions | |
| Recent Price: 13.85 Smart Investing & Trading Score: 68 | |
| Day Percent Change: -1.28% Day Change: -0.18 | |
| Week Change: -1.28% Year-to-date Change: -10.3% | |
| OSBC Links: Profile News Message Board | |
| Charts:- Daily , Weekly | |
| Add OSBC to Watchlist: View: Get Complete OSBC Trend Analysis ➞ | |
 | FFBC First Financial Bancorp. |
| Sector: Financials | |
| SubSector: Regional - Midwest Banks | |
| MarketCap: 1363.7 Millions | |
| Recent Price: 22.28 Smart Investing & Trading Score: 88 | |
| Day Percent Change: -1.28% Day Change: -0.29 | |
| Week Change: -1.28% Year-to-date Change: -6.2% | |
| FFBC Links: Profile News Message Board | |
| Charts:- Daily , Weekly | |
| Add FFBC to Watchlist: View: Get Complete FFBC Trend Analysis ➞ | |
 | EFC Ellington Financial Inc. |
| Sector: Financials | |
| SubSector: Mortgage Investment | |
| MarketCap: 380.239 Millions | |
| Recent Price: 11.56 Smart Investing & Trading Score: 50 | |
| Day Percent Change: -1.28% Day Change: -0.15 | |
| Week Change: -1.28% Year-to-date Change: -9.1% | |
| EFC Links: Profile News Message Board | |
| Charts:- Daily , Weekly | |
| Add EFC to Watchlist: View: Get Complete EFC Trend Analysis ➞ | |
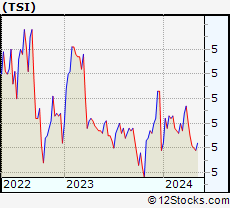 | TSI TCW Strategic Income Fund, Inc. |
| Sector: Financials | |
| SubSector: Closed-End Fund - Debt | |
| MarketCap: 205.507 Millions | |
| Recent Price: 4.54 Smart Investing & Trading Score: 10 | |
| Day Percent Change: -1.30% Day Change: -0.06 | |
| Week Change: -1.3% Year-to-date Change: -1.1% | |
| TSI Links: Profile News Message Board | |
| Charts:- Daily , Weekly | |
| Add TSI to Watchlist: View: Get Complete TSI Trend Analysis ➞ | |
 | FNB F.N.B. Corporation |
| Sector: Financials | |
| SubSector: Regional - Southeast Banks | |
| MarketCap: 2445.55 Millions | |
| Recent Price: 13.56 Smart Investing & Trading Score: 86 | |
| Day Percent Change: -1.31% Day Change: -0.18 | |
| Week Change: -1.31% Year-to-date Change: -1.5% | |
| FNB Links: Profile News Message Board | |
| Charts:- Daily , Weekly | |
| Add FNB to Watchlist: View: Get Complete FNB Trend Analysis ➞ | |
 | UCBI United Community Banks, Inc. |
| Sector: Financials | |
| SubSector: Regional - Mid-Atlantic Banks | |
| MarketCap: 1593.99 Millions | |
| Recent Price: 25.64 Smart Investing & Trading Score: 42 | |
| Day Percent Change: -1.31% Day Change: -0.34 | |
| Week Change: -1.31% Year-to-date Change: -12.4% | |
| UCBI Links: Profile News Message Board | |
| Charts:- Daily , Weekly | |
| Add UCBI to Watchlist: View: Get Complete UCBI Trend Analysis ➞ | |
 | HOMB Home Bancshares, Inc. (Conway, AR) |
| Sector: Financials | |
| SubSector: Money Center Banks | |
| MarketCap: 2090.49 Millions | |
| Recent Price: 24.10 Smart Investing & Trading Score: 68 | |
| Day Percent Change: -1.31% Day Change: -0.32 | |
| Week Change: -1.31% Year-to-date Change: -4.9% | |
| HOMB Links: Profile News Message Board | |
| Charts:- Daily , Weekly | |
| Add HOMB to Watchlist: View: Get Complete HOMB Trend Analysis ➞ | |
 | GSBC Great Southern Bancorp, Inc. |
| Sector: Financials | |
| SubSector: Regional - Southwest Banks | |
| MarketCap: 524.765 Millions | |
| Recent Price: 52.01 Smart Investing & Trading Score: 68 | |
| Day Percent Change: -1.33% Day Change: -0.70 | |
| Week Change: -1.33% Year-to-date Change: -12.4% | |
| GSBC Links: Profile News Message Board | |
| Charts:- Daily , Weekly | |
| Add GSBC to Watchlist: View: Get Complete GSBC Trend Analysis ➞ | |
 | VBTX Veritex Holdings, Inc. |
| Sector: Financials | |
| SubSector: Regional - Southwest Banks | |
| MarketCap: 625.165 Millions | |
| Recent Price: 19.90 Smart Investing & Trading Score: 42 | |
| Day Percent Change: -1.34% Day Change: -0.27 | |
| Week Change: -1.34% Year-to-date Change: -14.5% | |
| VBTX Links: Profile News Message Board | |
| Charts:- Daily , Weekly | |
| Add VBTX to Watchlist: View: Get Complete VBTX Trend Analysis ➞ | |
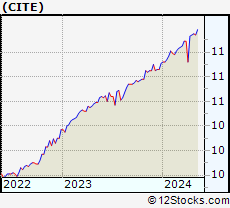 | CITE Cartica Acquisition Corp |
| Sector: Financials | |
| SubSector: SPAC | |
| MarketCap: 308 Millions | |
| Recent Price: 11.00 Smart Investing & Trading Score: 86 | |
| Day Percent Change: -1.35% Day Change: -0.15 | |
| Week Change: -1.35% Year-to-date Change: 0.8% | |
| CITE Links: Profile News Message Board | |
| Charts:- Daily , Weekly | |
| Add CITE to Watchlist: View: Get Complete CITE Trend Analysis ➞ | |
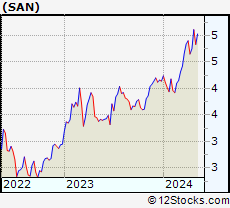 | SAN Banco Santander, S.A. |
| Sector: Financials | |
| SubSector: Foreign Money Center Banks | |
| MarketCap: 44592.5 Millions | |
| Recent Price: 5.04 Smart Investing & Trading Score: 63 | |
| Day Percent Change: -1.37% Day Change: -0.07 | |
| Week Change: -1.37% Year-to-date Change: 21.7% | |
| SAN Links: Profile News Message Board | |
| Charts:- Daily , Weekly | |
| Add SAN to Watchlist: View: Get Complete SAN Trend Analysis ➞ | |
 | UNIT Uniti Group Inc. |
| Sector: Financials | |
| SubSector: REIT - Industrial | |
| MarketCap: 1363.09 Millions | |
| Recent Price: 5.70 Smart Investing & Trading Score: 85 | |
| Day Percent Change: -1.38% Day Change: -0.08 | |
| Week Change: -1.38% Year-to-date Change: -1.4% | |
| UNIT Links: Profile News Message Board | |
| Charts:- Daily , Weekly | |
| Add UNIT to Watchlist: View: Get Complete UNIT Trend Analysis ➞ | |
 | AON Aon plc |
| Sector: Financials | |
| SubSector: Insurance Brokers | |
| MarketCap: 36870.1 Millions | |
| Recent Price: 281.04 Smart Investing & Trading Score: 0 | |
| Day Percent Change: -1.40% Day Change: -3.99 | |
| Week Change: -1.4% Year-to-date Change: -3.4% | |
| AON Links: Profile News Message Board | |
| Charts:- Daily , Weekly | |
| Add AON to Watchlist: View: Get Complete AON Trend Analysis ➞ | |
 | CTBI Community Trust Bancorp, Inc. |
| Sector: Financials | |
| SubSector: Regional - Southeast Banks | |
| MarketCap: 608.435 Millions | |
| Recent Price: 42.03 Smart Investing & Trading Score: 68 | |
| Day Percent Change: -1.43% Day Change: -0.61 | |
| Week Change: -1.43% Year-to-date Change: -4.2% | |
| CTBI Links: Profile News Message Board | |
| Charts:- Daily , Weekly | |
| Add CTBI to Watchlist: View: Get Complete CTBI Trend Analysis ➞ | |
 | IVZ Invesco Ltd. |
| Sector: Financials | |
| SubSector: Asset Management | |
| MarketCap: 4578.23 Millions | |
| Recent Price: 14.46 Smart Investing & Trading Score: 25 | |
| Day Percent Change: -1.43% Day Change: -0.21 | |
| Week Change: -1.43% Year-to-date Change: -19.0% | |
| IVZ Links: Profile News Message Board | |
| Charts:- Daily , Weekly | |
| Add IVZ to Watchlist: View: Get Complete IVZ Trend Analysis ➞ | |
 | BWFG Bankwell Financial Group, Inc. |
| Sector: Financials | |
| SubSector: Regional - Northeast Banks | |
| MarketCap: 142.899 Millions | |
| Recent Price: 23.50 Smart Investing & Trading Score: 17 | |
| Day Percent Change: -1.43% Day Change: -0.34 | |
| Week Change: -1.43% Year-to-date Change: -22.1% | |
| BWFG Links: Profile News Message Board | |
| Charts:- Daily , Weekly | |
| Add BWFG to Watchlist: View: Get Complete BWFG Trend Analysis ➞ | |
 | TREE LendingTree, Inc. |
| Sector: Financials | |
| SubSector: Mortgage Investment | |
| MarketCap: 2745.99 Millions | |
| Recent Price: 37.35 Smart Investing & Trading Score: 55 | |
| Day Percent Change: -1.45% Day Change: -0.55 | |
| Week Change: -1.45% Year-to-date Change: 23.2% | |
| TREE Links: Profile News Message Board | |
| Charts:- Daily , Weekly | |
| Add TREE to Watchlist: View: Get Complete TREE Trend Analysis ➞ | |
| For tabular summary view of above stock list: Summary View ➞ 0 - 25 , 25 - 50 , 50 - 75 , 75 - 100 , 100 - 125 , 125 - 150 , 150 - 175 , 175 - 200 , 200 - 225 , 225 - 250 , 250 - 275 , 275 - 300 , 300 - 325 , 325 - 350 , 350 - 375 , 375 - 400 , 400 - 425 , 425 - 450 , 450 - 475 , 475 - 500 , 500 - 525 , 525 - 550 , 550 - 575 , 575 - 600 , 600 - 625 , 625 - 650 , 650 - 675 , 675 - 700 , 700 - 725 , 725 - 750 , 750 - 775 , 775 - 800 , 800 - 825 , 825 - 850 , 850 - 875 , 875 - 900 , 900 - 925 , 925 - 950 , 950 - 975 , 975 - 1000 , 1000 - 1025 , 1025 - 1050 , 1050 - 1075 , 1075 - 1100 , 1100 - 1125 , 1125 - 1150 , 1150 - 1175 , 1175 - 1200 , 1200 - 1225 , 1225 - 1250 | ||
| Click To Change The Sort Order: By Market Cap or Company Size Performance: Year-to-date, Week and Day | |
| Select Chart Type: | ||
|
Best Stocks Today 12Stocks.com |
© 2024 12Stocks.com Terms & Conditions Privacy Contact Us
All Information Provided Only For Education And Not To Be Used For Investing or Trading. See Terms & Conditions


One More Thing ... Get Best Stocks Delivered Daily!
Never Ever Miss A Move With Our Top Ten Stocks Lists
Find Best Stocks In Any Market - Bull or Bear Market
Take A Peek At Our Top Ten Stocks Lists: Daily, Weekly, Year-to-Date & Top Trends
Find Best Stocks In Any Market - Bull or Bear Market
Take A Peek At Our Top Ten Stocks Lists: Daily, Weekly, Year-to-Date & Top Trends
Financial Stocks With Best Up Trends [0-bearish to 100-bullish]: Heartland [100], Fulton [100], B. Riley[100], ICICI Bank[100], Piedmont Office[100], Douglas Emmett[100], BrasilAgro -[100], LPL [100], Highwoods Properties[100], Stifel [100], iShares ESG[100]
Best Financial Stocks Year-to-Date:
Root [538.11%], Hippo [140.94%], Gladstone Capital[102.15%], Banco Macro[85.19%], B. Riley[83.66%], Grupo Financiero[81.06%], Banco BBVA[72.43%], Yiren Digital[60.9%], EverQuote [59.97%], Fidelis Insurance[58.53%], Heritage Insurance[57.52%] Best Financial Stocks This Week:
Heartland [15.15%], AltC Acquisition[12.57%], Douglas Elliman[10.92%], Fulton [7.55%], NexGen Energy[6.16%], Medical Properties[5.99%], Clipper Realty[5.54%], AlTi Global[4.85%], Citizens [4.81%], B. Riley[4.7%], Peakstone Realty[4.03%] Best Financial Stocks Daily:
Heartland [15.15%], AltC Acquisition[12.57%], Douglas Elliman[10.92%], Fulton [7.55%], NexGen Energy[6.16%], Medical Properties[5.99%], Clipper Realty[5.54%], AlTi Global[4.85%], Citizens [4.81%], B. Riley[4.70%], Peakstone Realty[4.03%]