
 Login Sign Up


| |||||
 |  | ||||

| 12Stocks.com Market Intelligence |
Best Financial Stocks
| In a hurry? Financial Stocks Lists: Performance Trends Table, Stock Charts
Sort Financial stocks: Daily, Weekly, Year-to-Date, Market Cap & Trends. Filter Financial stocks list by size:All Financial Large Mid-Range Small & MicroCap |
| 12Stocks.com Financial Stocks Performances & Trends Daily | |||||||||
|
|  The overall Smart Investing & Trading Score is 63 (0-bearish to 100-bullish) which puts Financial sector in short term neutral to bullish trend. The Smart Investing & Trading Score from previous trading session is 56 and hence an improvement of trend.
| ||||||||
Here are the Smart Investing & Trading Scores of the most requested Financial stocks at 12Stocks.com (click stock name for detailed review):
|


| 12Stocks.com: Investing in Financial sector with Stocks | |
|
The following table helps investors and traders sort through current performance and trends (as measured by Smart Investing & Trading Score) of various
stocks in the Financial sector. Quick View: Move mouse or cursor over stock symbol (ticker) to view short-term Technical chart and over stock name to view long term chart. Click on  to add stock symbol to your watchlist and to add stock symbol to your watchlist and  to view watchlist. Click on any ticker or stock name for detailed market intelligence report for that stock. to view watchlist. Click on any ticker or stock name for detailed market intelligence report for that stock. |
12Stocks.com Performance of Stocks in Financial Sector
| Ticker | Stock Name | Watchlist | Category | Recent Price | Smart Investing & Trading Score | Change % | YTD Change% |
| DB | Deutsche Bank |   | Foreign Banks | 17.77 | 100 | -0.84 | 31.14% |
| CMCT | CIM Commercial | | REIT - Industrial | 3.53 | 63 | -0.84 | -4.34% |
| HBANM | Huntington Bancshares | | Banks - Regional | 21.22 | 0 | -0.84 | -2.88% |
| UFCS | United Fire | | Insurance | 22.23 | 81 | -0.85 | 10.49% |
| SFBS | ServisFirst Bancshares | | Foreign Banks | 60.75 | 60 | -0.85 | -8.82% |
| MBWM | Mercantile Bank | | Regional Banks | 36.17 | 42 | -0.86 | -10.41% |
| WSBC | WesBanco | | Regional Banks | 27.52 | 47 | -0.86 | -12.27% |
| FHB | First Hawaiian | | Regional Banks | 21.88 | 100 | -0.86 | -4.29% |
| CNOB | ConnectOne Bancorp | | Regional Banks | 18.30 | 67 | -0.87 | -20.12% |
| WTM | White Mountains | | Insurance | 1768.38 | 71 | -0.88 | 17.50% |
| CCNE | CNB | | Regional Banks | 19.05 | 35 | -0.88 | -15.67% |
| VBTX | Veritex | | Regional - Southwest Banks | 20.22 | 69 | -0.88 | -13.11% |
| DEMZ | Demz Political | | Exchange Traded Fund | 31.48 | 51 | -0.88 | 6.82% |
| ROIC | Retail Opportunity | | REIT - Retail | 12.25 | 67 | -0.89 | -12.69% |
| ARE | Alexandria Real | | REIT - Office | 116.24 | 27 | -0.90 | -8.31% |
| PPBI | Pacific Premier | | Regional Banks | 21.96 | 37 | -0.90 | -24.56% |
| PB | Prosperity Bancshares | | Regional - Southwest Banks | 63.55 | 100 | -0.90 | -6.17% |
| EDOC | Global X | | Exchange Traded Fund | 8.68 | 35 | -0.91 | -14.57% |
| HCI | HCI | | Insurance | 115.00 | 78 | -0.93 | 31.58% |
| BRKL | Brookline Bancorp | | S&L | 8.34 | 45 | -0.95 | -23.56% |
| EQIX | Equinix . | | REIT - | 731.37 | 0 | -0.95 | -9.19% |
| CNA | CNA | | Insurance | 43.24 | 7 | -0.96 | 2.20% |
| PGR | Progressive | | Insurance | 208.03 | 43 | -0.97 | 30.61% |
| PECO | Phillips Edison | | REIT - Retail | 32.61 | 7 | -0.97 | -11.46% |
| BFS | Saul Centers | | REIT - Retail | 35.53 | 28 | -0.98 | -9.52% |
| For chart view version of above stock list: Chart View ➞ 0 - 25 , 25 - 50 , 50 - 75 , 75 - 100 , 100 - 125 , 125 - 150 , 150 - 175 , 175 - 200 , 200 - 225 , 225 - 250 , 250 - 275 , 275 - 300 , 300 - 325 , 325 - 350 , 350 - 375 , 375 - 400 , 400 - 425 , 425 - 450 , 450 - 475 , 475 - 500 , 500 - 525 , 525 - 550 , 550 - 575 , 575 - 600 , 600 - 625 , 625 - 650 , 650 - 675 , 675 - 700 , 700 - 725 , 725 - 750 , 750 - 775 , 775 - 800 , 800 - 825 , 825 - 850 , 850 - 875 , 875 - 900 , 900 - 925 , 925 - 950 , 950 - 975 , 975 - 1000 , 1000 - 1025 , 1025 - 1050 , 1050 - 1075 , 1075 - 1100 , 1100 - 1125 , 1125 - 1150 , 1150 - 1175 , 1175 - 1200 , 1200 - 1225 , 1225 - 1250 | ||
 | Click To Change The Sort Order: By Market Cap or Company Size Performance: Year-to-date, Week and Day |  |
|
Get the most comprehensive stock market coverage daily at 12Stocks.com ➞ Best Stocks Today ➞ Best Stocks Weekly ➞ Best Stocks Year-to-Date ➞ Best Stocks Trends ➞  Best Stocks Today 12Stocks.com Best Nasdaq Stocks ➞ Best S&P 500 Stocks ➞ Best Tech Stocks ➞ Best Biotech Stocks ➞ |
| Detailed Overview of Financial Stocks |
| Financial Technical Overview, Leaders & Laggards, Top Financial ETF Funds & Detailed Financial Stocks List, Charts, Trends & More |
| Financial Sector: Technical Analysis, Trends & YTD Performance | |
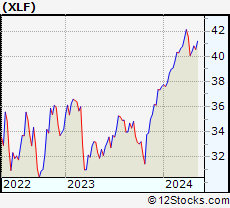
| Financial sector is composed of stocks
from banks, brokers, insurance, REITs
and services subsectors. Financial sector, as represented by XLF, an exchange-traded fund [ETF] that holds basket of Financial stocks (e.g, Bank of America, Goldman Sachs) is up by 8.56% and is currently outperforming the overall market by 2.42% year-to-date. Below is a quick view of Technical charts and trends: |
|
 XLF Weekly Chart |
|
| Long Term Trend: Very Good | |
| Medium Term Trend: Not Good | |
 XLF Daily Chart |
|
| Short Term Trend: Deteriorating | |
| Overall Trend Score: 63 | |
| YTD Performance: 8.56% | |
| **Trend Scores & Views Are Only For Educational Purposes And Not For Investing | |
| 12Stocks.com: Top Performing Financial Sector Stocks | ||||||||||||||||||||||||||||||||||||||||||||||||
 The top performing Financial sector stocks year to date are
Now, more recently, over last week, the top performing Financial sector stocks on the move are


|
||||||||||||||||||||||||||||||||||||||||||||||||
| 12Stocks.com: Investing in Financial Sector using Exchange Traded Funds | |
|
The following table shows list of key exchange traded funds (ETF) that
help investors track Financial Index. For detailed view, check out our ETF Funds section of our website. Quick View: Move mouse or cursor over ETF symbol (ticker) to view short-term Technical chart and over ETF name to view long term chart. Click on ticker or stock name for detailed view. Click on to add stock symbol to your watchlist and to view watchlist. |
12Stocks.com List of ETFs that track Financial Index
| Ticker | ETF Name | Watchlist | Recent Price | Smart Investing & Trading Score | Change % | Week % | Year-to-date % |
| XLF | Financial | | 40.82 | 63 | -0.15 | 1.09 | 8.56% |
| IAI | Broker-Dealers & Secs | | 113.01 | 68 | 0.77 | 1.78 | 4.13% |
| IYF | Financials | | 92.17 | 68 | -0.35 | 0.95 | 7.91% |
| IYG | Financial Services | | 64.59 | 83 | 0.05 | 1.85 | 8.12% |
| KRE | Regional Banking | | 48.19 | 74 | -0.58 | 1.84 | -8.09% |
| IXG | Global Financials | | 84.43 | 60 | -0.01 | 1.89 | 7.45% |
| VFH | Financials | | 98.93 | 75 | -0.19 | 1.21 | 7.23% |
| KBE | Bank | | 45.33 | 85 | -0.31 | 2.07 | -1.5% |
| FAS | Financial Bull 3X | | 100.63 | 55 | -0.79 | 2.76 | 21.75% |
| FAZ | Financial Bear 3X | | 10.86 | 47 | 0.65 | -3.04 | -20.56% |
| UYG | Financials | | 63.65 | 55 | -0.42 | 1.94 | 15.31% |
| IAT | Regional Banks | | 41.72 | 93 | -0.31 | 2.41 | -0.29% |
| KIE | Insurance | | 48.53 | 33 | -1.56 | -1.12 | 7.32% |
| PSCF | SmallCap Financials | | 46.31 | 65 | 0.05 | 1.85 | -5.83% |
| EUFN | Europe Financials | | 22.46 | 75 | 0.54 | 2.32 | 7.16% |
| PGF | Financial Preferred | | 14.57 | 44 | 0.00 | 0.28 | -0.07% |
| 12Stocks.com: Charts, Trends, Fundamental Data and Performances of Financial Stocks | |
|
We now take in-depth look at all Financial stocks including charts, multi-period performances and overall trends (as measured by Smart Investing & Trading Score). One can sort Financial stocks (click link to choose) by Daily, Weekly and by Year-to-Date performances. Also, one can sort by size of the company or by market capitalization. |
| Select Your Default Chart Type: | |||||
| |||||
| Click on stock symbol or name for detailed view. Click on to add stock symbol to your watchlist and to view watchlist. Quick View: Move mouse or cursor over "Daily" to quickly view daily Technical stock chart and over "Weekly" to view weekly Technical stock chart. | |||||

 | DB Deutsche Bank Aktiengesellschaft |
| Sector: Financials | |
| SubSector: Foreign Regional Banks | |
| MarketCap: 14500.5 Millions | |
| Recent Price: 17.77 Smart Investing & Trading Score: 100 | |
| Day Percent Change: -0.84% Day Change: -0.15 | |
| Week Change: 11.69% Year-to-date Change: 31.1% | |
| DB Links: Profile News Message Board | |
| Charts:- Daily , Weekly | |
| Add DB to Watchlist: View: Get Complete DB Trend Analysis ➞ | |
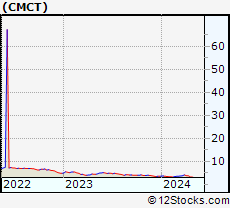 | CMCT CIM Commercial Trust Corporation |
| Sector: Financials | |
| SubSector: REIT - Industrial | |
| MarketCap: 167.049 Millions | |
| Recent Price: 3.53 Smart Investing & Trading Score: 63 | |
| Day Percent Change: -0.84% Day Change: -0.03 | |
| Week Change: 4.13% Year-to-date Change: -4.3% | |
| CMCT Links: Profile News Message Board | |
| Charts:- Daily , Weekly | |
| Add CMCT to Watchlist: View: Get Complete CMCT Trend Analysis ➞ | |
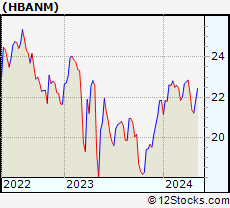 | HBANM Huntington Bancshares Incorporated |
| Sector: Financials | |
| SubSector: Banks - Regional | |
| MarketCap: 15560 Millions | |
| Recent Price: 21.22 Smart Investing & Trading Score: 0 | |
| Day Percent Change: -0.84% Day Change: -0.18 | |
| Week Change: -0.61% Year-to-date Change: -2.9% | |
| HBANM Links: Profile News Message Board | |
| Charts:- Daily , Weekly | |
| Add HBANM to Watchlist: View: Get Complete HBANM Trend Analysis ➞ | |
 | UFCS United Fire Group, Inc. |
| Sector: Financials | |
| SubSector: Property & Casualty Insurance | |
| MarketCap: 862.812 Millions | |
| Recent Price: 22.23 Smart Investing & Trading Score: 81 | |
| Day Percent Change: -0.85% Day Change: -0.19 | |
| Week Change: -2.5% Year-to-date Change: 10.5% | |
| UFCS Links: Profile News Message Board | |
| Charts:- Daily , Weekly | |
| Add UFCS to Watchlist: View: Get Complete UFCS Trend Analysis ➞ | |
 | SFBS ServisFirst Bancshares, Inc. |
| Sector: Financials | |
| SubSector: Foreign Money Center Banks | |
| MarketCap: 1596.71 Millions | |
| Recent Price: 60.75 Smart Investing & Trading Score: 60 | |
| Day Percent Change: -0.85% Day Change: -0.52 | |
| Week Change: 0.88% Year-to-date Change: -8.8% | |
| SFBS Links: Profile News Message Board | |
| Charts:- Daily , Weekly | |
| Add SFBS to Watchlist: View: Get Complete SFBS Trend Analysis ➞ | |
 | MBWM Mercantile Bank Corporation |
| Sector: Financials | |
| SubSector: Regional - Midwest Banks | |
| MarketCap: 372.77 Millions | |
| Recent Price: 36.17 Smart Investing & Trading Score: 42 | |
| Day Percent Change: -0.86% Day Change: -0.32 | |
| Week Change: 0.29% Year-to-date Change: -10.4% | |
| MBWM Links: Profile News Message Board | |
| Charts:- Daily , Weekly | |
| Add MBWM to Watchlist: View: Get Complete MBWM Trend Analysis ➞ | |
 | WSBC WesBanco, Inc. |
| Sector: Financials | |
| SubSector: Regional - Mid-Atlantic Banks | |
| MarketCap: 1575.79 Millions | |
| Recent Price: 27.52 Smart Investing & Trading Score: 47 | |
| Day Percent Change: -0.86% Day Change: -0.24 | |
| Week Change: -2.89% Year-to-date Change: -12.3% | |
| WSBC Links: Profile News Message Board | |
| Charts:- Daily , Weekly | |
| Add WSBC to Watchlist: View: Get Complete WSBC Trend Analysis ➞ | |
 | FHB First Hawaiian, Inc. |
| Sector: Financials | |
| SubSector: Regional - Pacific Banks | |
| MarketCap: 2398.99 Millions | |
| Recent Price: 21.88 Smart Investing & Trading Score: 100 | |
| Day Percent Change: -0.86% Day Change: -0.19 | |
| Week Change: 4.19% Year-to-date Change: -4.3% | |
| FHB Links: Profile News Message Board | |
| Charts:- Daily , Weekly | |
| Add FHB to Watchlist: View: Get Complete FHB Trend Analysis ➞ | |
 | CNOB ConnectOne Bancorp, Inc. |
| Sector: Financials | |
| SubSector: Regional - Northeast Banks | |
| MarketCap: 491.899 Millions | |
| Recent Price: 18.30 Smart Investing & Trading Score: 67 | |
| Day Percent Change: -0.87% Day Change: -0.16 | |
| Week Change: -1.82% Year-to-date Change: -20.1% | |
| CNOB Links: Profile News Message Board | |
| Charts:- Daily , Weekly | |
| Add CNOB to Watchlist: View: Get Complete CNOB Trend Analysis ➞ | |
 | WTM White Mountains Insurance Group, Ltd. |
| Sector: Financials | |
| SubSector: Property & Casualty Insurance | |
| MarketCap: 2502.62 Millions | |
| Recent Price: 1768.38 Smart Investing & Trading Score: 71 | |
| Day Percent Change: -0.88% Day Change: -15.73 | |
| Week Change: -1.27% Year-to-date Change: 17.5% | |
| WTM Links: Profile News Message Board | |
| Charts:- Daily , Weekly | |
| Add WTM to Watchlist: View: Get Complete WTM Trend Analysis ➞ | |
 | CCNE CNB Financial Corporation |
| Sector: Financials | |
| SubSector: Regional - Northeast Banks | |
| MarketCap: 286.599 Millions | |
| Recent Price: 19.05 Smart Investing & Trading Score: 35 | |
| Day Percent Change: -0.88% Day Change: -0.17 | |
| Week Change: 1.65% Year-to-date Change: -15.7% | |
| CCNE Links: Profile News Message Board | |
| Charts:- Daily , Weekly | |
| Add CCNE to Watchlist: View: Get Complete CCNE Trend Analysis ➞ | |
 | VBTX Veritex Holdings, Inc. |
| Sector: Financials | |
| SubSector: Regional - Southwest Banks | |
| MarketCap: 625.165 Millions | |
| Recent Price: 20.22 Smart Investing & Trading Score: 69 | |
| Day Percent Change: -0.88% Day Change: -0.18 | |
| Week Change: 1% Year-to-date Change: -13.1% | |
| VBTX Links: Profile News Message Board | |
| Charts:- Daily , Weekly | |
| Add VBTX to Watchlist: View: Get Complete VBTX Trend Analysis ➞ | |
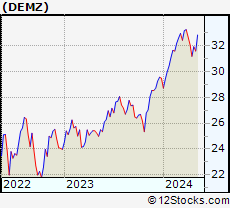 | DEMZ Demz Political Contributions ETF |
| Sector: Financials | |
| SubSector: Exchange Traded Fund | |
| MarketCap: 60157 Millions | |
| Recent Price: 31.48 Smart Investing & Trading Score: 51 | |
| Day Percent Change: -0.88% Day Change: -0.28 | |
| Week Change: 1.03% Year-to-date Change: 6.8% | |
| DEMZ Links: Profile News Message Board | |
| Charts:- Daily , Weekly | |
| Add DEMZ to Watchlist: View: Get Complete DEMZ Trend Analysis ➞ | |
 | ROIC Retail Opportunity Investments Corp. |
| Sector: Financials | |
| SubSector: REIT - Retail | |
| MarketCap: 943.414 Millions | |
| Recent Price: 12.25 Smart Investing & Trading Score: 67 | |
| Day Percent Change: -0.89% Day Change: -0.11 | |
| Week Change: -0.24% Year-to-date Change: -12.7% | |
| ROIC Links: Profile News Message Board | |
| Charts:- Daily , Weekly | |
| Add ROIC to Watchlist: View: Get Complete ROIC Trend Analysis ➞ | |
 | ARE Alexandria Real Estate Equities, Inc. |
| Sector: Financials | |
| SubSector: REIT - Office | |
| MarketCap: 16793.6 Millions | |
| Recent Price: 116.24 Smart Investing & Trading Score: 27 | |
| Day Percent Change: -0.90% Day Change: -1.06 | |
| Week Change: 0.48% Year-to-date Change: -8.3% | |
| ARE Links: Profile News Message Board | |
| Charts:- Daily , Weekly | |
| Add ARE to Watchlist: View: Get Complete ARE Trend Analysis ➞ | |
 | PPBI Pacific Premier Bancorp, Inc. |
| Sector: Financials | |
| SubSector: Regional - Pacific Banks | |
| MarketCap: 978.029 Millions | |
| Recent Price: 21.96 Smart Investing & Trading Score: 37 | |
| Day Percent Change: -0.90% Day Change: -0.20 | |
| Week Change: -1.39% Year-to-date Change: -24.6% | |
| PPBI Links: Profile News Message Board | |
| Charts:- Daily , Weekly | |
| Add PPBI to Watchlist: View: Get Complete PPBI Trend Analysis ➞ | |
 | PB Prosperity Bancshares, Inc. |
| Sector: Financials | |
| SubSector: Regional - Southwest Banks | |
| MarketCap: 4682.25 Millions | |
| Recent Price: 63.55 Smart Investing & Trading Score: 100 | |
| Day Percent Change: -0.90% Day Change: -0.58 | |
| Week Change: 4.57% Year-to-date Change: -6.2% | |
| PB Links: Profile News Message Board | |
| Charts:- Daily , Weekly | |
| Add PB to Watchlist: View: Get Complete PB Trend Analysis ➞ | |
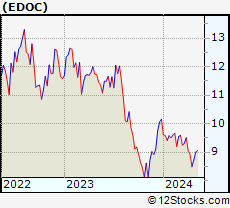 | EDOC Global X Telemedicine & Digital Health ETF |
| Sector: Financials | |
| SubSector: Exchange Traded Fund | |
| MarketCap: 60157 Millions | |
| Recent Price: 8.68 Smart Investing & Trading Score: 35 | |
| Day Percent Change: -0.91% Day Change: -0.08 | |
| Week Change: 2.24% Year-to-date Change: -14.6% | |
| EDOC Links: Profile News Message Board | |
| Charts:- Daily , Weekly | |
| Add EDOC to Watchlist: View: Get Complete EDOC Trend Analysis ➞ | |
 | HCI HCI Group, Inc. |
| Sector: Financials | |
| SubSector: Property & Casualty Insurance | |
| MarketCap: 297.412 Millions | |
| Recent Price: 115.00 Smart Investing & Trading Score: 78 | |
| Day Percent Change: -0.93% Day Change: -1.08 | |
| Week Change: 2.78% Year-to-date Change: 31.6% | |
| HCI Links: Profile News Message Board | |
| Charts:- Daily , Weekly | |
| Add HCI to Watchlist: View: Get Complete HCI Trend Analysis ➞ | |
 | BRKL Brookline Bancorp, Inc. |
| Sector: Financials | |
| SubSector: Savings & Loans | |
| MarketCap: 894.43 Millions | |
| Recent Price: 8.34 Smart Investing & Trading Score: 45 | |
| Day Percent Change: -0.95% Day Change: -0.08 | |
| Week Change: -11.09% Year-to-date Change: -23.6% | |
| BRKL Links: Profile News Message Board | |
| Charts:- Daily , Weekly | |
| Add BRKL to Watchlist: View: Get Complete BRKL Trend Analysis ➞ | |
 | EQIX Equinix, Inc. (REIT) |
| Sector: Financials | |
| SubSector: REIT - Diversified | |
| MarketCap: 45855.3 Millions | |
| Recent Price: 731.37 Smart Investing & Trading Score: 0 | |
| Day Percent Change: -0.95% Day Change: -6.98 | |
| Week Change: -2.22% Year-to-date Change: -9.2% | |
| EQIX Links: Profile News Message Board | |
| Charts:- Daily , Weekly | |
| Add EQIX to Watchlist: View: Get Complete EQIX Trend Analysis ➞ | |
 | CNA CNA Financial Corporation |
| Sector: Financials | |
| SubSector: Property & Casualty Insurance | |
| MarketCap: 9123.32 Millions | |
| Recent Price: 43.24 Smart Investing & Trading Score: 7 | |
| Day Percent Change: -0.96% Day Change: -0.42 | |
| Week Change: -2.7% Year-to-date Change: 2.2% | |
| CNA Links: Profile News Message Board | |
| Charts:- Daily , Weekly | |
| Add CNA to Watchlist: View: Get Complete CNA Trend Analysis ➞ | |
 | PGR The Progressive Corporation |
| Sector: Financials | |
| SubSector: Property & Casualty Insurance | |
| MarketCap: 43112 Millions | |
| Recent Price: 208.03 Smart Investing & Trading Score: 43 | |
| Day Percent Change: -0.97% Day Change: -2.04 | |
| Week Change: -3.1% Year-to-date Change: 30.6% | |
| PGR Links: Profile News Message Board | |
| Charts:- Daily , Weekly | |
| Add PGR to Watchlist: View: Get Complete PGR Trend Analysis ➞ | |
 | PECO Phillips Edison & Company, Inc. |
| Sector: Financials | |
| SubSector: REIT - Retail | |
| MarketCap: 3920 Millions | |
| Recent Price: 32.61 Smart Investing & Trading Score: 7 | |
| Day Percent Change: -0.97% Day Change: -0.32 | |
| Week Change: -1.24% Year-to-date Change: -11.5% | |
| PECO Links: Profile News Message Board | |
| Charts:- Daily , Weekly | |
| Add PECO to Watchlist: View: Get Complete PECO Trend Analysis ➞ | |
 | BFS Saul Centers, Inc. |
| Sector: Financials | |
| SubSector: REIT - Retail | |
| MarketCap: 689.914 Millions | |
| Recent Price: 35.53 Smart Investing & Trading Score: 28 | |
| Day Percent Change: -0.98% Day Change: -0.35 | |
| Week Change: -2.28% Year-to-date Change: -9.5% | |
| BFS Links: Profile News Message Board | |
| Charts:- Daily , Weekly | |
| Add BFS to Watchlist: View: Get Complete BFS Trend Analysis ➞ | |
| For tabular summary view of above stock list: Summary View ➞ 0 - 25 , 25 - 50 , 50 - 75 , 75 - 100 , 100 - 125 , 125 - 150 , 150 - 175 , 175 - 200 , 200 - 225 , 225 - 250 , 250 - 275 , 275 - 300 , 300 - 325 , 325 - 350 , 350 - 375 , 375 - 400 , 400 - 425 , 425 - 450 , 450 - 475 , 475 - 500 , 500 - 525 , 525 - 550 , 550 - 575 , 575 - 600 , 600 - 625 , 625 - 650 , 650 - 675 , 675 - 700 , 700 - 725 , 725 - 750 , 750 - 775 , 775 - 800 , 800 - 825 , 825 - 850 , 850 - 875 , 875 - 900 , 900 - 925 , 925 - 950 , 950 - 975 , 975 - 1000 , 1000 - 1025 , 1025 - 1050 , 1050 - 1075 , 1075 - 1100 , 1100 - 1125 , 1125 - 1150 , 1150 - 1175 , 1175 - 1200 , 1200 - 1225 , 1225 - 1250 | ||
| Click To Change The Sort Order: By Market Cap or Company Size Performance: Year-to-date, Week and Day | |
| Select Chart Type: | ||
|
Best Stocks Today 12Stocks.com |
© 2024 12Stocks.com Terms & Conditions Privacy Contact Us
All Information Provided Only For Education And Not To Be Used For Investing or Trading. See Terms & Conditions


One More Thing ... Get Best Stocks Delivered Daily!
Never Ever Miss A Move With Our Top Ten Stocks Lists
Find Best Stocks In Any Market - Bull or Bear Market
Take A Peek At Our Top Ten Stocks Lists: Daily, Weekly, Year-to-Date & Top Trends
Find Best Stocks In Any Market - Bull or Bear Market
Take A Peek At Our Top Ten Stocks Lists: Daily, Weekly, Year-to-Date & Top Trends
Financial Stocks With Best Up Trends [0-bearish to 100-bullish]: KB [100], MBIA [100], Shinhan [100], B. Riley[100], Uniti [100], American Homes[100], Goldman Sachs[100], Templeton Dragon[100], Mid-America Apartment[100], Solar Capital[100], Camden Property[100]
Best Financial Stocks Year-to-Date:
Root [510.12%], Hippo [141.6%], Gladstone Capital[100.56%], Banco Macro[79.02%], Grupo Financiero[77.56%], B. Riley[75.08%], Banco BBVA[70.04%], Yiren Digital[62.82%], EverQuote [59.64%], Heritage Insurance[57.82%], Fidelis Insurance[54.33%] Best Financial Stocks This Week:
B. Riley[83.84%], Oportun [36.21%], Root [23.46%], KB [18.21%], KE [17.23%], Cipher Mining[16.93%], Provident Bancorp[14.31%], TOP [14.04%], Globe Life[13.5%], Atlanticus [12.86%], Trustmark [12.42%] Best Financial Stocks Daily:
Huize Holding[14.77%], KB [8.99%], KE [8.17%], Root [7.99%], MBIA [7.74%], PagSeguro Digital[7.28%], Shinhan [7.25%], Noah [6.71%], MicroSectors Gold[6.44%], B. Riley[5.94%], Coinbase Global[5.74%]