
 Login Sign Up


| |||||
 |  | ||||

| 12Stocks.com Market Intelligence |
Best Financial Stocks
| In a hurry? Financial Stocks Lists: Performance Trends Table, Stock Charts
Sort Financial stocks: Daily, Weekly, Year-to-Date, Market Cap & Trends. Filter Financial stocks list by size:All Financial Large Mid-Range Small & MicroCap |
| 12Stocks.com Financial Stocks Performances & Trends Daily | |||||||||
|
|  The overall Smart Investing & Trading Score is 70 (0-bearish to 100-bullish) which puts Financial sector in short term neutral to bullish trend. The Smart Investing & Trading Score from previous trading session is 63 and hence an improvement of trend.
| ||||||||
Here are the Smart Investing & Trading Scores of the most requested Financial stocks at 12Stocks.com (click stock name for detailed review):
|


| 12Stocks.com: Investing in Financial sector with Stocks | |
|
The following table helps investors and traders sort through current performance and trends (as measured by Smart Investing & Trading Score) of various
stocks in the Financial sector. Quick View: Move mouse or cursor over stock symbol (ticker) to view short-term Technical chart and over stock name to view long term chart. Click on  to add stock symbol to your watchlist and to add stock symbol to your watchlist and  to view watchlist. Click on any ticker or stock name for detailed market intelligence report for that stock. to view watchlist. Click on any ticker or stock name for detailed market intelligence report for that stock. |
12Stocks.com Performance of Stocks in Financial Sector
| Ticker | Stock Name | Watchlist | Category | Recent Price | Smart Investing & Trading Score | Change % | YTD Change% |
| SHO | Sunstone Hotel |   | REIT | 10.39 | 32 | 1.76 | -3.17% |
| TCBK | TriCo Bancshares | | Regional Banks | 34.17 | 67 | 1.76 | -20.48% |
| IFN | India Fund | | Asset Mgmt | 17.95 | 32 | 1.76 | -1.86% |
| HASI | Hannon Armstrong | | REIT - | 25.39 | 68 | 1.76 | -7.94% |
| WRLD | World Acceptance | | Credit Services | 135.71 | 75 | 1.75 | 3.97% |
| CHN | China Fund | | Closed-End Fund - Foreign | 9.90 | 75 | 1.75 | -2.56% |
| RLTY | Cohen & Steers s Opportunities & ome Fund | | Closed-End Fund - Debt | 13.39 | 37 | 1.75 | -4.32% |
| TPG | TPG | | Asset Mgmt | 43.22 | 51 | 1.74 | -0.10% |
| CSQ | Calamos Strategic | | Closed-End Fund - Debt | 15.55 | 45 | 1.73 | 4.57% |
| PDO | Pimco Dynamic | | Closed-End Fund - Debt | 12.92 | 72 | 1.73 | 6.16% |
| BXMT | Blackstone Mortgage | | Mortgage | 18.86 | 49 | 1.73 | -11.33% |
| CATY | Cathay General | | Regional Banks | 36.62 | 49 | 1.72 | -17.84% |
| PFL | PIMCO ome | | Closed-End Fund - Debt | 8.29 | 39 | 1.72 | -1.78% |
| IIF | Morgan Stanley | | Closed-End Fund - Foreign | 23.10 | 93 | 1.72 | 7.59% |
| EXPI | eXp World | | Property Mgmt | 10.03 | 50 | 1.72 | -35.37% |
| BEN | Franklin Resources | | Asset Mgmt | 25.58 | 32 | 1.71 | -14.13% |
| SBCF | Seacoast Banking | | Regional Banks | 23.18 | 59 | 1.71 | -18.55% |
| GDV | Gabelli Dividend | | Closed-End Fund - Equity | 21.96 | 68 | 1.71 | 1.48% |
| UBFO | United Security | | Regional Banks | 7.47 | 64 | 1.70 | -11.12% |
| LRNZ | TrueShares Technology | | Exchange Traded Fund | 35.12 | 10 | 1.70 | -7.99% |
| TOP | TOP | | Capital Markets | 2.39 | 42 | 1.70 | -35.75% |
| THG | Hanover Insurance | | Insurance | 133.29 | 100 | 1.69 | 9.78% |
| MFC | Manulife | | Life Insurance | 23.46 | 63 | 1.69 | 6.15% |
| JRI | Nuveen Real | | Closed-End Fund - Equity | 11.14 | 32 | 1.69 | -4.99% |
| STHO | Star | | Financials Services | 12.05 | 68 | 1.69 | -19.64% |
| For chart view version of above stock list: Chart View ➞ 0 - 25 , 25 - 50 , 50 - 75 , 75 - 100 , 100 - 125 , 125 - 150 , 150 - 175 , 175 - 200 , 200 - 225 , 225 - 250 , 250 - 275 , 275 - 300 , 300 - 325 , 325 - 350 , 350 - 375 , 375 - 400 , 400 - 425 , 425 - 450 , 450 - 475 , 475 - 500 , 500 - 525 , 525 - 550 , 550 - 575 , 575 - 600 , 600 - 625 , 625 - 650 , 650 - 675 , 675 - 700 , 700 - 725 , 725 - 750 , 750 - 775 , 775 - 800 , 800 - 825 , 825 - 850 , 850 - 875 , 875 - 900 , 900 - 925 , 925 - 950 , 950 - 975 , 975 - 1000 , 1000 - 1025 , 1025 - 1050 , 1050 - 1075 , 1075 - 1100 , 1100 - 1125 , 1125 - 1150 , 1150 - 1175 , 1175 - 1200 , 1200 - 1225 , 1225 - 1250 | ||
 | Click To Change The Sort Order: By Market Cap or Company Size Performance: Year-to-date, Week and Day |  |
|
Get the most comprehensive stock market coverage daily at 12Stocks.com ➞ Best Stocks Today ➞ Best Stocks Weekly ➞ Best Stocks Year-to-Date ➞ Best Stocks Trends ➞  Best Stocks Today 12Stocks.com Best Nasdaq Stocks ➞ Best S&P 500 Stocks ➞ Best Tech Stocks ➞ Best Biotech Stocks ➞ |
| Detailed Overview of Financial Stocks |
| Financial Technical Overview, Leaders & Laggards, Top Financial ETF Funds & Detailed Financial Stocks List, Charts, Trends & More |
| Financial Sector: Technical Analysis, Trends & YTD Performance | |
| Financial sector is composed of stocks
from banks, brokers, insurance, REITs
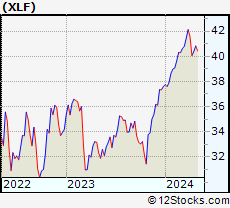
and services subsectors. Financial sector, as represented by XLF, an exchange-traded fund [ETF] that holds basket of Financial stocks (e.g, Bank of America, Goldman Sachs) is up by 8.7% and is currently outperforming the overall market by 4.31% year-to-date. Below is a quick view of Technical charts and trends: |
|
 XLF Weekly Chart |
|
| Long Term Trend: Very Good | |
| Medium Term Trend: Not Good | |
 XLF Daily Chart |
|
| Short Term Trend: Very Good | |
| Overall Trend Score: 70 | |
| YTD Performance: 8.7% | |
| **Trend Scores & Views Are Only For Educational Purposes And Not For Investing | |
| 12Stocks.com: Top Performing Financial Sector Stocks | ||||||||||||||||||||||||||||||||||||||||||||||||
 The top performing Financial sector stocks year to date are
Now, more recently, over last week, the top performing Financial sector stocks on the move are


|
||||||||||||||||||||||||||||||||||||||||||||||||
| 12Stocks.com: Investing in Financial Sector using Exchange Traded Funds | |
|
The following table shows list of key exchange traded funds (ETF) that
help investors track Financial Index. For detailed view, check out our ETF Funds section of our website. Quick View: Move mouse or cursor over ETF symbol (ticker) to view short-term Technical chart and over ETF name to view long term chart. Click on ticker or stock name for detailed view. Click on to add stock symbol to your watchlist and to view watchlist. |
12Stocks.com List of ETFs that track Financial Index
| Ticker | ETF Name | Watchlist | Recent Price | Smart Investing & Trading Score | Change % | Week % | Year-to-date % |
| XLF | Financial | | 40.87 | 70 | 1.21 | 1.21 | 8.7% |
| IAI | Broker-Dealers & Secs | | 112.88 | 75 | 1.67 | 1.67 | 4.01% |
| IYF | Financials | | 92.67 | 75 | 1.50 | 1.5 | 8.5% |
| IYG | Financial Services | | 64.37 | 75 | 1.50 | 1.5 | 7.76% |
| KRE | Regional Banking | | 47.73 | 59 | 0.88 | 0.88 | -8.95% |
| IXG | Global Financials | | 84.00 | 70 | 1.38 | 1.38 | 6.91% |
| VFH | Financials | | 98.31 | 63 | 0.57 | 0.57 | 6.56% |
| KBE | Bank | | 45.17 | 93 | 1.71 | 1.71 | -1.85% |
| FAS | Financial Bull 3X | | 101.59 | 75 | 3.74 | 3.74 | 22.92% |
| FAZ | Financial Bear 3X | | 10.77 | 25 | -3.84 | -3.84 | -21.21% |
| UYG | Financials | | 63.88 | 70 | 2.31 | 2.31 | 15.72% |
| IAT | Regional Banks | | 41.55 | 93 | 1.99 | 1.99 | -0.69% |
| KIE | Insurance | | 49.46 | 65 | 0.77 | 0.77 | 9.38% |
| PSCF | SmallCap Financials | | 46.24 | 59 | 1.69 | 1.69 | -5.98% |
| EUFN | Europe Financials | | 22.16 | 70 | 0.96 | 0.96 | 5.73% |
| PGF | Financial Preferred | | 14.52 | 18 | -0.07 | -0.07 | -0.41% |
| 12Stocks.com: Charts, Trends, Fundamental Data and Performances of Financial Stocks | |
|
We now take in-depth look at all Financial stocks including charts, multi-period performances and overall trends (as measured by Smart Investing & Trading Score). One can sort Financial stocks (click link to choose) by Daily, Weekly and by Year-to-Date performances. Also, one can sort by size of the company or by market capitalization. |
| Select Your Default Chart Type: | |||||
| |||||
| Click on stock symbol or name for detailed view. Click on to add stock symbol to your watchlist and to view watchlist. Quick View: Move mouse or cursor over "Daily" to quickly view daily Technical stock chart and over "Weekly" to view weekly Technical stock chart. | |||||

 | SHO Sunstone Hotel Investors, Inc. |
| Sector: Financials | |
| SubSector: REIT - Hotel/Motel | |
| MarketCap: 1861.04 Millions | |
| Recent Price: 10.39 Smart Investing & Trading Score: 32 | |
| Day Percent Change: 1.76% Day Change: 0.18 | |
| Week Change: 1.76% Year-to-date Change: -3.2% | |
| SHO Links: Profile News Message Board | |
| Charts:- Daily , Weekly | |
| Add SHO to Watchlist: View: Get Complete SHO Trend Analysis ➞ | |
 | TCBK TriCo Bancshares |
| Sector: Financials | |
| SubSector: Regional - Pacific Banks | |
| MarketCap: 875.129 Millions | |
| Recent Price: 34.17 Smart Investing & Trading Score: 67 | |
| Day Percent Change: 1.76% Day Change: 0.59 | |
| Week Change: 1.76% Year-to-date Change: -20.5% | |
| TCBK Links: Profile News Message Board | |
| Charts:- Daily , Weekly | |
| Add TCBK to Watchlist: View: Get Complete TCBK Trend Analysis ➞ | |
 | IFN The India Fund, Inc. |
| Sector: Financials | |
| SubSector: Asset Management | |
| MarketCap: 344.303 Millions | |
| Recent Price: 17.95 Smart Investing & Trading Score: 32 | |
| Day Percent Change: 1.76% Day Change: 0.31 | |
| Week Change: 1.76% Year-to-date Change: -1.9% | |
| IFN Links: Profile News Message Board | |
| Charts:- Daily , Weekly | |
| Add IFN to Watchlist: View: Get Complete IFN Trend Analysis ➞ | |
 | HASI Hannon Armstrong Sustainable Infrastructure Capital, Inc. |
| Sector: Financials | |
| SubSector: REIT - Diversified | |
| MarketCap: 1405.93 Millions | |
| Recent Price: 25.39 Smart Investing & Trading Score: 68 | |
| Day Percent Change: 1.76% Day Change: 0.44 | |
| Week Change: 1.76% Year-to-date Change: -7.9% | |
| HASI Links: Profile News Message Board | |
| Charts:- Daily , Weekly | |
| Add HASI to Watchlist: View: Get Complete HASI Trend Analysis ➞ | |
 | WRLD World Acceptance Corporation |
| Sector: Financials | |
| SubSector: Credit Services | |
| MarketCap: 486.408 Millions | |
| Recent Price: 135.71 Smart Investing & Trading Score: 75 | |
| Day Percent Change: 1.75% Day Change: 2.34 | |
| Week Change: 1.75% Year-to-date Change: 4.0% | |
| WRLD Links: Profile News Message Board | |
| Charts:- Daily , Weekly | |
| Add WRLD to Watchlist: View: Get Complete WRLD Trend Analysis ➞ | |
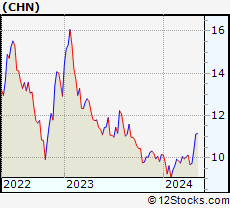 | CHN The China Fund, Inc. |
| Sector: Financials | |
| SubSector: Closed-End Fund - Foreign | |
| MarketCap: 176.047 Millions | |
| Recent Price: 9.90 Smart Investing & Trading Score: 75 | |
| Day Percent Change: 1.75% Day Change: 0.17 | |
| Week Change: 1.75% Year-to-date Change: -2.6% | |
| CHN Links: Profile News Message Board | |
| Charts:- Daily , Weekly | |
| Add CHN to Watchlist: View: Get Complete CHN Trend Analysis ➞ | |
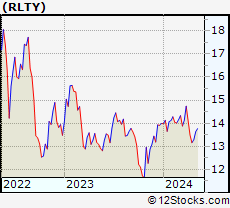 | RLTY Cohen & Steers Financials Opportunities & Income Fund |
| Sector: Financials | |
| SubSector: Closed-End Fund - Debt | |
| MarketCap: 231 Millions | |
| Recent Price: 13.39 Smart Investing & Trading Score: 37 | |
| Day Percent Change: 1.75% Day Change: 0.23 | |
| Week Change: 1.75% Year-to-date Change: -4.3% | |
| RLTY Links: Profile News Message Board | |
| Charts:- Daily , Weekly | |
| Add RLTY to Watchlist: View: Get Complete RLTY Trend Analysis ➞ | |
 | TPG TPG Inc. |
| Sector: Financials | |
| SubSector: Asset Management | |
| MarketCap: 8700 Millions | |
| Recent Price: 43.22 Smart Investing & Trading Score: 51 | |
| Day Percent Change: 1.74% Day Change: 0.74 | |
| Week Change: 1.74% Year-to-date Change: -0.1% | |
| TPG Links: Profile News Message Board | |
| Charts:- Daily , Weekly | |
| Add TPG to Watchlist: View: Get Complete TPG Trend Analysis ➞ | |
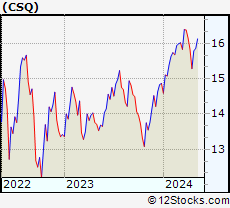 | CSQ Calamos Strategic Total Return Fund |
| Sector: Financials | |
| SubSector: Closed-End Fund - Debt | |
| MarketCap: 1196.17 Millions | |
| Recent Price: 15.55 Smart Investing & Trading Score: 45 | |
| Day Percent Change: 1.73% Day Change: 0.27 | |
| Week Change: 1.73% Year-to-date Change: 4.6% | |
| CSQ Links: Profile News Message Board | |
| Charts:- Daily , Weekly | |
| Add CSQ to Watchlist: View: Get Complete CSQ Trend Analysis ➞ | |
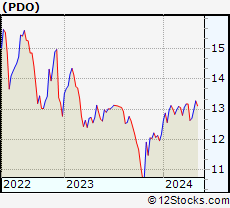 | PDO Pimco Dynamic Income Opportunities Fund |
| Sector: Financials | |
| SubSector: Closed-End Fund - Debt | |
| MarketCap: 1440 Millions | |
| Recent Price: 12.92 Smart Investing & Trading Score: 72 | |
| Day Percent Change: 1.73% Day Change: 0.22 | |
| Week Change: 1.73% Year-to-date Change: 6.2% | |
| PDO Links: Profile News Message Board | |
| Charts:- Daily , Weekly | |
| Add PDO to Watchlist: View: Get Complete PDO Trend Analysis ➞ | |
 | BXMT Blackstone Mortgage Trust, Inc. |
| Sector: Financials | |
| SubSector: Mortgage Investment | |
| MarketCap: 2820.69 Millions | |
| Recent Price: 18.86 Smart Investing & Trading Score: 49 | |
| Day Percent Change: 1.73% Day Change: 0.32 | |
| Week Change: 1.73% Year-to-date Change: -11.3% | |
| BXMT Links: Profile News Message Board | |
| Charts:- Daily , Weekly | |
| Add BXMT to Watchlist: View: Get Complete BXMT Trend Analysis ➞ | |
 | CATY Cathay General Bancorp |
| Sector: Financials | |
| SubSector: Regional - Pacific Banks | |
| MarketCap: 1781.99 Millions | |
| Recent Price: 36.62 Smart Investing & Trading Score: 49 | |
| Day Percent Change: 1.72% Day Change: 0.62 | |
| Week Change: 1.72% Year-to-date Change: -17.8% | |
| CATY Links: Profile News Message Board | |
| Charts:- Daily , Weekly | |
| Add CATY to Watchlist: View: Get Complete CATY Trend Analysis ➞ | |
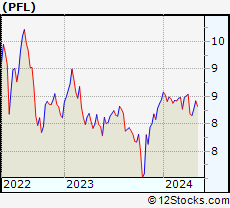 | PFL PIMCO Income Strategy Fund |
| Sector: Financials | |
| SubSector: Closed-End Fund - Debt | |
| MarketCap: 223.707 Millions | |
| Recent Price: 8.29 Smart Investing & Trading Score: 39 | |
| Day Percent Change: 1.72% Day Change: 0.14 | |
| Week Change: 1.72% Year-to-date Change: -1.8% | |
| PFL Links: Profile News Message Board | |
| Charts:- Daily , Weekly | |
| Add PFL to Watchlist: View: Get Complete PFL Trend Analysis ➞ | |
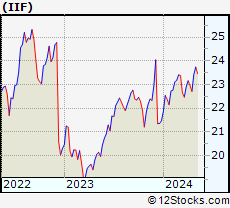 | IIF Morgan Stanley India Investment Fund, Inc. |
| Sector: Financials | |
| SubSector: Closed-End Fund - Foreign | |
| MarketCap: 166.247 Millions | |
| Recent Price: 23.10 Smart Investing & Trading Score: 93 | |
| Day Percent Change: 1.72% Day Change: 0.39 | |
| Week Change: 1.72% Year-to-date Change: 7.6% | |
| IIF Links: Profile News Message Board | |
| Charts:- Daily , Weekly | |
| Add IIF to Watchlist: View: Get Complete IIF Trend Analysis ➞ | |
 | EXPI eXp World Holdings, Inc. |
| Sector: Financials | |
| SubSector: Property Management | |
| MarketCap: 448.042 Millions | |
| Recent Price: 10.03 Smart Investing & Trading Score: 50 | |
| Day Percent Change: 1.72% Day Change: 0.17 | |
| Week Change: 1.72% Year-to-date Change: -35.4% | |
| EXPI Links: Profile News Message Board | |
| Charts:- Daily , Weekly | |
| Add EXPI to Watchlist: View: Get Complete EXPI Trend Analysis ➞ | |
 | BEN Franklin Resources, Inc. |
| Sector: Financials | |
| SubSector: Asset Management | |
| MarketCap: 9419.73 Millions | |
| Recent Price: 25.58 Smart Investing & Trading Score: 32 | |
| Day Percent Change: 1.71% Day Change: 0.43 | |
| Week Change: 1.71% Year-to-date Change: -14.1% | |
| BEN Links: Profile News Message Board | |
| Charts:- Daily , Weekly | |
| Add BEN to Watchlist: View: Get Complete BEN Trend Analysis ➞ | |
 | SBCF Seacoast Banking Corporation of Florida |
| Sector: Financials | |
| SubSector: Regional - Mid-Atlantic Banks | |
| MarketCap: 881.559 Millions | |
| Recent Price: 23.18 Smart Investing & Trading Score: 59 | |
| Day Percent Change: 1.71% Day Change: 0.39 | |
| Week Change: 1.71% Year-to-date Change: -18.6% | |
| SBCF Links: Profile News Message Board | |
| Charts:- Daily , Weekly | |
| Add SBCF to Watchlist: View: Get Complete SBCF Trend Analysis ➞ | |
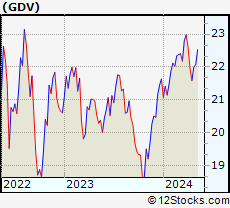 | GDV The Gabelli Dividend & Income Trust |
| Sector: Financials | |
| SubSector: Closed-End Fund - Equity | |
| MarketCap: 1079.97 Millions | |
| Recent Price: 21.96 Smart Investing & Trading Score: 68 | |
| Day Percent Change: 1.71% Day Change: 0.37 | |
| Week Change: 1.71% Year-to-date Change: 1.5% | |
| GDV Links: Profile News Message Board | |
| Charts:- Daily , Weekly | |
| Add GDV to Watchlist: View: Get Complete GDV Trend Analysis ➞ | |
 | UBFO United Security Bancshares |
| Sector: Financials | |
| SubSector: Regional - Pacific Banks | |
| MarketCap: 135.029 Millions | |
| Recent Price: 7.47 Smart Investing & Trading Score: 64 | |
| Day Percent Change: 1.70% Day Change: 0.13 | |
| Week Change: 1.7% Year-to-date Change: -11.1% | |
| UBFO Links: Profile News Message Board | |
| Charts:- Daily , Weekly | |
| Add UBFO to Watchlist: View: Get Complete UBFO Trend Analysis ➞ | |
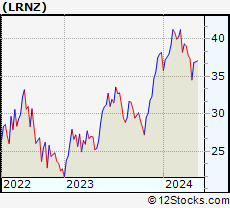 | LRNZ TrueShares Technology, AI and Deep Learning ETF |
| Sector: Financials | |
| SubSector: Exchange Traded Fund | |
| MarketCap: 60157 Millions | |
| Recent Price: 35.12 Smart Investing & Trading Score: 10 | |
| Day Percent Change: 1.70% Day Change: 0.59 | |
| Week Change: 1.7% Year-to-date Change: -8.0% | |
| LRNZ Links: Profile News Message Board | |
| Charts:- Daily , Weekly | |
| Add LRNZ to Watchlist: View: Get Complete LRNZ Trend Analysis ➞ | |
 | TOP TOP Financial Group Limited |
| Sector: Financials | |
| SubSector: Capital Markets | |
| MarketCap: 329 Millions | |
| Recent Price: 2.39 Smart Investing & Trading Score: 42 | |
| Day Percent Change: 1.70% Day Change: 0.04 | |
| Week Change: 1.7% Year-to-date Change: -35.8% | |
| TOP Links: Profile News Message Board | |
| Charts:- Daily , Weekly | |
| Add TOP to Watchlist: View: Get Complete TOP Trend Analysis ➞ | |
 | THG The Hanover Insurance Group, Inc. |
| Sector: Financials | |
| SubSector: Property & Casualty Insurance | |
| MarketCap: 3677.92 Millions | |
| Recent Price: 133.29 Smart Investing & Trading Score: 100 | |
| Day Percent Change: 1.69% Day Change: 2.21 | |
| Week Change: 1.69% Year-to-date Change: 9.8% | |
| THG Links: Profile News Message Board | |
| Charts:- Daily , Weekly | |
| Add THG to Watchlist: View: Get Complete THG Trend Analysis ➞ | |
 | MFC Manulife Financial Corporation |
| Sector: Financials | |
| SubSector: Life Insurance | |
| MarketCap: 22188.7 Millions | |
| Recent Price: 23.46 Smart Investing & Trading Score: 63 | |
| Day Percent Change: 1.69% Day Change: 0.39 | |
| Week Change: 1.69% Year-to-date Change: 6.2% | |
| MFC Links: Profile News Message Board | |
| Charts:- Daily , Weekly | |
| Add MFC to Watchlist: View: Get Complete MFC Trend Analysis ➞ | |
 | JRI Nuveen Real Asset Income and Growth Fund |
| Sector: Financials | |
| SubSector: Closed-End Fund - Equity | |
| MarketCap: 239.247 Millions | |
| Recent Price: 11.14 Smart Investing & Trading Score: 32 | |
| Day Percent Change: 1.69% Day Change: 0.19 | |
| Week Change: 1.69% Year-to-date Change: -5.0% | |
| JRI Links: Profile News Message Board | |
| Charts:- Daily , Weekly | |
| Add JRI to Watchlist: View: Get Complete JRI Trend Analysis ➞ | |
 | STHO Star Holdings |
| Sector: Financials | |
| SubSector: Financials Services | |
| MarketCap: 195 Millions | |
| Recent Price: 12.05 Smart Investing & Trading Score: 68 | |
| Day Percent Change: 1.69% Day Change: 0.20 | |
| Week Change: 1.69% Year-to-date Change: -19.6% | |
| STHO Links: Profile News Message Board | |
| Charts:- Daily , Weekly | |
| Add STHO to Watchlist: View: Get Complete STHO Trend Analysis ➞ | |
| For tabular summary view of above stock list: Summary View ➞ 0 - 25 , 25 - 50 , 50 - 75 , 75 - 100 , 100 - 125 , 125 - 150 , 150 - 175 , 175 - 200 , 200 - 225 , 225 - 250 , 250 - 275 , 275 - 300 , 300 - 325 , 325 - 350 , 350 - 375 , 375 - 400 , 400 - 425 , 425 - 450 , 450 - 475 , 475 - 500 , 500 - 525 , 525 - 550 , 550 - 575 , 575 - 600 , 600 - 625 , 625 - 650 , 650 - 675 , 675 - 700 , 700 - 725 , 725 - 750 , 750 - 775 , 775 - 800 , 800 - 825 , 825 - 850 , 850 - 875 , 875 - 900 , 900 - 925 , 925 - 950 , 950 - 975 , 975 - 1000 , 1000 - 1025 , 1025 - 1050 , 1050 - 1075 , 1075 - 1100 , 1100 - 1125 , 1125 - 1150 , 1150 - 1175 , 1175 - 1200 , 1200 - 1225 , 1225 - 1250 | ||
| Click To Change The Sort Order: By Market Cap or Company Size Performance: Year-to-date, Week and Day | |
| Select Chart Type: | ||
|
Best Stocks Today 12Stocks.com |
© 2024 12Stocks.com Terms & Conditions Privacy Contact Us
All Information Provided Only For Education And Not To Be Used For Investing or Trading. See Terms & Conditions


One More Thing ... Get Best Stocks Delivered Daily!
Never Ever Miss A Move With Our Top Ten Stocks Lists
Find Best Stocks In Any Market - Bull or Bear Market
Take A Peek At Our Top Ten Stocks Lists: Daily, Weekly, Year-to-Date & Top Trends
Find Best Stocks In Any Market - Bull or Bear Market
Take A Peek At Our Top Ten Stocks Lists: Daily, Weekly, Year-to-Date & Top Trends
Financial Stocks With Best Up Trends [0-bearish to 100-bullish]: Grupo Financiero[100], IRSA Inversiones[100], Park National[100], Perella Weinberg[100], Voya Global[100], Goldman Sachs[100], Mercury General[100], Third Coast[100], Capital One[100], Victory Capital[100], HSBC [100]
Best Financial Stocks Year-to-Date:
Root [420.25%], Hippo [125.58%], Gladstone Capital[98.22%], Banco Macro[85.61%], Grupo Financiero[79.67%], Banco BBVA[72.43%], Yiren Digital[59.29%], Grupo Supervielle[52.71%], EverQuote [51.39%], First [51.11%], Fidelis Insurance[50.77%] Best Financial Stocks This Week:
Cipher Mining[18.75%], Grupo Supervielle[12.73%], Iris Energy[11.31%], Banco BBVA[9.45%], Grupo Financiero[9%], Hywin [8.88%], Metropolitan Bank[8.32%], KB [7.94%], B. Riley[7.75%], Fangdd Network[7.74%], Office Properties[7.12%] Best Financial Stocks Daily:
Cipher Mining[18.75%], Grupo Supervielle[12.73%], Iris Energy[11.31%], Banco BBVA[9.45%], Grupo Financiero[9.00%], Hywin [8.88%], Metropolitan Bank[8.32%], KB [7.94%], B. Riley[7.75%], Fangdd Network[7.74%], Office Properties[7.12%]