
 Login Sign Up


| |||||
 |  | ||||

| 12Stocks.com Market Intelligence |
Best Financial Stocks
| In a hurry? Financial Stocks Lists: Performance Trends Table, Stock Charts
Sort Financial stocks: Daily, Weekly, Year-to-Date, Market Cap & Trends. Filter Financial stocks list by size:All Financial Large Mid-Range Small & MicroCap |
| 12Stocks.com Financial Stocks Performances & Trends Daily | |||||||||
|
|  The overall Smart Investing & Trading Score is 26 (0-bearish to 100-bullish) which puts Financial sector in short term bearish to neutral trend. The Smart Investing & Trading Score from previous trading session is 31 and hence a deterioration of trend.
| ||||||||
Here are the Smart Investing & Trading Scores of the most requested Financial stocks at 12Stocks.com (click stock name for detailed review):
|


| 12Stocks.com: Investing in Financial sector with Stocks | |
|
The following table helps investors and traders sort through current performance and trends (as measured by Smart Investing & Trading Score) of various
stocks in the Financial sector. Quick View: Move mouse or cursor over stock symbol (ticker) to view short-term Technical chart and over stock name to view long term chart. Click on  to add stock symbol to your watchlist and to add stock symbol to your watchlist and  to view watchlist. Click on any ticker or stock name for detailed market intelligence report for that stock. to view watchlist. Click on any ticker or stock name for detailed market intelligence report for that stock. |
12Stocks.com Performance of Stocks in Financial Sector
| Ticker | Stock Name | Watchlist | Category | Recent Price | Smart Investing & Trading Score | Change % | YTD Change% |
| WFC | Wells Fargo |   | Banks | 55.77 | 36 | -2.11 | 13.31% |
| CBRE | CBRE | | Property Mgmt | 85.15 | 13 | -2.12 | -8.53% |
| IIPR | Innovative Industrial | | REIT - Industrial | 94.65 | 31 | -2.14 | -6.12% |
| MOFG | MidWestOne | | Regional - Southwest Banks | 20.16 | 10 | -2.14 | -25.08% |
| MAC | Macerich | | REIT - Retail | 15.62 | 0 | -2.16 | 1.20% |
| NXE | NexGen Energy | | Closed-End Fund - Debt | 7.66 | 46 | -2.17 | 9.43% |
| EGBN | Eagle Bancorp | | Regional Banks | 20.84 | 28 | -2.18 | -30.84% |
| BOH | Bank of Hawaii | | Regional Banks | 57.09 | 0 | -2.18 | -21.21% |
| BNS | Bank of Nova Scotia | | Banks | 46.43 | 18 | -2.21 | -4.64% |
| HWC | Hancock Whitney | | Regional Banks | 41.66 | 10 | -2.21 | -14.26% |
| SAFE | Safehold | | REIT - | 18.09 | 10 | -2.22 | -22.69% |
| GNW | Genworth | | Life Insurance | 5.73 | 0 | -2.22 | -14.22% |
| BDN | Brandywine Realty | | REIT - | 4.18 | 0 | -2.22 | -22.50% |
| SNV | Synovus | | Regional Banks | 35.95 | 5 | -2.22 | -4.53% |
| CMA | Comerica | | Banks | 49.72 | 10 | -2.22 | -10.91% |
| HSBC | HSBC | | Foreign Banks | 39.67 | 34 | -2.22 | -2.15% |
| ESRT | Empire State | | REIT - | 8.94 | 0 | -2.24 | -7.79% |
| ARE | Alexandria Real | | REIT - Office | 116.50 | 10 | -2.25 | -8.10% |
| CIO | City Office | | REIT - Office | 4.32 | 10 | -2.26 | -29.30% |
| ARR | ARMOUR Residential | | Mortgage | 17.41 | 0 | -2.27 | -9.86% |
| BSBR | Banco Santander | | Foreign Banks | 5.13 | 0 | -2.29 | -21.68% |
| PUK | Prudential | | Life Insurance | 17.27 | 0 | -2.29 | -23.10% |
| CHMI | Cherry Hill | | Mortgage | 3.21 | 10 | -2.29 | -20.67% |
| NMRK | Newmark | | Property Mgmt | 9.57 | 0 | -2.30 | -12.64% |
| IVR | Invesco Mortgage | | Mortgage | 8.06 | 10 | -2.30 | -9.03% |
| For chart view version of above stock list: Chart View ➞ 0 - 25 , 25 - 50 , 50 - 75 , 75 - 100 , 100 - 125 , 125 - 150 , 150 - 175 , 175 - 200 , 200 - 225 , 225 - 250 , 250 - 275 , 275 - 300 , 300 - 325 , 325 - 350 , 350 - 375 , 375 - 400 , 400 - 425 , 425 - 450 , 450 - 475 , 475 - 500 , 500 - 525 , 525 - 550 , 550 - 575 , 575 - 600 , 600 - 625 , 625 - 650 , 650 - 675 , 675 - 700 , 700 - 725 , 725 - 750 , 750 - 775 , 775 - 800 , 800 - 825 , 825 - 850 , 850 - 875 , 875 - 900 , 900 - 925 , 925 - 950 , 950 - 975 , 975 - 1000 | ||
 | Click To Change The Sort Order: By Market Cap or Company Size Performance: Year-to-date, Week and Day |  |
|
Get the most comprehensive stock market coverage daily at 12Stocks.com ➞ Best Stocks Today ➞ Best Stocks Weekly ➞ Best Stocks Year-to-Date ➞ Best Stocks Trends ➞  Best Stocks Today 12Stocks.com Best Nasdaq Stocks ➞ Best S&P 500 Stocks ➞ Best Tech Stocks ➞ Best Biotech Stocks ➞ |
| Detailed Overview of Financial Stocks |
| Financial Technical Overview, Leaders & Laggards, Top Financial ETF Funds & Detailed Financial Stocks List, Charts, Trends & More |
| Financial Sector: Technical Analysis, Trends & YTD Performance | |
| Financial sector is composed of stocks
from banks, brokers, insurance, REITs
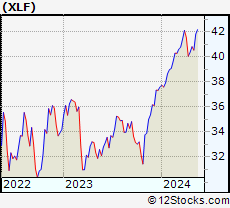
and services subsectors. Financial sector, as represented by XLF, an exchange-traded fund [ETF] that holds basket of Financial stocks (e.g, Bank of America, Goldman Sachs) is up by 5.4% and is currently outperforming the overall market by 0.29% year-to-date. Below is a quick view of Technical charts and trends: |
|
 XLF Weekly Chart |
|
| Long Term Trend: Good | |
| Medium Term Trend: Not Good | |
 XLF Daily Chart |
|
| Short Term Trend: Not Good | |
| Overall Trend Score: 26 | |
| YTD Performance: 5.4% | |
| **Trend Scores & Views Are Only For Educational Purposes And Not For Investing | |
| 12Stocks.com: Top Performing Financial Sector Stocks | ||||||||||||||||||||||||||||||||||||||||||||||||
 The top performing Financial sector stocks year to date are
Now, more recently, over last week, the top performing Financial sector stocks on the move are


|
||||||||||||||||||||||||||||||||||||||||||||||||
| 12Stocks.com: Investing in Financial Sector using Exchange Traded Funds | |
|
The following table shows list of key exchange traded funds (ETF) that
help investors track Financial Index. For detailed view, check out our ETF Funds section of our website. Quick View: Move mouse or cursor over ETF symbol (ticker) to view short-term Technical chart and over ETF name to view long term chart. Click on ticker or stock name for detailed view. Click on to add stock symbol to your watchlist and to view watchlist. |
12Stocks.com List of ETFs that track Financial Index
| Ticker | ETF Name | Watchlist | Recent Price | Smart Investing & Trading Score | Change % | Week % | Year-to-date % |
| XLF | Financial | | 39.63 | 26 | -0.58 | -1.07 | 5.4% |
| IAI | Broker-Dealers & Secs | | 109.31 | 26 | -0.36 | -1.37 | 0.72% |
| IYF | Financials | | 89.40 | 31 | -0.67 | -1.27 | 4.67% |
| IYG | Financial Services | | 62.39 | 31 | -0.57 | -1.3 | 4.44% |
| KRE | Regional Banking | | 45.50 | 10 | -1.81 | -2.19 | -13.22% |
| IXG | Global Financials | | 82.33 | 26 | -0.91 | -0.4 | 4.77% |
| VFH | Financials | | 96.05 | 31 | -0.45 | -1.16 | 4.11% |
| KBE | Bank | | 42.81 | 0 | -1.85 | -2.25 | -6.99% |
| FAS | Financial Bull 3X | | 93.50 | 31 | -1.01 | -2.83 | 13.12% |
| FAZ | Financial Bear 3X | | 11.80 | 64 | 1.37 | 3.42 | -13.68% |
| UYG | Financials | | 60.30 | 26 | -0.82 | -1.9 | 9.24% |
| IAT | Regional Banks | | 39.53 | 10 | -1.92 | -2.24 | -5.51% |
| KIE | Insurance | | 47.86 | 23 | -0.17 | -0.95 | 5.84% |
| PSCF | SmallCap Financials | | 45.10 | 13 | -0.67 | -0.67 | -8.29% |
| EUFN | Europe Financials | | 21.65 | 31 | -1.21 | -1.1 | 3.29% |
| PGF | Financial Preferred | | 14.38 | 0 | -0.35 | -2.04 | -1.37% |
| 12Stocks.com: Charts, Trends, Fundamental Data and Performances of Financial Stocks | |
|
We now take in-depth look at all Financial stocks including charts, multi-period performances and overall trends (as measured by Smart Investing & Trading Score). One can sort Financial stocks (click link to choose) by Daily, Weekly and by Year-to-Date performances. Also, one can sort by size of the company or by market capitalization. |
| Select Your Default Chart Type: | |||||
| |||||
| Click on stock symbol or name for detailed view. Click on to add stock symbol to your watchlist and to view watchlist. Quick View: Move mouse or cursor over "Daily" to quickly view daily Technical stock chart and over "Weekly" to view weekly Technical stock chart. | |||||

 | WFC Wells Fargo & Company |
| Sector: Financials | |
| SubSector: Money Center Banks | |
| MarketCap: 129138 Millions | |
| Recent Price: 55.77 Smart Investing & Trading Score: 36 | |
| Day Percent Change: -2.11% Day Change: -1.20 | |
| Week Change: -1.24% Year-to-date Change: 13.3% | |
| WFC Links: Profile News Message Board | |
| Charts:- Daily , Weekly | |
| Add WFC to Watchlist: View: Get Complete WFC Trend Analysis ➞ | |
 | CBRE CBRE Group, Inc. |
| Sector: Financials | |
| SubSector: Property Management | |
| MarketCap: 12799.2 Millions | |
| Recent Price: 85.15 Smart Investing & Trading Score: 13 | |
| Day Percent Change: -2.12% Day Change: -1.84 | |
| Week Change: -4.74% Year-to-date Change: -8.5% | |
| CBRE Links: Profile News Message Board | |
| Charts:- Daily , Weekly | |
| Add CBRE to Watchlist: View: Get Complete CBRE Trend Analysis ➞ | |
 | IIPR Innovative Industrial Properties, Inc. |
| Sector: Financials | |
| SubSector: REIT - Industrial | |
| MarketCap: 1193.29 Millions | |
| Recent Price: 94.65 Smart Investing & Trading Score: 31 | |
| Day Percent Change: -2.14% Day Change: -2.07 | |
| Week Change: -3.71% Year-to-date Change: -6.1% | |
| IIPR Links: Profile News Message Board | |
| Charts:- Daily , Weekly | |
| Add IIPR to Watchlist: View: Get Complete IIPR Trend Analysis ➞ | |
 | MOFG MidWestOne Financial Group, Inc. |
| Sector: Financials | |
| SubSector: Regional - Southwest Banks | |
| MarketCap: 345.265 Millions | |
| Recent Price: 20.16 Smart Investing & Trading Score: 10 | |
| Day Percent Change: -2.14% Day Change: -0.44 | |
| Week Change: -2.09% Year-to-date Change: -25.1% | |
| MOFG Links: Profile News Message Board | |
| Charts:- Daily , Weekly | |
| Add MOFG to Watchlist: View: Get Complete MOFG Trend Analysis ➞ | |
 | MAC The Macerich Company |
| Sector: Financials | |
| SubSector: REIT - Retail | |
| MarketCap: 1172.54 Millions | |
| Recent Price: 15.62 Smart Investing & Trading Score: 0 | |
| Day Percent Change: -2.16% Day Change: -0.35 | |
| Week Change: -2.89% Year-to-date Change: 1.2% | |
| MAC Links: Profile News Message Board | |
| Charts:- Daily , Weekly | |
| Add MAC to Watchlist: View: Get Complete MAC Trend Analysis ➞ | |
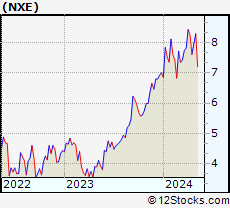 | NXE NexGen Energy Ltd. |
| Sector: Financials | |
| SubSector: Closed-End Fund - Debt | |
| MarketCap: 210.207 Millions | |
| Recent Price: 7.66 Smart Investing & Trading Score: 46 | |
| Day Percent Change: -2.17% Day Change: -0.17 | |
| Week Change: -7.26% Year-to-date Change: 9.4% | |
| NXE Links: Profile News Message Board | |
| Charts:- Daily , Weekly | |
| Add NXE to Watchlist: View: Get Complete NXE Trend Analysis ➞ | |
 | EGBN Eagle Bancorp, Inc. |
| Sector: Financials | |
| SubSector: Regional - Mid-Atlantic Banks | |
| MarketCap: 906.559 Millions | |
| Recent Price: 20.84 Smart Investing & Trading Score: 28 | |
| Day Percent Change: -2.18% Day Change: -0.46 | |
| Week Change: -2.27% Year-to-date Change: -30.8% | |
| EGBN Links: Profile News Message Board | |
| Charts:- Daily , Weekly | |
| Add EGBN to Watchlist: View: Get Complete EGBN Trend Analysis ➞ | |
 | BOH Bank of Hawaii Corporation |
| Sector: Financials | |
| SubSector: Regional - Pacific Banks | |
| MarketCap: 2305.19 Millions | |
| Recent Price: 57.09 Smart Investing & Trading Score: 0 | |
| Day Percent Change: -2.18% Day Change: -1.27 | |
| Week Change: -2.04% Year-to-date Change: -21.2% | |
| BOH Links: Profile News Message Board | |
| Charts:- Daily , Weekly | |
| Add BOH to Watchlist: View: Get Complete BOH Trend Analysis ➞ | |
 | BNS The Bank of Nova Scotia |
| Sector: Financials | |
| SubSector: Money Center Banks | |
| MarketCap: 48742.1 Millions | |
| Recent Price: 46.43 Smart Investing & Trading Score: 18 | |
| Day Percent Change: -2.21% Day Change: -1.05 | |
| Week Change: -3.65% Year-to-date Change: -4.6% | |
| BNS Links: Profile News Message Board | |
| Charts:- Daily , Weekly | |
| Add BNS to Watchlist: View: Get Complete BNS Trend Analysis ➞ | |
 | HWC Hancock Whitney Corporation |
| Sector: Financials | |
| SubSector: Regional - Southeast Banks | |
| MarketCap: 1438.55 Millions | |
| Recent Price: 41.66 Smart Investing & Trading Score: 10 | |
| Day Percent Change: -2.21% Day Change: -0.94 | |
| Week Change: -2.11% Year-to-date Change: -14.3% | |
| HWC Links: Profile News Message Board | |
| Charts:- Daily , Weekly | |
| Add HWC to Watchlist: View: Get Complete HWC Trend Analysis ➞ | |
 | SAFE Safehold Inc. |
| Sector: Financials | |
| SubSector: REIT - Diversified | |
| MarketCap: 2994.63 Millions | |
| Recent Price: 18.09 Smart Investing & Trading Score: 10 | |
| Day Percent Change: -2.22% Day Change: -0.41 | |
| Week Change: -5.19% Year-to-date Change: -22.7% | |
| SAFE Links: Profile News Message Board | |
| Charts:- Daily , Weekly | |
| Add SAFE to Watchlist: View: Get Complete SAFE Trend Analysis ➞ | |
 | GNW Genworth Financial, Inc. |
| Sector: Financials | |
| SubSector: Life Insurance | |
| MarketCap: 1719.76 Millions | |
| Recent Price: 5.73 Smart Investing & Trading Score: 0 | |
| Day Percent Change: -2.22% Day Change: -0.13 | |
| Week Change: -3.05% Year-to-date Change: -14.2% | |
| GNW Links: Profile News Message Board | |
| Charts:- Daily , Weekly | |
| Add GNW to Watchlist: View: Get Complete GNW Trend Analysis ➞ | |
 | BDN Brandywine Realty Trust |
| Sector: Financials | |
| SubSector: REIT - Diversified | |
| MarketCap: 1688.13 Millions | |
| Recent Price: 4.18 Smart Investing & Trading Score: 0 | |
| Day Percent Change: -2.22% Day Change: -0.10 | |
| Week Change: -4.01% Year-to-date Change: -22.5% | |
| BDN Links: Profile News Message Board | |
| Charts:- Daily , Weekly | |
| Add BDN to Watchlist: View: Get Complete BDN Trend Analysis ➞ | |
 | SNV Synovus Financial Corp. |
| Sector: Financials | |
| SubSector: Regional - Mid-Atlantic Banks | |
| MarketCap: 2697.29 Millions | |
| Recent Price: 35.95 Smart Investing & Trading Score: 5 | |
| Day Percent Change: -2.22% Day Change: -0.81 | |
| Week Change: -2.4% Year-to-date Change: -4.5% | |
| SNV Links: Profile News Message Board | |
| Charts:- Daily , Weekly | |
| Add SNV to Watchlist: View: Get Complete SNV Trend Analysis ➞ | |
 | CMA Comerica Incorporated |
| Sector: Financials | |
| SubSector: Money Center Banks | |
| MarketCap: 4449.49 Millions | |
| Recent Price: 49.72 Smart Investing & Trading Score: 10 | |
| Day Percent Change: -2.22% Day Change: -1.13 | |
| Week Change: -2.97% Year-to-date Change: -10.9% | |
| CMA Links: Profile News Message Board | |
| Charts:- Daily , Weekly | |
| Add CMA to Watchlist: View: Get Complete CMA Trend Analysis ➞ | |
 | HSBC HSBC Holdings plc |
| Sector: Financials | |
| SubSector: Foreign Money Center Banks | |
| MarketCap: 127701 Millions | |
| Recent Price: 39.67 Smart Investing & Trading Score: 34 | |
| Day Percent Change: -2.22% Day Change: -0.90 | |
| Week Change: -2.36% Year-to-date Change: -2.2% | |
| HSBC Links: Profile News Message Board | |
| Charts:- Daily , Weekly | |
| Add HSBC to Watchlist: View: Get Complete HSBC Trend Analysis ➞ | |
 | ESRT Empire State Realty Trust, Inc. |
| Sector: Financials | |
| SubSector: REIT - Diversified | |
| MarketCap: 1632.13 Millions | |
| Recent Price: 8.94 Smart Investing & Trading Score: 0 | |
| Day Percent Change: -2.24% Day Change: -0.21 | |
| Week Change: -2.88% Year-to-date Change: -7.8% | |
| ESRT Links: Profile News Message Board | |
| Charts:- Daily , Weekly | |
| Add ESRT to Watchlist: View: Get Complete ESRT Trend Analysis ➞ | |
 | ARE Alexandria Real Estate Equities, Inc. |
| Sector: Financials | |
| SubSector: REIT - Office | |
| MarketCap: 16793.6 Millions | |
| Recent Price: 116.50 Smart Investing & Trading Score: 10 | |
| Day Percent Change: -2.25% Day Change: -2.68 | |
| Week Change: -4.38% Year-to-date Change: -8.1% | |
| ARE Links: Profile News Message Board | |
| Charts:- Daily , Weekly | |
| Add ARE to Watchlist: View: Get Complete ARE Trend Analysis ➞ | |
 | CIO City Office REIT, Inc. |
| Sector: Financials | |
| SubSector: REIT - Office | |
| MarketCap: 478.566 Millions | |
| Recent Price: 4.32 Smart Investing & Trading Score: 10 | |
| Day Percent Change: -2.26% Day Change: -0.10 | |
| Week Change: -4% Year-to-date Change: -29.3% | |
| CIO Links: Profile News Message Board | |
| Charts:- Daily , Weekly | |
| Add CIO to Watchlist: View: Get Complete CIO Trend Analysis ➞ | |
 | ARR ARMOUR Residential REIT, Inc. |
| Sector: Financials | |
| SubSector: Mortgage Investment | |
| MarketCap: 578.739 Millions | |
| Recent Price: 17.41 Smart Investing & Trading Score: 0 | |
| Day Percent Change: -2.27% Day Change: -0.41 | |
| Week Change: -5.46% Year-to-date Change: -9.9% | |
| ARR Links: Profile News Message Board | |
| Charts:- Daily , Weekly | |
| Add ARR to Watchlist: View: Get Complete ARR Trend Analysis ➞ | |
 | BSBR Banco Santander (Brasil) S.A. |
| Sector: Financials | |
| SubSector: Foreign Regional Banks | |
| MarketCap: 21961.4 Millions | |
| Recent Price: 5.13 Smart Investing & Trading Score: 0 | |
| Day Percent Change: -2.29% Day Change: -0.12 | |
| Week Change: -3.75% Year-to-date Change: -21.7% | |
| BSBR Links: Profile News Message Board | |
| Charts:- Daily , Weekly | |
| Add BSBR to Watchlist: View: Get Complete BSBR Trend Analysis ➞ | |
 | PUK Prudential plc |
| Sector: Financials | |
| SubSector: Life Insurance | |
| MarketCap: 28247.4 Millions | |
| Recent Price: 17.27 Smart Investing & Trading Score: 0 | |
| Day Percent Change: -2.29% Day Change: -0.41 | |
| Week Change: -1.46% Year-to-date Change: -23.1% | |
| PUK Links: Profile News Message Board | |
| Charts:- Daily , Weekly | |
| Add PUK to Watchlist: View: Get Complete PUK Trend Analysis ➞ | |
 | CHMI Cherry Hill Mortgage Investment Corporation |
| Sector: Financials | |
| SubSector: Mortgage Investment | |
| MarketCap: 124.839 Millions | |
| Recent Price: 3.21 Smart Investing & Trading Score: 10 | |
| Day Percent Change: -2.29% Day Change: -0.07 | |
| Week Change: -4.04% Year-to-date Change: -20.7% | |
| CHMI Links: Profile News Message Board | |
| Charts:- Daily , Weekly | |
| Add CHMI to Watchlist: View: Get Complete CHMI Trend Analysis ➞ | |
 | NMRK Newmark Group, Inc. |
| Sector: Financials | |
| SubSector: Property Management | |
| MarketCap: 767.542 Millions | |
| Recent Price: 9.57 Smart Investing & Trading Score: 0 | |
| Day Percent Change: -2.30% Day Change: -0.23 | |
| Week Change: -6.77% Year-to-date Change: -12.6% | |
| NMRK Links: Profile News Message Board | |
| Charts:- Daily , Weekly | |
| Add NMRK to Watchlist: View: Get Complete NMRK Trend Analysis ➞ | |
 | IVR Invesco Mortgage Capital Inc. |
| Sector: Financials | |
| SubSector: Mortgage Investment | |
| MarketCap: 1182.19 Millions | |
| Recent Price: 8.06 Smart Investing & Trading Score: 10 | |
| Day Percent Change: -2.30% Day Change: -0.19 | |
| Week Change: -4.84% Year-to-date Change: -9.0% | |
| IVR Links: Profile News Message Board | |
| Charts:- Daily , Weekly | |
| Add IVR to Watchlist: View: Get Complete IVR Trend Analysis ➞ | |
| For tabular summary view of above stock list: Summary View ➞ 0 - 25 , 25 - 50 , 50 - 75 , 75 - 100 , 100 - 125 , 125 - 150 , 150 - 175 , 175 - 200 , 200 - 225 , 225 - 250 , 250 - 275 , 275 - 300 , 300 - 325 , 325 - 350 , 350 - 375 , 375 - 400 , 400 - 425 , 425 - 450 , 450 - 475 , 475 - 500 , 500 - 525 , 525 - 550 , 550 - 575 , 575 - 600 , 600 - 625 , 625 - 650 , 650 - 675 , 675 - 700 , 700 - 725 , 725 - 750 , 750 - 775 , 775 - 800 , 800 - 825 , 825 - 850 , 850 - 875 , 875 - 900 , 900 - 925 , 925 - 950 , 950 - 975 , 975 - 1000 | ||
| Click To Change The Sort Order: By Market Cap or Company Size Performance: Year-to-date, Week and Day | |
| Select Chart Type: | ||
|
Best Stocks Today 12Stocks.com |
© 2024 12Stocks.com Terms & Conditions Privacy Contact Us
All Information Provided Only For Education And Not To Be Used For Investing or Trading. See Terms & Conditions


One More Thing ... Get Best Stocks Delivered Daily!
Never Ever Miss A Move With Our Top Ten Stocks Lists
Find Best Stocks In Any Market - Bull or Bear Market
Take A Peek At Our Top Ten Stocks Lists: Daily, Weekly, Year-to-Date & Top Trends
Find Best Stocks In Any Market - Bull or Bear Market
Take A Peek At Our Top Ten Stocks Lists: Daily, Weekly, Year-to-Date & Top Trends
Financial Stocks With Best Up Trends [0-bearish to 100-bullish]: Sprott Physical[95], Acadia Realty[93], Medical Properties[93], X [83], Regional Management[83], Mercury General[83], Sprott Physical[83], Sprott Physical[81], Golub Capital[78], Progressive [76], GAMCO Global[76]
Best Financial Stocks Year-to-Date:
Gladstone Capital[89.77%], Banco Macro[67.32%], Grupo Financiero[60.09%], Yiren Digital[58.33%], EverQuote [55.72%], First [51%], Banco BBVA[48.53%], Heritage Insurance[42.18%], GEO [41.97%], Vista Oil[40.04%], Mercury General[38.49%] Best Financial Stocks This Week:
Macatawa Bank[43.48%], Medical Properties[17.54%], ESSA Bancorp[8.38%], Morgan Stanley[4.07%], Citizens [3.65%], Greene County[2.56%], Goldman Sachs[2.52%], LCNB [2.42%], Progressive [2.15%], M&T Bank[2.13%], X [2.11%] Best Financial Stocks Daily:
Macatawa Bank[38.57%], Fanhua [9.73%], CNFinance [4.72%], eHealth [4.41%], Morgan Stanley[3.12%], EZCORP [2.91%], Commerce Bancshares[2.36%], Yiren Digital[2.28%], Hawthorn Bancshares[1.85%], First Capital[1.74%], Gabelli Multimedia[1.33%]