
 Login Sign Up


| |||||
 |  | ||||

| 12Stocks.com Market Intelligence |
Best Financial Stocks
| In a hurry? Financial Stocks Lists: Performance Trends Table, Stock Charts
Sort Financial stocks: Daily, Weekly, Year-to-Date, Market Cap & Trends. Filter Financial stocks list by size:All Financial Large Mid-Range Small & MicroCap |
| 12Stocks.com Financial Stocks Performances & Trends Daily | |||||||||
|
|  The overall Smart Investing & Trading Score is 68 (0-bearish to 100-bullish) which puts Financial sector in short term neutral to bullish trend. The Smart Investing & Trading Score from previous trading session is 75 and hence a deterioration of trend.
| ||||||||
Here are the Smart Investing & Trading Scores of the most requested Financial stocks at 12Stocks.com (click stock name for detailed review):
|


| 12Stocks.com: Investing in Financial sector with Stocks | |
|
The following table helps investors and traders sort through current performance and trends (as measured by Smart Investing & Trading Score) of various
stocks in the Financial sector. Quick View: Move mouse or cursor over stock symbol (ticker) to view short-term Technical chart and over stock name to view long term chart. Click on  to add stock symbol to your watchlist and to add stock symbol to your watchlist and  to view watchlist. Click on any ticker or stock name for detailed market intelligence report for that stock. to view watchlist. Click on any ticker or stock name for detailed market intelligence report for that stock. |
12Stocks.com Performance of Stocks in Financial Sector
| Ticker | Stock Name | Watchlist | Category | Recent Price | Smart Investing & Trading Score | Change % | YTD Change% |
| MTG | MGIC |   | Insurance | 20.35 | 65 | 0.25 | 5.50% |
| FIF | First Trust | | Closed-End Fund - Equity | 18.35 | 80 | 0.25 | 11.48% |
| EXG | Eaton Vance | | Closed-End Fund - Foreign | 7.93 | 53 | 0.25 | 2.72% |
| VPV | Invesco Pennsylvania | | Closed-End Fund - Debt | 9.98 | 32 | 0.25 | -0.15% |
| OCSL | Oaktree Specialty | | Credit Services | 19.69 | 52 | 0.25 | -3.57% |
| ARCC | Ares Capital | | Investments | 20.79 | 100 | 0.24 | 3.79% |
| AGNCN | AGNC | | Mortgage | 25.51 | 48 | 0.24 | 2.74% |
| NCA | Nuveen California | | Closed-End Fund - Debt | 8.75 | 25 | 0.23 | -2.34% |
| MAIN | Main Street | | Investments | 48.80 | 100 | 0.23 | 12.88% |
| EBC | Eastern Bankshares | | Banks Regional | 13.11 | 59 | 0.23 | -7.68% |
| BRKH | Burtech Acquisition | | SPAC | 11.05 | 48 | 0.23 | 2.98% |
| JRVR | James River | | Insurance | 9.28 | 55 | 0.22 | 0.43% |
| BANR | Banner | | Regional Banks | 46.15 | 59 | 0.22 | -13.83% |
| SUI | Sun Communities | | REIT | 120.30 | 59 | 0.22 | -9.99% |
| DHIL | Diamond Hill | | Asset Mgmt | 151.70 | 55 | 0.22 | -8.39% |
| EOD | Wells Fargo | | Closed-End Fund - Equity | 4.54 | 68 | 0.22 | 4.61% |
| NAPR | Innovator Nasdaq | | Exchange Traded Fund | 44.67 | 55 | 0.22 | 0.49% |
| HST | Host Hotels | | REIT | 19.33 | 45 | 0.21 | -0.72% |
| WABC | Westamerica Ban | | Regional Banks | 47.86 | 60 | 0.21 | -15.16% |
| SBSI | Southside Bancshares | | Regional Banks | 28.38 | 59 | 0.21 | -9.39% |
| SCM | Stellus Capital | | Asset Mgmt | 14.17 | 100 | 0.21 | 10.27% |
| VGM | Invesco Trust | | Closed-End Fund - Debt | 9.58 | 44 | 0.21 | -3.13% |
| PNI | PIMCO New | | Closed-End Fund - Debt | 7.17 | 17 | 0.21 | -5.60% |
| ENX | Eaton Vance | | Asset Mgmt | 9.53 | 25 | 0.21 | -1.24% |
| PFEB | Innovator S&P | | Exchange Traded Fund | 33.81 | 66 | 0.21 | 3.52% |
| For chart view version of above stock list: Chart View ➞ 0 - 25 , 25 - 50 , 50 - 75 , 75 - 100 , 100 - 125 , 125 - 150 , 150 - 175 , 175 - 200 , 200 - 225 , 225 - 250 , 250 - 275 , 275 - 300 , 300 - 325 , 325 - 350 , 350 - 375 , 375 - 400 , 400 - 425 , 425 - 450 , 450 - 475 , 475 - 500 , 500 - 525 , 525 - 550 , 550 - 575 , 575 - 600 , 600 - 625 , 625 - 650 , 650 - 675 , 675 - 700 , 700 - 725 , 725 - 750 , 750 - 775 , 775 - 800 , 800 - 825 , 825 - 850 , 850 - 875 , 875 - 900 , 900 - 925 , 925 - 950 , 950 - 975 , 975 - 1000 , 1000 - 1025 , 1025 - 1050 , 1050 - 1075 , 1075 - 1100 , 1100 - 1125 , 1125 - 1150 , 1150 - 1175 , 1175 - 1200 , 1200 - 1225 , 1225 - 1250 | ||
 | Click To Change The Sort Order: By Market Cap or Company Size Performance: Year-to-date, Week and Day |  |
|
Get the most comprehensive stock market coverage daily at 12Stocks.com ➞ Best Stocks Today ➞ Best Stocks Weekly ➞ Best Stocks Year-to-Date ➞ Best Stocks Trends ➞  Best Stocks Today 12Stocks.com Best Nasdaq Stocks ➞ Best S&P 500 Stocks ➞ Best Tech Stocks ➞ Best Biotech Stocks ➞ |
| Detailed Overview of Financial Stocks |
| Financial Technical Overview, Leaders & Laggards, Top Financial ETF Funds & Detailed Financial Stocks List, Charts, Trends & More |
| Financial Sector: Technical Analysis, Trends & YTD Performance | |
| Financial sector is composed of stocks
from banks, brokers, insurance, REITs
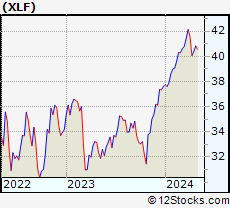
and services subsectors. Financial sector, as represented by XLF, an exchange-traded fund [ETF] that holds basket of Financial stocks (e.g, Bank of America, Goldman Sachs) is up by 9.36% and is currently outperforming the overall market by 3.7% year-to-date. Below is a quick view of Technical charts and trends: |
|
 XLF Weekly Chart |
|
| Long Term Trend: Very Good | |
| Medium Term Trend: Not Good | |
 XLF Daily Chart |
|
| Short Term Trend: Very Good | |
| Overall Trend Score: 68 | |
| YTD Performance: 9.36% | |
| **Trend Scores & Views Are Only For Educational Purposes And Not For Investing | |
| 12Stocks.com: Top Performing Financial Sector Stocks | ||||||||||||||||||||||||||||||||||||||||||||||||
 The top performing Financial sector stocks year to date are
Now, more recently, over last week, the top performing Financial sector stocks on the move are


|
||||||||||||||||||||||||||||||||||||||||||||||||
| 12Stocks.com: Investing in Financial Sector using Exchange Traded Funds | |
|
The following table shows list of key exchange traded funds (ETF) that
help investors track Financial Index. For detailed view, check out our ETF Funds section of our website. Quick View: Move mouse or cursor over ETF symbol (ticker) to view short-term Technical chart and over ETF name to view long term chart. Click on ticker or stock name for detailed view. Click on to add stock symbol to your watchlist and to view watchlist. |
12Stocks.com List of ETFs that track Financial Index
| Ticker | ETF Name | Watchlist | Recent Price | Smart Investing & Trading Score | Change % | Week % | Year-to-date % |
| XLF | Financial | | 41.12 | 68 | -0.02 | 1.83 | 9.36% |
| IAI | Broker-Dealers & Secs | | 112.90 | 75 | -0.18 | 1.68 | 4.03% |
| IYF | Financials | | 92.96 | 68 | -0.20 | 1.82 | 8.84% |
| IYG | Financial Services | | 64.91 | 68 | 0.05 | 2.35 | 8.66% |
| KRE | Regional Banking | | 49.01 | 74 | 0.57 | 3.57 | -6.52% |
| IXG | Global Financials | | 84.46 | 53 | -0.22 | 1.93 | 7.49% |
| VFH | Financials | | 99.72 | 75 | -0.10 | 2.02 | 8.09% |
| KBE | Bank | | 45.96 | 100 | 0.70 | 3.49 | -0.13% |
| FAS | Financial Bull 3X | | 103.20 | 68 | -0.35 | 5.38 | 24.86% |
| FAZ | Financial Bear 3X | | 10.61 | 32 | 0.28 | -5.27 | -22.38% |
| UYG | Financials | | 64.74 | 68 | 0.00 | 3.68 | 17.28% |
| IAT | Regional Banks | | 42.21 | 68 | 0.76 | 3.61 | 0.88% |
| KIE | Insurance | | 49.67 | 58 | -0.16 | 1.2 | 9.84% |
| PSCF | SmallCap Financials | | 47.04 | 58 | 0.19 | 3.45 | -4.35% |
| EUFN | Europe Financials | | 22.42 | 68 | -1.10 | 2.14 | 6.97% |
| PGF | Financial Preferred | | 14.73 | 29 | 0.07 | 1.38 | 1.03% |
| 12Stocks.com: Charts, Trends, Fundamental Data and Performances of Financial Stocks | |
|
We now take in-depth look at all Financial stocks including charts, multi-period performances and overall trends (as measured by Smart Investing & Trading Score). One can sort Financial stocks (click link to choose) by Daily, Weekly and by Year-to-Date performances. Also, one can sort by size of the company or by market capitalization. |
| Select Your Default Chart Type: | |||||
| |||||
| Click on stock symbol or name for detailed view. Click on to add stock symbol to your watchlist and to view watchlist. Quick View: Move mouse or cursor over "Daily" to quickly view daily Technical stock chart and over "Weekly" to view weekly Technical stock chart. | |||||

 | MTG MGIC Investment Corporation |
| Sector: Financials | |
| SubSector: Property & Casualty Insurance | |
| MarketCap: 2521.62 Millions | |
| Recent Price: 20.35 Smart Investing & Trading Score: 65 | |
| Day Percent Change: 0.25% Day Change: 0.05 | |
| Week Change: 2.62% Year-to-date Change: 5.5% | |
| MTG Links: Profile News Message Board | |
| Charts:- Daily , Weekly | |
| Add MTG to Watchlist: View: Get Complete MTG Trend Analysis ➞ | |
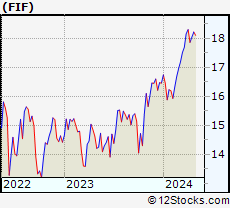 | FIF First Trust Energy Infrastructure Fund |
| Sector: Financials | |
| SubSector: Closed-End Fund - Equity | |
| MarketCap: 135.347 Millions | |
| Recent Price: 18.35 Smart Investing & Trading Score: 80 | |
| Day Percent Change: 0.25% Day Change: 0.05 | |
| Week Change: 1.66% Year-to-date Change: 11.5% | |
| FIF Links: Profile News Message Board | |
| Charts:- Daily , Weekly | |
| Add FIF to Watchlist: View: Get Complete FIF Trend Analysis ➞ | |
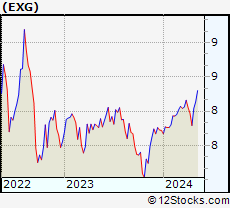 | EXG Eaton Vance Tax-Managed Global Diversified Equity Income Fund |
| Sector: Financials | |
| SubSector: Closed-End Fund - Foreign | |
| MarketCap: 1635.47 Millions | |
| Recent Price: 7.93 Smart Investing & Trading Score: 53 | |
| Day Percent Change: 0.25% Day Change: 0.02 | |
| Week Change: 1.8% Year-to-date Change: 2.7% | |
| EXG Links: Profile News Message Board | |
| Charts:- Daily , Weekly | |
| Add EXG to Watchlist: View: Get Complete EXG Trend Analysis ➞ | |
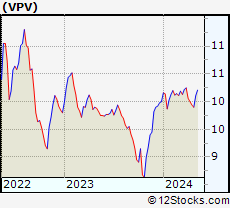 | VPV Invesco Pennsylvania Value Municipal Income Trust |
| Sector: Financials | |
| SubSector: Closed-End Fund - Debt | |
| MarketCap: 250.407 Millions | |
| Recent Price: 9.98 Smart Investing & Trading Score: 32 | |
| Day Percent Change: 0.25% Day Change: 0.02 | |
| Week Change: 0.45% Year-to-date Change: -0.2% | |
| VPV Links: Profile News Message Board | |
| Charts:- Daily , Weekly | |
| Add VPV to Watchlist: View: Get Complete VPV Trend Analysis ➞ | |
 | OCSL Oaktree Specialty Lending Corporation |
| Sector: Financials | |
| SubSector: Credit Services | |
| MarketCap: 353.808 Millions | |
| Recent Price: 19.69 Smart Investing & Trading Score: 52 | |
| Day Percent Change: 0.25% Day Change: 0.05 | |
| Week Change: -0.43% Year-to-date Change: -3.6% | |
| OCSL Links: Profile News Message Board | |
| Charts:- Daily , Weekly | |
| Add OCSL to Watchlist: View: Get Complete OCSL Trend Analysis ➞ | |
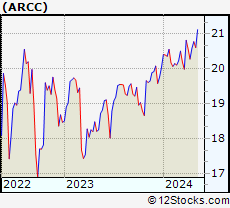 | ARCC Ares Capital Corporation |
| Sector: Financials | |
| SubSector: Diversified Investments | |
| MarketCap: 4478.8 Millions | |
| Recent Price: 20.79 Smart Investing & Trading Score: 100 | |
| Day Percent Change: 0.24% Day Change: 0.05 | |
| Week Change: 0.97% Year-to-date Change: 3.8% | |
| ARCC Links: Profile News Message Board | |
| Charts:- Daily , Weekly | |
| Add ARCC to Watchlist: View: Get Complete ARCC Trend Analysis ➞ | |
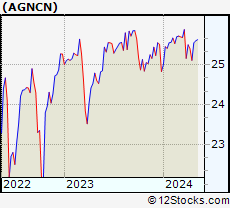 | AGNCN AGNC Investment Corp. |
| Sector: Financials | |
| SubSector: Mortgage Investment | |
| MarketCap: 8280.89 Millions | |
| Recent Price: 25.51 Smart Investing & Trading Score: 48 | |
| Day Percent Change: 0.24% Day Change: 0.06 | |
| Week Change: 1.59% Year-to-date Change: 2.7% | |
| AGNCN Links: Profile News Message Board | |
| Charts:- Daily , Weekly | |
| Add AGNCN to Watchlist: View: Get Complete AGNCN Trend Analysis ➞ | |
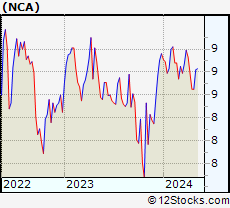 | NCA Nuveen California Municipal Value Fund, Inc. |
| Sector: Financials | |
| SubSector: Closed-End Fund - Debt | |
| MarketCap: 256.107 Millions | |
| Recent Price: 8.75 Smart Investing & Trading Score: 25 | |
| Day Percent Change: 0.23% Day Change: 0.02 | |
| Week Change: 1.16% Year-to-date Change: -2.3% | |
| NCA Links: Profile News Message Board | |
| Charts:- Daily , Weekly | |
| Add NCA to Watchlist: View: Get Complete NCA Trend Analysis ➞ | |
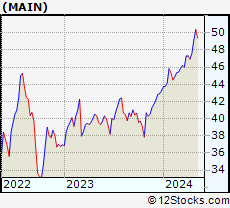 | MAIN Main Street Capital Corporation |
| Sector: Financials | |
| SubSector: Diversified Investments | |
| MarketCap: 1355.7 Millions | |
| Recent Price: 48.80 Smart Investing & Trading Score: 100 | |
| Day Percent Change: 0.23% Day Change: 0.11 | |
| Week Change: 2.48% Year-to-date Change: 12.9% | |
| MAIN Links: Profile News Message Board | |
| Charts:- Daily , Weekly | |
| Add MAIN to Watchlist: View: Get Complete MAIN Trend Analysis ➞ | |
 | EBC Eastern Bankshares, Inc. |
| Sector: Financials | |
| SubSector: Banks Regional | |
| MarketCap: 30057 Millions | |
| Recent Price: 13.11 Smart Investing & Trading Score: 59 | |
| Day Percent Change: 0.23% Day Change: 0.03 | |
| Week Change: 3.68% Year-to-date Change: -7.7% | |
| EBC Links: Profile News Message Board | |
| Charts:- Daily , Weekly | |
| Add EBC to Watchlist: View: Get Complete EBC Trend Analysis ➞ | |
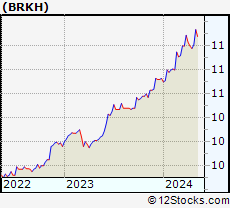 | BRKH Burtech Acquisition Corp. |
| Sector: Financials | |
| SubSector: SPAC | |
| MarketCap: 182 Millions | |
| Recent Price: 11.05 Smart Investing & Trading Score: 48 | |
| Day Percent Change: 0.23% Day Change: 0.03 | |
| Week Change: 0.65% Year-to-date Change: 3.0% | |
| BRKH Links: Profile News Message Board | |
| Charts:- Daily , Weekly | |
| Add BRKH to Watchlist: View: Get Complete BRKH Trend Analysis ➞ | |
 | JRVR James River Group Holdings, Ltd. |
| Sector: Financials | |
| SubSector: Property & Casualty Insurance | |
| MarketCap: 978.312 Millions | |
| Recent Price: 9.28 Smart Investing & Trading Score: 55 | |
| Day Percent Change: 0.22% Day Change: 0.02 | |
| Week Change: -0.64% Year-to-date Change: 0.4% | |
| JRVR Links: Profile News Message Board | |
| Charts:- Daily , Weekly | |
| Add JRVR to Watchlist: View: Get Complete JRVR Trend Analysis ➞ | |
 | BANR Banner Corporation |
| Sector: Financials | |
| SubSector: Regional - Mid-Atlantic Banks | |
| MarketCap: 1187.09 Millions | |
| Recent Price: 46.15 Smart Investing & Trading Score: 59 | |
| Day Percent Change: 0.22% Day Change: 0.10 | |
| Week Change: 2.69% Year-to-date Change: -13.8% | |
| BANR Links: Profile News Message Board | |
| Charts:- Daily , Weekly | |
| Add BANR to Watchlist: View: Get Complete BANR Trend Analysis ➞ | |
 | SUI Sun Communities, Inc. |
| Sector: Financials | |
| SubSector: REIT - Residential | |
| MarketCap: 11280.5 Millions | |
| Recent Price: 120.30 Smart Investing & Trading Score: 59 | |
| Day Percent Change: 0.22% Day Change: 0.26 | |
| Week Change: 2.22% Year-to-date Change: -10.0% | |
| SUI Links: Profile News Message Board | |
| Charts:- Daily , Weekly | |
| Add SUI to Watchlist: View: Get Complete SUI Trend Analysis ➞ | |
 | DHIL Diamond Hill Investment Group, Inc. |
| Sector: Financials | |
| SubSector: Asset Management | |
| MarketCap: 316.203 Millions | |
| Recent Price: 151.70 Smart Investing & Trading Score: 55 | |
| Day Percent Change: 0.22% Day Change: 0.33 | |
| Week Change: 0.58% Year-to-date Change: -8.4% | |
| DHIL Links: Profile News Message Board | |
| Charts:- Daily , Weekly | |
| Add DHIL to Watchlist: View: Get Complete DHIL Trend Analysis ➞ | |
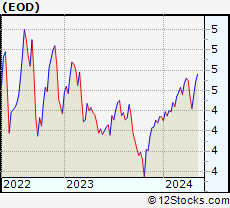 | EOD Wells Fargo Advantage Funds - Wells Fargo Global Dividend Opportunity Fund |
| Sector: Financials | |
| SubSector: Closed-End Fund - Equity | |
| MarketCap: 144.747 Millions | |
| Recent Price: 4.54 Smart Investing & Trading Score: 68 | |
| Day Percent Change: 0.22% Day Change: 0.01 | |
| Week Change: 2.71% Year-to-date Change: 4.6% | |
| EOD Links: Profile News Message Board | |
| Charts:- Daily , Weekly | |
| Add EOD to Watchlist: View: Get Complete EOD Trend Analysis ➞ | |
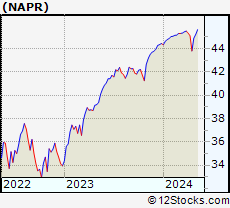 | NAPR Innovator Nasdaq 100 Power Buffer ETF April |
| Sector: Financials | |
| SubSector: Exchange Traded Fund | |
| MarketCap: 60157 Millions | |
| Recent Price: 44.67 Smart Investing & Trading Score: 55 | |
| Day Percent Change: 0.22% Day Change: 0.10 | |
| Week Change: 1.99% Year-to-date Change: 0.5% | |
| NAPR Links: Profile News Message Board | |
| Charts:- Daily , Weekly | |
| Add NAPR to Watchlist: View: Get Complete NAPR Trend Analysis ➞ | |
 | HST Host Hotels & Resorts, Inc. |
| Sector: Financials | |
| SubSector: REIT - Hotel/Motel | |
| MarketCap: 8253.74 Millions | |
| Recent Price: 19.33 Smart Investing & Trading Score: 45 | |
| Day Percent Change: 0.21% Day Change: 0.04 | |
| Week Change: 3.31% Year-to-date Change: -0.7% | |
| HST Links: Profile News Message Board | |
| Charts:- Daily , Weekly | |
| Add HST to Watchlist: View: Get Complete HST Trend Analysis ➞ | |
 | WABC Westamerica Bancorporation |
| Sector: Financials | |
| SubSector: Regional - Pacific Banks | |
| MarketCap: 1557.69 Millions | |
| Recent Price: 47.86 Smart Investing & Trading Score: 60 | |
| Day Percent Change: 0.21% Day Change: 0.10 | |
| Week Change: 2.31% Year-to-date Change: -15.2% | |
| WABC Links: Profile News Message Board | |
| Charts:- Daily , Weekly | |
| Add WABC to Watchlist: View: Get Complete WABC Trend Analysis ➞ | |
 | SBSI Southside Bancshares, Inc. |
| Sector: Financials | |
| SubSector: Regional - Mid-Atlantic Banks | |
| MarketCap: 971.259 Millions | |
| Recent Price: 28.38 Smart Investing & Trading Score: 59 | |
| Day Percent Change: 0.21% Day Change: 0.06 | |
| Week Change: 0.71% Year-to-date Change: -9.4% | |
| SBSI Links: Profile News Message Board | |
| Charts:- Daily , Weekly | |
| Add SBSI to Watchlist: View: Get Complete SBSI Trend Analysis ➞ | |
 | SCM Stellus Capital Investment Corporation |
| Sector: Financials | |
| SubSector: Asset Management | |
| MarketCap: 127.403 Millions | |
| Recent Price: 14.17 Smart Investing & Trading Score: 100 | |
| Day Percent Change: 0.21% Day Change: 0.03 | |
| Week Change: 1.65% Year-to-date Change: 10.3% | |
| SCM Links: Profile News Message Board | |
| Charts:- Daily , Weekly | |
| Add SCM to Watchlist: View: Get Complete SCM Trend Analysis ➞ | |
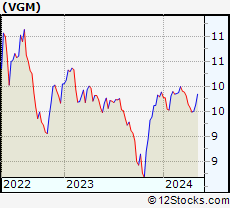 | VGM Invesco Trust for Investment Grade Municipals |
| Sector: Financials | |
| SubSector: Closed-End Fund - Debt | |
| MarketCap: 572.007 Millions | |
| Recent Price: 9.58 Smart Investing & Trading Score: 44 | |
| Day Percent Change: 0.21% Day Change: 0.02 | |
| Week Change: 0.95% Year-to-date Change: -3.1% | |
| VGM Links: Profile News Message Board | |
| Charts:- Daily , Weekly | |
| Add VGM to Watchlist: View: Get Complete VGM Trend Analysis ➞ | |
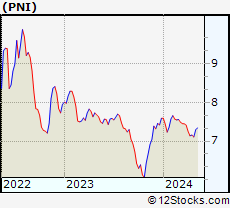 | PNI PIMCO New York Municipal Income Fund II |
| Sector: Financials | |
| SubSector: Closed-End Fund - Debt | |
| MarketCap: 100.707 Millions | |
| Recent Price: 7.17 Smart Investing & Trading Score: 17 | |
| Day Percent Change: 0.21% Day Change: 0.01 | |
| Week Change: 0.07% Year-to-date Change: -5.6% | |
| PNI Links: Profile News Message Board | |
| Charts:- Daily , Weekly | |
| Add PNI to Watchlist: View: Get Complete PNI Trend Analysis ➞ | |
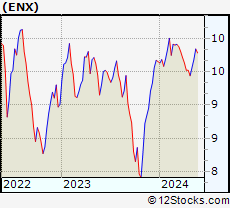 | ENX Eaton Vance New York Municipal Bond Fund |
| Sector: Financials | |
| SubSector: Asset Management | |
| MarketCap: 187.303 Millions | |
| Recent Price: 9.53 Smart Investing & Trading Score: 25 | |
| Day Percent Change: 0.21% Day Change: 0.02 | |
| Week Change: 0.11% Year-to-date Change: -1.2% | |
| ENX Links: Profile News Message Board | |
| Charts:- Daily , Weekly | |
| Add ENX to Watchlist: View: Get Complete ENX Trend Analysis ➞ | |
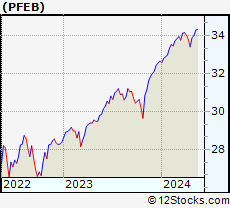 | PFEB Innovator S&P 500 Power Buffer ETF February |
| Sector: Financials | |
| SubSector: Exchange Traded Fund | |
| MarketCap: 60157 Millions | |
| Recent Price: 33.81 Smart Investing & Trading Score: 66 | |
| Day Percent Change: 0.21% Day Change: 0.07 | |
| Week Change: 1.2% Year-to-date Change: 3.5% | |
| PFEB Links: Profile News Message Board | |
| Charts:- Daily , Weekly | |
| Add PFEB to Watchlist: View: Get Complete PFEB Trend Analysis ➞ | |
| For tabular summary view of above stock list: Summary View ➞ 0 - 25 , 25 - 50 , 50 - 75 , 75 - 100 , 100 - 125 , 125 - 150 , 150 - 175 , 175 - 200 , 200 - 225 , 225 - 250 , 250 - 275 , 275 - 300 , 300 - 325 , 325 - 350 , 350 - 375 , 375 - 400 , 400 - 425 , 425 - 450 , 450 - 475 , 475 - 500 , 500 - 525 , 525 - 550 , 550 - 575 , 575 - 600 , 600 - 625 , 625 - 650 , 650 - 675 , 675 - 700 , 700 - 725 , 725 - 750 , 750 - 775 , 775 - 800 , 800 - 825 , 825 - 850 , 850 - 875 , 875 - 900 , 900 - 925 , 925 - 950 , 950 - 975 , 975 - 1000 , 1000 - 1025 , 1025 - 1050 , 1050 - 1075 , 1075 - 1100 , 1100 - 1125 , 1125 - 1150 , 1150 - 1175 , 1175 - 1200 , 1200 - 1225 , 1225 - 1250 | ||
| Click To Change The Sort Order: By Market Cap or Company Size Performance: Year-to-date, Week and Day | |
| Select Chart Type: | ||
|
Best Stocks Today 12Stocks.com |
© 2024 12Stocks.com Terms & Conditions Privacy Contact Us
All Information Provided Only For Education And Not To Be Used For Investing or Trading. See Terms & Conditions


One More Thing ... Get Best Stocks Delivered Daily!
Never Ever Miss A Move With Our Top Ten Stocks Lists
Find Best Stocks In Any Market - Bull or Bear Market
Take A Peek At Our Top Ten Stocks Lists: Daily, Weekly, Year-to-Date & Top Trends
Find Best Stocks In Any Market - Bull or Bear Market
Take A Peek At Our Top Ten Stocks Lists: Daily, Weekly, Year-to-Date & Top Trends
Financial Stocks With Best Up Trends [0-bearish to 100-bullish]: B. Riley[100], Trustmark [100], Synchrony [100], MBIA [100], Kemper [100], Virtu [100], East West[100], Equity Residential[100], Essex Property[100], BOK [100], Cullen/Frost Bankers[100]
Best Financial Stocks Year-to-Date:
Root [473.26%], Hippo [130.79%], Gladstone Capital[98.5%], Banco Macro[70.66%], Grupo Financiero[68.38%], Yiren Digital[62.82%], Banco BBVA[62.68%], Heritage Insurance[61.04%], EverQuote [59.4%], Fidelis Insurance[55.01%], First [52.08%] Best Financial Stocks This Week:
B. Riley[48.82%], Oportun [39.66%], Cipher Mining[22.14%], Globe Life[17.77%], Root [16%], Sierra Bancorp[11.47%], Provident Bancorp[10.91%], TOP [10.64%], Trustmark [9.84%], LendingTree [9.84%], Coinbase Global[9.74%] Best Financial Stocks Daily:
B. Riley[36.97%], CoStar [8.66%], Offerpad [7.14%], Pegasus Digital[6.93%], Trustmark [6.57%], Provident Bancorp[6.54%], Waterstone [6.41%], EverQuote [5.46%], Stock Yards[5.30%], Trupanion [5.10%], Bank of N.T. Butterfield & Son[5.09%]