
 Login Sign Up


| |||||
 |  | ||||

| 12Stocks.com Market Intelligence |
Best Financial Stocks
| In a hurry? Financial Stocks Lists: Performance Trends Table, Stock Charts
Sort Financial stocks: Daily, Weekly, Year-to-Date, Market Cap & Trends. Filter Financial stocks list by size:All Financial Large Mid-Range Small & MicroCap |
| 12Stocks.com Financial Stocks Performances & Trends Daily | |||||||||
|
|  The overall Smart Investing & Trading Score is 68 (0-bearish to 100-bullish) which puts Financial sector in short term neutral to bullish trend. The Smart Investing & Trading Score from previous trading session is 75 and hence a deterioration of trend.
| ||||||||
Here are the Smart Investing & Trading Scores of the most requested Financial stocks at 12Stocks.com (click stock name for detailed review):
|


| 12Stocks.com: Investing in Financial sector with Stocks | |
|
The following table helps investors and traders sort through current performance and trends (as measured by Smart Investing & Trading Score) of various
stocks in the Financial sector. Quick View: Move mouse or cursor over stock symbol (ticker) to view short-term Technical chart and over stock name to view long term chart. Click on  to add stock symbol to your watchlist and to add stock symbol to your watchlist and  to view watchlist. Click on any ticker or stock name for detailed market intelligence report for that stock. to view watchlist. Click on any ticker or stock name for detailed market intelligence report for that stock. |
12Stocks.com Performance of Stocks in Financial Sector
| Ticker | Stock Name | Watchlist | Category | Recent Price | Smart Investing & Trading Score | Change % | YTD Change% |
| PECO | Phillips Edison |   | REIT - Retail | 33.15 | 35 | -0.99 | -9.99% |
| CM | Canadian Imperial | | Banks | 47.54 | 49 | -1.00 | -1.25% |
| NHS | Neuberger Berman | | Asset Mgmt | 7.93 | 55 | -1.00 | 2.72% |
| MFG | Mizuho | | Foreign Banks | 3.91 | 59 | -1.01 | 13.66% |
| HCI | HCI | | Insurance | 113.63 | 78 | -1.01 | 30.01% |
| BWG | Legg Mason | | Closed-End Fund - Debt | 7.91 | 10 | -1.01 | -5.33% |
| PDLB | PDL Community | | REIT - Retail | 8.36 | 42 | -1.01 | -14.40% |
| STC | Stewart Information | | Insurance | 62.95 | 78 | -1.02 | 7.15% |
| FOR | Forestar | | Real Estatet | 31.15 | 30 | -1.02 | -5.81% |
| ACNB | ACNB | | Regional - Southwest Banks | 33.90 | 42 | -1.02 | -24.26% |
| FBRT | Franklin BSP | | REIT - Mortgage | 12.62 | 80 | -1.02 | -7.40% |
| TPG | TPG | | Asset Mgmt | 43.69 | 58 | -1.02 | 0.98% |
| BCS | Barclays | | Foreign Banks | 9.60 | 75 | -1.03 | 21.83% |
| EFC | Ellington | | Mortgage | 11.55 | 74 | -1.03 | -9.13% |
| MCB | Metropolitan Bank | | Regional Banks | 42.25 | 67 | -1.03 | -23.71% |
| BAM | Brookfield Asset | | Real Estatet | 39.18 | 37 | -1.04 | -2.46% |
| BMO | Bank of Montreal | | Banks | 92.84 | 28 | -1.04 | -6.17% |
| BNS | Bank of Nova Scotia | | Banks | 46.80 | 36 | -1.04 | -3.88% |
| CHI | Calamos Convertible | | Closed-End Fund - Debt | 10.98 | 63 | -1.04 | 6.03% |
| ROIC | Retail Opportunity | | REIT - Retail | 12.40 | 74 | -1.04 | -11.62% |
| WSR | Whitestone REIT | | REIT - Retail | 11.38 | 42 | -1.04 | -7.40% |
| TPVG | TriplePoint Venture | | Closed-End Fund - Equity | 9.53 | 55 | -1.04 | -12.25% |
| PAXS | PIMCO Access | | Closed-End Fund - Debt | 15.24 | 75 | -1.04 | 5.61% |
| UNTY | Unity Bancorp | | Banks | 27.22 | 57 | -1.05 | -8.01% |
| KW | Kennedy-Wilson | | Property Mgmt | 8.49 | 42 | -1.05 | -31.42% |
| For chart view version of above stock list: Chart View ➞ 0 - 25 , 25 - 50 , 50 - 75 , 75 - 100 , 100 - 125 , 125 - 150 , 150 - 175 , 175 - 200 , 200 - 225 , 225 - 250 , 250 - 275 , 275 - 300 , 300 - 325 , 325 - 350 , 350 - 375 , 375 - 400 , 400 - 425 , 425 - 450 , 450 - 475 , 475 - 500 , 500 - 525 , 525 - 550 , 550 - 575 , 575 - 600 , 600 - 625 , 625 - 650 , 650 - 675 , 675 - 700 , 700 - 725 , 725 - 750 , 750 - 775 , 775 - 800 , 800 - 825 , 825 - 850 , 850 - 875 , 875 - 900 , 900 - 925 , 925 - 950 , 950 - 975 , 975 - 1000 , 1000 - 1025 , 1025 - 1050 , 1050 - 1075 , 1075 - 1100 , 1100 - 1125 , 1125 - 1150 , 1150 - 1175 , 1175 - 1200 , 1200 - 1225 , 1225 - 1250 | ||
 | Click To Change The Sort Order: By Market Cap or Company Size Performance: Year-to-date, Week and Day |  |
|
Get the most comprehensive stock market coverage daily at 12Stocks.com ➞ Best Stocks Today ➞ Best Stocks Weekly ➞ Best Stocks Year-to-Date ➞ Best Stocks Trends ➞  Best Stocks Today 12Stocks.com Best Nasdaq Stocks ➞ Best S&P 500 Stocks ➞ Best Tech Stocks ➞ Best Biotech Stocks ➞ |
| Detailed Overview of Financial Stocks |
| Financial Technical Overview, Leaders & Laggards, Top Financial ETF Funds & Detailed Financial Stocks List, Charts, Trends & More |
| Financial Sector: Technical Analysis, Trends & YTD Performance | |
| Financial sector is composed of stocks
from banks, brokers, insurance, REITs
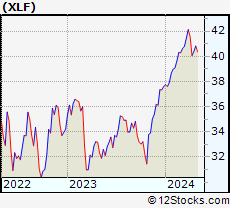
and services subsectors. Financial sector, as represented by XLF, an exchange-traded fund [ETF] that holds basket of Financial stocks (e.g, Bank of America, Goldman Sachs) is up by 9.36% and is currently outperforming the overall market by 3.7% year-to-date. Below is a quick view of Technical charts and trends: |
|
 XLF Weekly Chart |
|
| Long Term Trend: Very Good | |
| Medium Term Trend: Not Good | |
 XLF Daily Chart |
|
| Short Term Trend: Very Good | |
| Overall Trend Score: 68 | |
| YTD Performance: 9.36% | |
| **Trend Scores & Views Are Only For Educational Purposes And Not For Investing | |
| 12Stocks.com: Top Performing Financial Sector Stocks | ||||||||||||||||||||||||||||||||||||||||||||||||
 The top performing Financial sector stocks year to date are
Now, more recently, over last week, the top performing Financial sector stocks on the move are


|
||||||||||||||||||||||||||||||||||||||||||||||||
| 12Stocks.com: Investing in Financial Sector using Exchange Traded Funds | |
|
The following table shows list of key exchange traded funds (ETF) that
help investors track Financial Index. For detailed view, check out our ETF Funds section of our website. Quick View: Move mouse or cursor over ETF symbol (ticker) to view short-term Technical chart and over ETF name to view long term chart. Click on ticker or stock name for detailed view. Click on to add stock symbol to your watchlist and to view watchlist. |
12Stocks.com List of ETFs that track Financial Index
| Ticker | ETF Name | Watchlist | Recent Price | Smart Investing & Trading Score | Change % | Week % | Year-to-date % |
| XLF | Financial | | 41.12 | 68 | -0.02 | 1.83 | 9.36% |
| IAI | Broker-Dealers & Secs | | 112.90 | 75 | -0.18 | 1.68 | 4.03% |
| IYF | Financials | | 92.96 | 68 | -0.20 | 1.82 | 8.84% |
| IYG | Financial Services | | 64.92 | 68 | 0.07 | 2.37 | 8.69% |
| KRE | Regional Banking | | 49.01 | 74 | 0.57 | 3.57 | -6.52% |
| IXG | Global Financials | | 84.19 | 53 | -0.54 | 1.61 | 7.14% |
| VFH | Financials | | 99.72 | 75 | -0.10 | 2.02 | 8.09% |
| KBE | Bank | | 45.96 | 100 | 0.70 | 3.49 | -0.13% |
| FAS | Financial Bull 3X | | 103.20 | 68 | -0.35 | 5.38 | 24.86% |
| FAZ | Financial Bear 3X | | 10.61 | 32 | 0.28 | -5.27 | -22.38% |
| UYG | Financials | | 64.47 | 68 | -0.42 | 3.25 | 16.79% |
| IAT | Regional Banks | | 42.21 | 68 | 0.76 | 3.61 | 0.88% |
| KIE | Insurance | | 49.67 | 58 | -0.16 | 1.2 | 9.84% |
| PSCF | SmallCap Financials | | 46.98 | 58 | 0.07 | 3.33 | -4.46% |
| EUFN | Europe Financials | | 22.42 | 68 | -1.10 | 2.14 | 6.97% |
| PGF | Financial Preferred | | 14.73 | 29 | 0.07 | 1.38 | 1.03% |
| 12Stocks.com: Charts, Trends, Fundamental Data and Performances of Financial Stocks | |
|
We now take in-depth look at all Financial stocks including charts, multi-period performances and overall trends (as measured by Smart Investing & Trading Score). One can sort Financial stocks (click link to choose) by Daily, Weekly and by Year-to-Date performances. Also, one can sort by size of the company or by market capitalization. |
| Select Your Default Chart Type: | |||||
| |||||
| Click on stock symbol or name for detailed view. Click on to add stock symbol to your watchlist and to view watchlist. Quick View: Move mouse or cursor over "Daily" to quickly view daily Technical stock chart and over "Weekly" to view weekly Technical stock chart. | |||||

 | PECO Phillips Edison & Company, Inc. |
| Sector: Financials | |
| SubSector: REIT - Retail | |
| MarketCap: 3920 Millions | |
| Recent Price: 33.15 Smart Investing & Trading Score: 35 | |
| Day Percent Change: -0.99% Day Change: -0.33 | |
| Week Change: 0.39% Year-to-date Change: -10.0% | |
| PECO Links: Profile News Message Board | |
| Charts:- Daily , Weekly | |
| Add PECO to Watchlist: View: Get Complete PECO Trend Analysis ➞ | |
 | CM Canadian Imperial Bank of Commerce |
| Sector: Financials | |
| SubSector: Money Center Banks | |
| MarketCap: 27150.5 Millions | |
| Recent Price: 47.54 Smart Investing & Trading Score: 49 | |
| Day Percent Change: -1.00% Day Change: -0.48 | |
| Week Change: -0.06% Year-to-date Change: -1.3% | |
| CM Links: Profile News Message Board | |
| Charts:- Daily , Weekly | |
| Add CM to Watchlist: View: Get Complete CM Trend Analysis ➞ | |
 | NHS Neuberger Berman High Yield Strategies Fund Inc. |
| Sector: Financials | |
| SubSector: Asset Management | |
| MarketCap: 147.303 Millions | |
| Recent Price: 7.93 Smart Investing & Trading Score: 55 | |
| Day Percent Change: -1.00% Day Change: -0.08 | |
| Week Change: 0.38% Year-to-date Change: 2.7% | |
| NHS Links: Profile News Message Board | |
| Charts:- Daily , Weekly | |
| Add NHS to Watchlist: View: Get Complete NHS Trend Analysis ➞ | |
 | MFG Mizuho Financial Group, Inc. |
| Sector: Financials | |
| SubSector: Foreign Regional Banks | |
| MarketCap: 27893.1 Millions | |
| Recent Price: 3.91 Smart Investing & Trading Score: 59 | |
| Day Percent Change: -1.01% Day Change: -0.04 | |
| Week Change: 1.56% Year-to-date Change: 13.7% | |
| MFG Links: Profile News Message Board | |
| Charts:- Daily , Weekly | |
| Add MFG to Watchlist: View: Get Complete MFG Trend Analysis ➞ | |
 | HCI HCI Group, Inc. |
| Sector: Financials | |
| SubSector: Property & Casualty Insurance | |
| MarketCap: 297.412 Millions | |
| Recent Price: 113.63 Smart Investing & Trading Score: 78 | |
| Day Percent Change: -1.01% Day Change: -1.16 | |
| Week Change: 1.56% Year-to-date Change: 30.0% | |
| HCI Links: Profile News Message Board | |
| Charts:- Daily , Weekly | |
| Add HCI to Watchlist: View: Get Complete HCI Trend Analysis ➞ | |
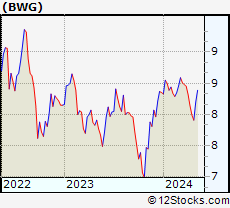 | BWG Legg Mason BW Global Income Opportunities Fund Inc. |
| Sector: Financials | |
| SubSector: Closed-End Fund - Debt | |
| MarketCap: 204.607 Millions | |
| Recent Price: 7.91 Smart Investing & Trading Score: 10 | |
| Day Percent Change: -1.01% Day Change: -0.08 | |
| Week Change: -1% Year-to-date Change: -5.3% | |
| BWG Links: Profile News Message Board | |
| Charts:- Daily , Weekly | |
| Add BWG to Watchlist: View: Get Complete BWG Trend Analysis ➞ | |
 | PDLB PDL Community Bancorp |
| Sector: Financials | |
| SubSector: REIT - Retail | |
| MarketCap: 206.114 Millions | |
| Recent Price: 8.36 Smart Investing & Trading Score: 42 | |
| Day Percent Change: -1.01% Day Change: -0.08 | |
| Week Change: 0.06% Year-to-date Change: -14.4% | |
| PDLB Links: Profile News Message Board | |
| Charts:- Daily , Weekly | |
| Add PDLB to Watchlist: View: Get Complete PDLB Trend Analysis ➞ | |
 | STC Stewart Information Services Corporation |
| Sector: Financials | |
| SubSector: Property & Casualty Insurance | |
| MarketCap: 629.912 Millions | |
| Recent Price: 62.95 Smart Investing & Trading Score: 78 | |
| Day Percent Change: -1.02% Day Change: -0.65 | |
| Week Change: 4.02% Year-to-date Change: 7.2% | |
| STC Links: Profile News Message Board | |
| Charts:- Daily , Weekly | |
| Add STC to Watchlist: View: Get Complete STC Trend Analysis ➞ | |
 | FOR Forestar Group Inc. |
| Sector: Financials | |
| SubSector: Real Estate Development | |
| MarketCap: 661.019 Millions | |
| Recent Price: 31.15 Smart Investing & Trading Score: 30 | |
| Day Percent Change: -1.02% Day Change: -0.32 | |
| Week Change: -1.46% Year-to-date Change: -5.8% | |
| FOR Links: Profile News Message Board | |
| Charts:- Daily , Weekly | |
| Add FOR to Watchlist: View: Get Complete FOR Trend Analysis ➞ | |
 | ACNB ACNB Corporation |
| Sector: Financials | |
| SubSector: Regional - Southwest Banks | |
| MarketCap: 231.065 Millions | |
| Recent Price: 33.90 Smart Investing & Trading Score: 42 | |
| Day Percent Change: -1.02% Day Change: -0.35 | |
| Week Change: 4.34% Year-to-date Change: -24.3% | |
| ACNB Links: Profile News Message Board | |
| Charts:- Daily , Weekly | |
| Add ACNB to Watchlist: View: Get Complete ACNB Trend Analysis ➞ | |
 | FBRT Franklin BSP Realty Trust, Inc. |
| Sector: Financials | |
| SubSector: REIT - Mortgage | |
| MarketCap: 1170 Millions | |
| Recent Price: 12.62 Smart Investing & Trading Score: 80 | |
| Day Percent Change: -1.02% Day Change: -0.13 | |
| Week Change: 0.4% Year-to-date Change: -7.4% | |
| FBRT Links: Profile News Message Board | |
| Charts:- Daily , Weekly | |
| Add FBRT to Watchlist: View: Get Complete FBRT Trend Analysis ➞ | |
 | TPG TPG Inc. |
| Sector: Financials | |
| SubSector: Asset Management | |
| MarketCap: 8700 Millions | |
| Recent Price: 43.69 Smart Investing & Trading Score: 58 | |
| Day Percent Change: -1.02% Day Change: -0.45 | |
| Week Change: 2.85% Year-to-date Change: 1.0% | |
| TPG Links: Profile News Message Board | |
| Charts:- Daily , Weekly | |
| Add TPG to Watchlist: View: Get Complete TPG Trend Analysis ➞ | |
 | BCS Barclays PLC |
| Sector: Financials | |
| SubSector: Foreign Money Center Banks | |
| MarketCap: 21013.4 Millions | |
| Recent Price: 9.60 Smart Investing & Trading Score: 75 | |
| Day Percent Change: -1.03% Day Change: -0.10 | |
| Week Change: 2.67% Year-to-date Change: 21.8% | |
| BCS Links: Profile News Message Board | |
| Charts:- Daily , Weekly | |
| Add BCS to Watchlist: View: Get Complete BCS Trend Analysis ➞ | |
 | EFC Ellington Financial Inc. |
| Sector: Financials | |
| SubSector: Mortgage Investment | |
| MarketCap: 380.239 Millions | |
| Recent Price: 11.55 Smart Investing & Trading Score: 74 | |
| Day Percent Change: -1.03% Day Change: -0.12 | |
| Week Change: 1.14% Year-to-date Change: -9.1% | |
| EFC Links: Profile News Message Board | |
| Charts:- Daily , Weekly | |
| Add EFC to Watchlist: View: Get Complete EFC Trend Analysis ➞ | |
 | MCB Metropolitan Bank Holding Corp. |
| Sector: Financials | |
| SubSector: Regional - Northeast Banks | |
| MarketCap: 212.999 Millions | |
| Recent Price: 42.25 Smart Investing & Trading Score: 67 | |
| Day Percent Change: -1.03% Day Change: -0.44 | |
| Week Change: 8.17% Year-to-date Change: -23.7% | |
| MCB Links: Profile News Message Board | |
| Charts:- Daily , Weekly | |
| Add MCB to Watchlist: View: Get Complete MCB Trend Analysis ➞ | |
 | BAM Brookfield Asset Management Inc. |
| Sector: Financials | |
| SubSector: Real Estate Development | |
| MarketCap: 47134.9 Millions | |
| Recent Price: 39.18 Smart Investing & Trading Score: 37 | |
| Day Percent Change: -1.04% Day Change: -0.41 | |
| Week Change: 2.24% Year-to-date Change: -2.5% | |
| BAM Links: Profile News Message Board | |
| Charts:- Daily , Weekly | |
| Add BAM to Watchlist: View: Get Complete BAM Trend Analysis ➞ | |
 | BMO Bank of Montreal |
| Sector: Financials | |
| SubSector: Money Center Banks | |
| MarketCap: 32830.2 Millions | |
| Recent Price: 92.84 Smart Investing & Trading Score: 28 | |
| Day Percent Change: -1.04% Day Change: -0.98 | |
| Week Change: 0.76% Year-to-date Change: -6.2% | |
| BMO Links: Profile News Message Board | |
| Charts:- Daily , Weekly | |
| Add BMO to Watchlist: View: Get Complete BMO Trend Analysis ➞ | |
 | BNS The Bank of Nova Scotia |
| Sector: Financials | |
| SubSector: Money Center Banks | |
| MarketCap: 48742.1 Millions | |
| Recent Price: 46.80 Smart Investing & Trading Score: 36 | |
| Day Percent Change: -1.04% Day Change: -0.49 | |
| Week Change: 0.13% Year-to-date Change: -3.9% | |
| BNS Links: Profile News Message Board | |
| Charts:- Daily , Weekly | |
| Add BNS to Watchlist: View: Get Complete BNS Trend Analysis ➞ | |
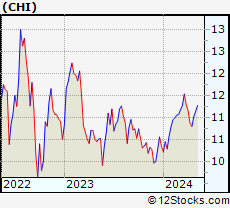 | CHI Calamos Convertible Opportunities and Income Fund |
| Sector: Financials | |
| SubSector: Closed-End Fund - Debt | |
| MarketCap: 503.507 Millions | |
| Recent Price: 10.98 Smart Investing & Trading Score: 63 | |
| Day Percent Change: -1.04% Day Change: -0.12 | |
| Week Change: 1.67% Year-to-date Change: 6.0% | |
| CHI Links: Profile News Message Board | |
| Charts:- Daily , Weekly | |
| Add CHI to Watchlist: View: Get Complete CHI Trend Analysis ➞ | |
 | ROIC Retail Opportunity Investments Corp. |
| Sector: Financials | |
| SubSector: REIT - Retail | |
| MarketCap: 943.414 Millions | |
| Recent Price: 12.40 Smart Investing & Trading Score: 74 | |
| Day Percent Change: -1.04% Day Change: -0.13 | |
| Week Change: 0.98% Year-to-date Change: -11.6% | |
| ROIC Links: Profile News Message Board | |
| Charts:- Daily , Weekly | |
| Add ROIC to Watchlist: View: Get Complete ROIC Trend Analysis ➞ | |
 | WSR Whitestone REIT |
| Sector: Financials | |
| SubSector: REIT - Retail | |
| MarketCap: 316.114 Millions | |
| Recent Price: 11.38 Smart Investing & Trading Score: 42 | |
| Day Percent Change: -1.04% Day Change: -0.12 | |
| Week Change: 1.43% Year-to-date Change: -7.4% | |
| WSR Links: Profile News Message Board | |
| Charts:- Daily , Weekly | |
| Add WSR to Watchlist: View: Get Complete WSR Trend Analysis ➞ | |
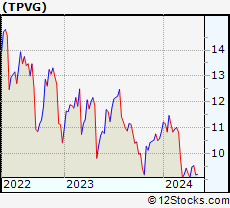 | TPVG TriplePoint Venture Growth BDC Corp. |
| Sector: Financials | |
| SubSector: Closed-End Fund - Equity | |
| MarketCap: 158.147 Millions | |
| Recent Price: 9.53 Smart Investing & Trading Score: 55 | |
| Day Percent Change: -1.04% Day Change: -0.10 | |
| Week Change: 0.32% Year-to-date Change: -12.3% | |
| TPVG Links: Profile News Message Board | |
| Charts:- Daily , Weekly | |
| Add TPVG to Watchlist: View: Get Complete TPVG Trend Analysis ➞ | |
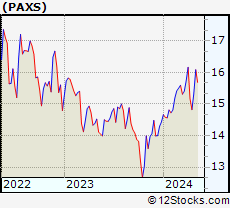 | PAXS PIMCO Access Income Fund |
| Sector: Financials | |
| SubSector: Closed-End Fund - Debt | |
| MarketCap: 649 Millions | |
| Recent Price: 15.24 Smart Investing & Trading Score: 75 | |
| Day Percent Change: -1.04% Day Change: -0.16 | |
| Week Change: 2.83% Year-to-date Change: 5.6% | |
| PAXS Links: Profile News Message Board | |
| Charts:- Daily , Weekly | |
| Add PAXS to Watchlist: View: Get Complete PAXS Trend Analysis ➞ | |
 | UNTY Unity Bancorp, Inc. |
| Sector: Financials | |
| SubSector: Money Center Banks | |
| MarketCap: 149.099 Millions | |
| Recent Price: 27.22 Smart Investing & Trading Score: 57 | |
| Day Percent Change: -1.05% Day Change: -0.29 | |
| Week Change: 1.15% Year-to-date Change: -8.0% | |
| UNTY Links: Profile News Message Board | |
| Charts:- Daily , Weekly | |
| Add UNTY to Watchlist: View: Get Complete UNTY Trend Analysis ➞ | |
 | KW Kennedy-Wilson Holdings, Inc. |
| Sector: Financials | |
| SubSector: Property Management | |
| MarketCap: 2025.42 Millions | |
| Recent Price: 8.49 Smart Investing & Trading Score: 42 | |
| Day Percent Change: -1.05% Day Change: -0.09 | |
| Week Change: -0.12% Year-to-date Change: -31.4% | |
| KW Links: Profile News Message Board | |
| Charts:- Daily , Weekly | |
| Add KW to Watchlist: View: Get Complete KW Trend Analysis ➞ | |
| For tabular summary view of above stock list: Summary View ➞ 0 - 25 , 25 - 50 , 50 - 75 , 75 - 100 , 100 - 125 , 125 - 150 , 150 - 175 , 175 - 200 , 200 - 225 , 225 - 250 , 250 - 275 , 275 - 300 , 300 - 325 , 325 - 350 , 350 - 375 , 375 - 400 , 400 - 425 , 425 - 450 , 450 - 475 , 475 - 500 , 500 - 525 , 525 - 550 , 550 - 575 , 575 - 600 , 600 - 625 , 625 - 650 , 650 - 675 , 675 - 700 , 700 - 725 , 725 - 750 , 750 - 775 , 775 - 800 , 800 - 825 , 825 - 850 , 850 - 875 , 875 - 900 , 900 - 925 , 925 - 950 , 950 - 975 , 975 - 1000 , 1000 - 1025 , 1025 - 1050 , 1050 - 1075 , 1075 - 1100 , 1100 - 1125 , 1125 - 1150 , 1150 - 1175 , 1175 - 1200 , 1200 - 1225 , 1225 - 1250 | ||
| Click To Change The Sort Order: By Market Cap or Company Size Performance: Year-to-date, Week and Day | |
| Select Chart Type: | ||
|
Best Stocks Today 12Stocks.com |
© 2024 12Stocks.com Terms & Conditions Privacy Contact Us
All Information Provided Only For Education And Not To Be Used For Investing or Trading. See Terms & Conditions


One More Thing ... Get Best Stocks Delivered Daily!
Never Ever Miss A Move With Our Top Ten Stocks Lists
Find Best Stocks In Any Market - Bull or Bear Market
Take A Peek At Our Top Ten Stocks Lists: Daily, Weekly, Year-to-Date & Top Trends
Find Best Stocks In Any Market - Bull or Bear Market
Take A Peek At Our Top Ten Stocks Lists: Daily, Weekly, Year-to-Date & Top Trends
Financial Stocks With Best Up Trends [0-bearish to 100-bullish]: B. Riley[100], Trustmark [100], Synchrony [100], MBIA [100], Kemper [100], Virtu [100], East West[100], Equity Residential[100], Essex Property[100], Cullen/Frost Bankers[100], BOK [100]
Best Financial Stocks Year-to-Date:
Root [473.26%], Hippo [130.79%], Gladstone Capital[98.6%], Banco Macro[70.66%], Grupo Financiero[68.49%], Yiren Digital[62.82%], Banco BBVA[62.68%], Heritage Insurance[61.04%], EverQuote [59.56%], Fidelis Insurance[55.01%], First [52%] Best Financial Stocks This Week:
B. Riley[49.37%], Oportun [39.66%], Cipher Mining[22.14%], Globe Life[17.77%], Root [16%], Sierra Bancorp[11.2%], TOP [10.64%], Provident Bancorp[10.27%], LendingTree [9.82%], Coinbase Global[9.74%], Trustmark [9.73%] Best Financial Stocks Daily:
B. Riley[37.48%], CoStar [8.74%], Offerpad [7.14%], Pegasus Digital[6.93%], Waterstone [6.80%], Trustmark [6.46%], Provident Bancorp[5.92%], EverQuote [5.57%], Trupanion [5.23%], Stock Yards[5.12%], Bank of N.T. Butterfield & Son[5.09%]