
 Login Sign Up


| |||||
 |  | ||||

| 12Stocks.com Market Intelligence |
Best Financial Stocks
| In a hurry? Financial Stocks Lists: Performance Trends Table, Stock Charts
Sort Financial stocks: Daily, Weekly, Year-to-Date, Market Cap & Trends. Filter Financial stocks list by size:All Financial Large Mid-Range Small & MicroCap |
| 12Stocks.com Financial Stocks Performances & Trends Daily | |||||||||
|
|  The overall Smart Investing & Trading Score is 56 (0-bearish to 100-bullish) which puts Financial sector in short term neutral trend. The Smart Investing & Trading Score from previous trading session is 68 and hence a deterioration of trend.
| ||||||||
Here are the Smart Investing & Trading Scores of the most requested Financial stocks at 12Stocks.com (click stock name for detailed review):
|


| 12Stocks.com: Investing in Financial sector with Stocks | |
|
The following table helps investors and traders sort through current performance and trends (as measured by Smart Investing & Trading Score) of various
stocks in the Financial sector. Quick View: Move mouse or cursor over stock symbol (ticker) to view short-term Technical chart and over stock name to view long term chart. Click on  to add stock symbol to your watchlist and to add stock symbol to your watchlist and  to view watchlist. Click on any ticker or stock name for detailed market intelligence report for that stock. to view watchlist. Click on any ticker or stock name for detailed market intelligence report for that stock. |
12Stocks.com Performance of Stocks in Financial Sector
| Ticker | Stock Name | Watchlist | Category | Recent Price | Smart Investing & Trading Score | Change % | YTD Change% |
| AMTB | Amerant Bancorp |   | Regional Banks | 22.08 | 60 | -2.82 | -10.13% |
| TREE | LendingTree | | Mortgage | 36.43 | 56 | -2.83 | 20.15% |
| HFWA | Heritage | | Regional Banks | 18.09 | 67 | -2.85 | -15.43% |
| AMK | AssetMark | | Asset Mgmt | 33.89 | 61 | -2.89 | 13.16% |
| OVLY | Oak Valley | | Regional Banks | 24.07 | 57 | -2.90 | -19.63% |
| BHF | Brighthouse | | Life Insurance | 49.03 | 44 | -2.91 | -7.35% |
| BBU | Brookfield Business | | Real Estatet | 19.00 | 15 | -2.96 | -7.68% |
| ECPG | Encore Capital | | Asset Mgmt | 41.76 | 20 | -3.00 | -17.71% |
| EIG | Employers | | Insurance | 43.51 | 88 | -3.10 | 10.43% |
| PAI | Western Asset | | Closed-End Fund - Debt | 11.73 | 32 | -3.12 | -2.56% |
| BCBP | BCB Bancorp | | Regional Banks | 9.44 | 37 | -3.18 | -26.54% |
| INN | Summit Hotel | | Real Estatet | 6.07 | 45 | -3.19 | -9.67% |
| SAFT | Safety Insurance | | Insurance | 79.05 | 55 | -3.23 | 4.03% |
| BXMT | Blackstone Mortgage | | Mortgage | 17.65 | 0 | -3.29 | -17.02% |
| BOKF | BOK | | Regional - Southwest Banks | 89.96 | 100 | -3.32 | 5.03% |
| HPF | John Hancock | | Closed-End Fund - Debt | 16.31 | 93 | -3.38 | 3.36% |
| CVBF | CVB | | Regional Banks | 16.51 | 93 | -3.39 | -18.23% |
| OPRT | Oportun | | Credit Services | 3.13 | 67 | -3.40 | -19.95% |
| ESSA | ESSA Bancorp | | S&L | 16.27 | 28 | -3.41 | -18.71% |
| LND | BrasilAgro - | | Property Mgmt | 4.82 | 35 | -3.41 | -8.71% |
| COIN | Coinbase Global | | Financial Data & Stock Exchanges | 223.61 | 41 | -3.43 | 29.41% |
| ONL | Orion Office | | REIT - Office | 3.24 | 74 | -3.43 | -43.36% |
| SLQT | SelectQuote | | Insurance | 1.54 | 31 | -3.44 | 12.77% |
| AWH | Allied World | | Insurance | 3.28 | 32 | -3.53 | -19.61% |
| SAFE | Safehold | | REIT - | 18.34 | 27 | -3.58 | -21.62% |
| For chart view version of above stock list: Chart View ➞ 0 - 25 , 25 - 50 , 50 - 75 , 75 - 100 , 100 - 125 , 125 - 150 , 150 - 175 , 175 - 200 , 200 - 225 , 225 - 250 , 250 - 275 , 275 - 300 , 300 - 325 , 325 - 350 , 350 - 375 , 375 - 400 , 400 - 425 , 425 - 450 , 450 - 475 , 475 - 500 , 500 - 525 , 525 - 550 , 550 - 575 , 575 - 600 , 600 - 625 , 625 - 650 , 650 - 675 , 675 - 700 , 700 - 725 , 725 - 750 , 750 - 775 , 775 - 800 , 800 - 825 , 825 - 850 , 850 - 875 , 875 - 900 , 900 - 925 , 925 - 950 , 950 - 975 , 975 - 1000 , 1000 - 1025 , 1025 - 1050 , 1050 - 1075 , 1075 - 1100 , 1100 - 1125 , 1125 - 1150 , 1150 - 1175 , 1175 - 1200 , 1200 - 1225 , 1225 - 1250 | ||
 | Click To Change The Sort Order: By Market Cap or Company Size Performance: Year-to-date, Week and Day |  |
|
Get the most comprehensive stock market coverage daily at 12Stocks.com ➞ Best Stocks Today ➞ Best Stocks Weekly ➞ Best Stocks Year-to-Date ➞ Best Stocks Trends ➞  Best Stocks Today 12Stocks.com Best Nasdaq Stocks ➞ Best S&P 500 Stocks ➞ Best Tech Stocks ➞ Best Biotech Stocks ➞ |
| Detailed Overview of Financial Stocks |
| Financial Technical Overview, Leaders & Laggards, Top Financial ETF Funds & Detailed Financial Stocks List, Charts, Trends & More |
| Financial Sector: Technical Analysis, Trends & YTD Performance | |
| Financial sector is composed of stocks
from banks, brokers, insurance, REITs
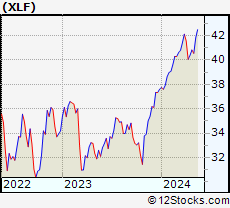
and services subsectors. Financial sector, as represented by XLF, an exchange-traded fund [ETF] that holds basket of Financial stocks (e.g, Bank of America, Goldman Sachs) is up by 8.72% and is currently outperforming the overall market by 3.56% year-to-date. Below is a quick view of Technical charts and trends: |
|
 XLF Weekly Chart |
|
| Long Term Trend: Very Good | |
| Medium Term Trend: Not Good | |
 XLF Daily Chart |
|
| Short Term Trend: Deteriorating | |
| Overall Trend Score: 56 | |
| YTD Performance: 8.72% | |
| **Trend Scores & Views Are Only For Educational Purposes And Not For Investing | |
| 12Stocks.com: Top Performing Financial Sector Stocks | ||||||||||||||||||||||||||||||||||||||||||||||||
 The top performing Financial sector stocks year to date are
Now, more recently, over last week, the top performing Financial sector stocks on the move are


|
||||||||||||||||||||||||||||||||||||||||||||||||
| 12Stocks.com: Investing in Financial Sector using Exchange Traded Funds | |
|
The following table shows list of key exchange traded funds (ETF) that
help investors track Financial Index. For detailed view, check out our ETF Funds section of our website. Quick View: Move mouse or cursor over ETF symbol (ticker) to view short-term Technical chart and over ETF name to view long term chart. Click on ticker or stock name for detailed view. Click on to add stock symbol to your watchlist and to view watchlist. |
12Stocks.com List of ETFs that track Financial Index
| Ticker | ETF Name | Watchlist | Recent Price | Smart Investing & Trading Score | Change % | Week % | Year-to-date % |
| XLF | Financial | | 40.88 | 56 | -0.58 | 1.24 | 8.72% |
| IAI | Broker-Dealers & Secs | | 112.15 | 48 | -0.66 | 1.01 | 3.34% |
| IYF | Financials | | 92.49 | 68 | -0.51 | 1.3 | 8.29% |
| IYG | Financial Services | | 64.56 | 76 | -0.54 | 1.8 | 8.07% |
| KRE | Regional Banking | | 48.47 | 67 | -1.10 | 2.43 | -7.55% |
| IXG | Global Financials | | 84.44 | 53 | -0.03 | 1.91 | 7.46% |
| VFH | Financials | | 99.12 | 68 | -0.60 | 1.4 | 7.44% |
| KBE | Bank | | 45.47 | 73 | -1.07 | 2.39 | -1.2% |
| FAS | Financial Bull 3X | | 101.43 | 61 | -1.72 | 3.57 | 22.72% |
| FAZ | Financial Bear 3X | | 10.79 | 40 | 1.70 | -3.66 | -21.07% |
| UYG | Financials | | 63.92 | 56 | -1.27 | 2.37 | 15.8% |
| IAT | Regional Banks | | 41.85 | 93 | -0.85 | 2.72 | 0.02% |
| KIE | Insurance | | 49.30 | 51 | -0.74 | 0.45 | 9.02% |
| PSCF | SmallCap Financials | | 46.29 | 65 | -1.59 | 1.8 | -5.88% |
| EUFN | Europe Financials | | 22.34 | 68 | -0.36 | 1.78 | 6.58% |
| PGF | Financial Preferred | | 14.57 | 37 | -1.09 | 0.28 | -0.07% |
| 12Stocks.com: Charts, Trends, Fundamental Data and Performances of Financial Stocks | |
|
We now take in-depth look at all Financial stocks including charts, multi-period performances and overall trends (as measured by Smart Investing & Trading Score). One can sort Financial stocks (click link to choose) by Daily, Weekly and by Year-to-Date performances. Also, one can sort by size of the company or by market capitalization. |
| Select Your Default Chart Type: | |||||
| |||||
| Click on stock symbol or name for detailed view. Click on to add stock symbol to your watchlist and to view watchlist. Quick View: Move mouse or cursor over "Daily" to quickly view daily Technical stock chart and over "Weekly" to view weekly Technical stock chart. | |||||

 | AMTB Amerant Bancorp Inc. |
| Sector: Financials | |
| SubSector: Regional - Midwest Banks | |
| MarketCap: 653.87 Millions | |
| Recent Price: 22.08 Smart Investing & Trading Score: 60 | |
| Day Percent Change: -2.82% Day Change: -0.64 | |
| Week Change: -0.45% Year-to-date Change: -10.1% | |
| AMTB Links: Profile News Message Board | |
| Charts:- Daily , Weekly | |
| Add AMTB to Watchlist: View: Get Complete AMTB Trend Analysis ➞ | |
 | TREE LendingTree, Inc. |
| Sector: Financials | |
| SubSector: Mortgage Investment | |
| MarketCap: 2745.99 Millions | |
| Recent Price: 36.43 Smart Investing & Trading Score: 56 | |
| Day Percent Change: -2.83% Day Change: -1.06 | |
| Week Change: 6.74% Year-to-date Change: 20.2% | |
| TREE Links: Profile News Message Board | |
| Charts:- Daily , Weekly | |
| Add TREE to Watchlist: View: Get Complete TREE Trend Analysis ➞ | |
 | HFWA Heritage Financial Corporation |
| Sector: Financials | |
| SubSector: Regional - Pacific Banks | |
| MarketCap: 752.829 Millions | |
| Recent Price: 18.09 Smart Investing & Trading Score: 67 | |
| Day Percent Change: -2.85% Day Change: -0.53 | |
| Week Change: -0.44% Year-to-date Change: -15.4% | |
| HFWA Links: Profile News Message Board | |
| Charts:- Daily , Weekly | |
| Add HFWA to Watchlist: View: Get Complete HFWA Trend Analysis ➞ | |
 | AMK AssetMark Financial Holdings, Inc. |
| Sector: Financials | |
| SubSector: Asset Management | |
| MarketCap: 1296.33 Millions | |
| Recent Price: 33.89 Smart Investing & Trading Score: 61 | |
| Day Percent Change: -2.89% Day Change: -1.01 | |
| Week Change: -2.45% Year-to-date Change: 13.2% | |
| AMK Links: Profile News Message Board | |
| Charts:- Daily , Weekly | |
| Add AMK to Watchlist: View: Get Complete AMK Trend Analysis ➞ | |
 | OVLY Oak Valley Bancorp |
| Sector: Financials | |
| SubSector: Regional - Pacific Banks | |
| MarketCap: 148.429 Millions | |
| Recent Price: 24.07 Smart Investing & Trading Score: 57 | |
| Day Percent Change: -2.90% Day Change: -0.72 | |
| Week Change: -0.95% Year-to-date Change: -19.6% | |
| OVLY Links: Profile News Message Board | |
| Charts:- Daily , Weekly | |
| Add OVLY to Watchlist: View: Get Complete OVLY Trend Analysis ➞ | |
 | BHF Brighthouse Financial, Inc. |
| Sector: Financials | |
| SubSector: Life Insurance | |
| MarketCap: 2045.06 Millions | |
| Recent Price: 49.03 Smart Investing & Trading Score: 44 | |
| Day Percent Change: -2.91% Day Change: -1.47 | |
| Week Change: 0.31% Year-to-date Change: -7.4% | |
| BHF Links: Profile News Message Board | |
| Charts:- Daily , Weekly | |
| Add BHF to Watchlist: View: Get Complete BHF Trend Analysis ➞ | |
 | BBU Brookfield Business Partners L.P. |
| Sector: Financials | |
| SubSector: Real Estate Development | |
| MarketCap: 1612.19 Millions | |
| Recent Price: 19.00 Smart Investing & Trading Score: 15 | |
| Day Percent Change: -2.96% Day Change: -0.58 | |
| Week Change: -2.26% Year-to-date Change: -7.7% | |
| BBU Links: Profile News Message Board | |
| Charts:- Daily , Weekly | |
| Add BBU to Watchlist: View: Get Complete BBU Trend Analysis ➞ | |
 | ECPG Encore Capital Group, Inc. |
| Sector: Financials | |
| SubSector: Asset Management | |
| MarketCap: 661.503 Millions | |
| Recent Price: 41.76 Smart Investing & Trading Score: 20 | |
| Day Percent Change: -3.00% Day Change: -1.29 | |
| Week Change: -2.2% Year-to-date Change: -17.7% | |
| ECPG Links: Profile News Message Board | |
| Charts:- Daily , Weekly | |
| Add ECPG to Watchlist: View: Get Complete ECPG Trend Analysis ➞ | |
 | EIG Employers Holdings, Inc. |
| Sector: Financials | |
| SubSector: Accident & Health Insurance | |
| MarketCap: 1202.6 Millions | |
| Recent Price: 43.51 Smart Investing & Trading Score: 88 | |
| Day Percent Change: -3.10% Day Change: -1.39 | |
| Week Change: -1.92% Year-to-date Change: 10.4% | |
| EIG Links: Profile News Message Board | |
| Charts:- Daily , Weekly | |
| Add EIG to Watchlist: View: Get Complete EIG Trend Analysis ➞ | |
 | PAI Western Asset Investment Grade Income Fund Inc. |
| Sector: Financials | |
| SubSector: Closed-End Fund - Debt | |
| MarketCap: 109.607 Millions | |
| Recent Price: 11.73 Smart Investing & Trading Score: 32 | |
| Day Percent Change: -3.12% Day Change: -0.38 | |
| Week Change: -2.48% Year-to-date Change: -2.6% | |
| PAI Links: Profile News Message Board | |
| Charts:- Daily , Weekly | |
| Add PAI to Watchlist: View: Get Complete PAI Trend Analysis ➞ | |
 | BCBP BCB Bancorp, Inc. |
| Sector: Financials | |
| SubSector: Regional - Northeast Banks | |
| MarketCap: 196.799 Millions | |
| Recent Price: 9.44 Smart Investing & Trading Score: 37 | |
| Day Percent Change: -3.18% Day Change: -0.31 | |
| Week Change: -5.32% Year-to-date Change: -26.5% | |
| BCBP Links: Profile News Message Board | |
| Charts:- Daily , Weekly | |
| Add BCBP to Watchlist: View: Get Complete BCBP Trend Analysis ➞ | |
 | INN Summit Hotel Properties, Inc. |
| Sector: Financials | |
| SubSector: Real Estate Development | |
| MarketCap: 402.019 Millions | |
| Recent Price: 6.07 Smart Investing & Trading Score: 45 | |
| Day Percent Change: -3.19% Day Change: -0.20 | |
| Week Change: -1.3% Year-to-date Change: -9.7% | |
| INN Links: Profile News Message Board | |
| Charts:- Daily , Weekly | |
| Add INN to Watchlist: View: Get Complete INN Trend Analysis ➞ | |
 | SAFT Safety Insurance Group, Inc. |
| Sector: Financials | |
| SubSector: Property & Casualty Insurance | |
| MarketCap: 1145.12 Millions | |
| Recent Price: 79.05 Smart Investing & Trading Score: 55 | |
| Day Percent Change: -3.23% Day Change: -2.64 | |
| Week Change: -3.57% Year-to-date Change: 4.0% | |
| SAFT Links: Profile News Message Board | |
| Charts:- Daily , Weekly | |
| Add SAFT to Watchlist: View: Get Complete SAFT Trend Analysis ➞ | |
 | BXMT Blackstone Mortgage Trust, Inc. |
| Sector: Financials | |
| SubSector: Mortgage Investment | |
| MarketCap: 2820.69 Millions | |
| Recent Price: 17.65 Smart Investing & Trading Score: 0 | |
| Day Percent Change: -3.29% Day Change: -0.60 | |
| Week Change: -4.8% Year-to-date Change: -17.0% | |
| BXMT Links: Profile News Message Board | |
| Charts:- Daily , Weekly | |
| Add BXMT to Watchlist: View: Get Complete BXMT Trend Analysis ➞ | |
 | BOKF BOK Financial Corporation |
| Sector: Financials | |
| SubSector: Regional - Southwest Banks | |
| MarketCap: 2945.35 Millions | |
| Recent Price: 89.96 Smart Investing & Trading Score: 100 | |
| Day Percent Change: -3.32% Day Change: -3.09 | |
| Week Change: 2.4% Year-to-date Change: 5.0% | |
| BOKF Links: Profile News Message Board | |
| Charts:- Daily , Weekly | |
| Add BOKF to Watchlist: View: Get Complete BOKF Trend Analysis ➞ | |
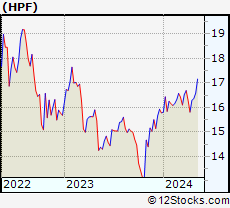 | HPF John Hancock Preferred Income Fund II |
| Sector: Financials | |
| SubSector: Closed-End Fund - Debt | |
| MarketCap: 269.407 Millions | |
| Recent Price: 16.31 Smart Investing & Trading Score: 93 | |
| Day Percent Change: -3.38% Day Change: -0.57 | |
| Week Change: 0.12% Year-to-date Change: 3.4% | |
| HPF Links: Profile News Message Board | |
| Charts:- Daily , Weekly | |
| Add HPF to Watchlist: View: Get Complete HPF Trend Analysis ➞ | |
 | CVBF CVB Financial Corp. |
| Sector: Financials | |
| SubSector: Regional - Pacific Banks | |
| MarketCap: 2699.99 Millions | |
| Recent Price: 16.51 Smart Investing & Trading Score: 93 | |
| Day Percent Change: -3.39% Day Change: -0.58 | |
| Week Change: -0.72% Year-to-date Change: -18.2% | |
| CVBF Links: Profile News Message Board | |
| Charts:- Daily , Weekly | |
| Add CVBF to Watchlist: View: Get Complete CVBF Trend Analysis ➞ | |
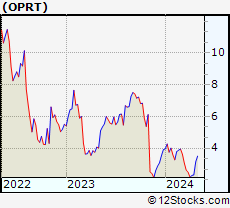 | OPRT Oportun Financial Corporation |
| Sector: Financials | |
| SubSector: Credit Services | |
| MarketCap: 360.208 Millions | |
| Recent Price: 3.13 Smart Investing & Trading Score: 67 | |
| Day Percent Change: -3.40% Day Change: -0.11 | |
| Week Change: 34.91% Year-to-date Change: -20.0% | |
| OPRT Links: Profile News Message Board | |
| Charts:- Daily , Weekly | |
| Add OPRT to Watchlist: View: Get Complete OPRT Trend Analysis ➞ | |
 | ESSA ESSA Bancorp, Inc. |
| Sector: Financials | |
| SubSector: Savings & Loans | |
| MarketCap: 171.33 Millions | |
| Recent Price: 16.27 Smart Investing & Trading Score: 28 | |
| Day Percent Change: -3.41% Day Change: -0.58 | |
| Week Change: -3.76% Year-to-date Change: -18.7% | |
| ESSA Links: Profile News Message Board | |
| Charts:- Daily , Weekly | |
| Add ESSA to Watchlist: View: Get Complete ESSA Trend Analysis ➞ | |
 | LND BrasilAgro - Companhia Brasileira de Propriedades Agricolas |
| Sector: Financials | |
| SubSector: Property Management | |
| MarketCap: 157.842 Millions | |
| Recent Price: 4.82 Smart Investing & Trading Score: 35 | |
| Day Percent Change: -3.41% Day Change: -0.17 | |
| Week Change: -3.79% Year-to-date Change: -8.7% | |
| LND Links: Profile News Message Board | |
| Charts:- Daily , Weekly | |
| Add LND to Watchlist: View: Get Complete LND Trend Analysis ➞ | |
 | COIN Coinbase Global, Inc. |
| Sector: Financials | |
| SubSector: Financial Data & Stock Exchanges | |
| MarketCap: 16390 Millions | |
| Recent Price: 223.61 Smart Investing & Trading Score: 41 | |
| Day Percent Change: -3.43% Day Change: -7.95 | |
| Week Change: 5.97% Year-to-date Change: 29.4% | |
| COIN Links: Profile News Message Board | |
| Charts:- Daily , Weekly | |
| Add COIN to Watchlist: View: Get Complete COIN Trend Analysis ➞ | |
 | ONL Orion Office REIT Inc. |
| Sector: Financials | |
| SubSector: REIT - Office | |
| MarketCap: 375 Millions | |
| Recent Price: 3.24 Smart Investing & Trading Score: 74 | |
| Day Percent Change: -3.43% Day Change: -0.11 | |
| Week Change: 2.53% Year-to-date Change: -43.4% | |
| ONL Links: Profile News Message Board | |
| Charts:- Daily , Weekly | |
| Add ONL to Watchlist: View: Get Complete ONL Trend Analysis ➞ | |
 | SLQT SelectQuote, Inc. |
| Sector: Financials | |
| SubSector: Insurance Brokers | |
| MarketCap: 38257 Millions | |
| Recent Price: 1.54 Smart Investing & Trading Score: 31 | |
| Day Percent Change: -3.44% Day Change: -0.06 | |
| Week Change: -9.38% Year-to-date Change: 12.8% | |
| SLQT Links: Profile News Message Board | |
| Charts:- Daily , Weekly | |
| Add SLQT to Watchlist: View: Get Complete SLQT Trend Analysis ➞ | |
 | AWH Allied World Assurance Company Holdings, AG |
| Sector: Financials | |
| SubSector: Property & Casualty Insurance | |
| MarketCap: 4663.47 Millions | |
| Recent Price: 3.28 Smart Investing & Trading Score: 32 | |
| Day Percent Change: -3.53% Day Change: -0.12 | |
| Week Change: -6.02% Year-to-date Change: -19.6% | |
| AWH Links: Profile News Message Board | |
| Charts:- Daily , Weekly | |
| Add AWH to Watchlist: View: Get Complete AWH Trend Analysis ➞ | |
 | SAFE Safehold Inc. |
| Sector: Financials | |
| SubSector: REIT - Diversified | |
| MarketCap: 2994.63 Millions | |
| Recent Price: 18.34 Smart Investing & Trading Score: 27 | |
| Day Percent Change: -3.58% Day Change: -0.68 | |
| Week Change: -3.17% Year-to-date Change: -21.6% | |
| SAFE Links: Profile News Message Board | |
| Charts:- Daily , Weekly | |
| Add SAFE to Watchlist: View: Get Complete SAFE Trend Analysis ➞ | |
| For tabular summary view of above stock list: Summary View ➞ 0 - 25 , 25 - 50 , 50 - 75 , 75 - 100 , 100 - 125 , 125 - 150 , 150 - 175 , 175 - 200 , 200 - 225 , 225 - 250 , 250 - 275 , 275 - 300 , 300 - 325 , 325 - 350 , 350 - 375 , 375 - 400 , 400 - 425 , 425 - 450 , 450 - 475 , 475 - 500 , 500 - 525 , 525 - 550 , 550 - 575 , 575 - 600 , 600 - 625 , 625 - 650 , 650 - 675 , 675 - 700 , 700 - 725 , 725 - 750 , 750 - 775 , 775 - 800 , 800 - 825 , 825 - 850 , 850 - 875 , 875 - 900 , 900 - 925 , 925 - 950 , 950 - 975 , 975 - 1000 , 1000 - 1025 , 1025 - 1050 , 1050 - 1075 , 1075 - 1100 , 1100 - 1125 , 1125 - 1150 , 1150 - 1175 , 1175 - 1200 , 1200 - 1225 , 1225 - 1250 | ||
| Click To Change The Sort Order: By Market Cap or Company Size Performance: Year-to-date, Week and Day | |
| Select Chart Type: | ||
|
Best Stocks Today 12Stocks.com |
© 2024 12Stocks.com Terms & Conditions Privacy Contact Us
All Information Provided Only For Education And Not To Be Used For Investing or Trading. See Terms & Conditions


One More Thing ... Get Best Stocks Delivered Daily!
Never Ever Miss A Move With Our Top Ten Stocks Lists
Find Best Stocks In Any Market - Bull or Bear Market
Take A Peek At Our Top Ten Stocks Lists: Daily, Weekly, Year-to-Date & Top Trends
Find Best Stocks In Any Market - Bull or Bear Market
Take A Peek At Our Top Ten Stocks Lists: Daily, Weekly, Year-to-Date & Top Trends
Financial Stocks With Best Up Trends [0-bearish to 100-bullish]: B. Riley[100], Deutsche Bank[100], Central Pacific[100], Virtu [100], Trustmark [100], Equity Residential[100], Third Coast[100], UDR [100], AvalonBay Communities[100], Capital Southwest[100], LTC Properties[100]
Best Financial Stocks Year-to-Date:
Root [465%], Hippo [128.87%], Gladstone Capital[98.88%], Banco Macro[71.01%], Grupo Financiero[70.81%], B. Riley[65.27%], Banco BBVA[64.71%], Yiren Digital[61.54%], Heritage Insurance[59.97%], Fidelis Insurance[56.23%], First [52.08%] Best Financial Stocks This Week:
B. Riley[73.54%], Oportun [34.91%], Provident Bancorp[19.9%], Cipher Mining[15.36%], First Citizens[14.87%], Root [14.33%], TOP [14.04%], Globe Life[13.19%], Deutsche Bank[12.63%], Trustmark [11.56%], Peakstone Realty[11.41%] Best Financial Stocks Daily:
B. Riley[16.61%], First Citizens[9.80%], Deutsche Bank[8.74%], Provident Bancorp[8.10%], Barclays [7.92%], MicroSectors Gold[5.71%], Fangdd Network[5.41%], Atlanticus [4.90%], Central Pacific[4.06%], Bridge [3.63%], Meta [3.58%]