
 Login Sign Up


| |||||
 |  | ||||

| 12Stocks.com Market Intelligence |
Best Financial Stocks
| In a hurry? Financial Stocks Lists: Performance Trends Table, Stock Charts
Sort Financial stocks: Daily, Weekly, Year-to-Date, Market Cap & Trends. Filter Financial stocks list by size:All Financial Large Mid-Range Small & MicroCap |
| 12Stocks.com Financial Stocks Performances & Trends Daily | |||||||||
|
|  The overall Smart Investing & Trading Score is 83 (0-bearish to 100-bullish) which puts Financial sector in short term bullish trend. The Smart Investing & Trading Score from previous trading session is 63 and hence an improvement of trend.
| ||||||||
Here are the Smart Investing & Trading Scores of the most requested Financial stocks at 12Stocks.com (click stock name for detailed review):
|


| 12Stocks.com: Investing in Financial sector with Stocks | |
|
The following table helps investors and traders sort through current performance and trends (as measured by Smart Investing & Trading Score) of various
stocks in the Financial sector. Quick View: Move mouse or cursor over stock symbol (ticker) to view short-term Technical chart and over stock name to view long term chart. Click on  to add stock symbol to your watchlist and to add stock symbol to your watchlist and  to view watchlist. Click on any ticker or stock name for detailed market intelligence report for that stock. to view watchlist. Click on any ticker or stock name for detailed market intelligence report for that stock. |
12Stocks.com Performance of Stocks in Financial Sector
| Ticker | Stock Name | Watchlist | Category | Recent Price | Trend Score | Change % | YTD Change% |
| FULT | Fulton |   | Regional Banks | 17.18 | 100 | 9.96% | 4.34% |
| RILY | B. Riley | | Asset Mgmt | 38.40 | 100 | 4.28% | 82.92% |
| IBN | ICICI Bank | | Banks | 27.57 | 100 | 3.92% | 15.65% |
| LAZ | Lazard | | Asset Mgmt | 40.09 | 100 | 2.83% | 15.22% |
| LPLA | LPL | | Brokerage | 273.51 | 100 | 2.70% | 20.16% |
| HIW | Highwoods Properties | | REIT - Office | 26.22 | 100 | 2.10% | 14.20% |
| BY | Byline Bancorp | | Regional Banks | 22.23 | 100 | 2.07% | -5.65% |
| CUZ | Cousins Properties | | REIT - | 23.33 | 100 | 2.06% | -4.19% |
| HTLF | Heartland | | Regional - Southwest Banks | 42.56 | 100 | 19.15% | 13.16% |
| ASB | Associated Banc-Corp | | Regional Banks | 21.97 | 100 | 1.85% | 2.71% |
| PYPL | PayPal | | Credit Services | 66.98 | 100 | 1.55% | 9.08% |
| SF | Stifel | | Brokerage | 80.16 | 100 | 1.40% | 15.91% |
| CGBD | TCG BDC | | Asset Mgmt | 17.33 | 100 | 1.40% | 15.84% |
| GBDC | Golub Capital | | Asset Mgmt | 17.63 | 100 | 1.32% | 16.75% |
| UMH | UMH Properties | | REIT - | 15.86 | 100 | 1.28% | 3.52% |
| MAA | Mid-America Apartment | | REIT | 130.85 | 100 | 1.25% | -2.68% |
| OPY | Oppenheimer | | Brokerage | 41.31 | 100 | 1.24% | -0.04% |
| ONB | Old National | | Regional Banks | 16.77 | 100 | 1.18% | -0.74% |
| CTRE | CareTrust REIT | | REIT | 24.59 | 100 | 1.15% | 9.87% |
| CHN | China Fund | | Closed-End Fund - Foreign | 10.47 | 100 | 1.11% | 3.00% |
| MRCC | Monroe Capital | | Mortgage | 7.40 | 100 | 1.09% | 4.74% |
| CHCT | Community Healthcare | | REIT | 26.60 | 100 | 1.03% | -0.15% |
| GS | Goldman Sachs | | Brokerage | 431.95 | 100 | 1.02% | 11.97% |
| UVSP | Univest | | Regional Banks | 21.43 | 100 | 0.94% | -2.72% |
| PIPR | Piper Sandler | | Asset Mgmt | 198.95 | 100 | 0.91% | 13.77% |
| For chart view version of above stock list: Chart View ➞ 0 - 25 , 25 - 50 , 50 - 75 , 75 - 100 , 100 - 125 , 125 - 150 , 150 - 175 , 175 - 200 , 200 - 225 , 225 - 250 , 250 - 275 , 275 - 300 , 300 - 325 , 325 - 350 , 350 - 375 , 375 - 400 , 400 - 425 , 425 - 450 , 450 - 475 , 475 - 500 , 500 - 525 , 525 - 550 , 550 - 575 , 575 - 600 , 600 - 625 , 625 - 650 , 650 - 675 , 675 - 700 , 700 - 725 , 725 - 750 , 750 - 775 , 775 - 800 , 800 - 825 , 825 - 850 , 850 - 875 , 875 - 900 , 900 - 925 , 925 - 950 , 950 - 975 , 975 - 1000 , 1000 - 1025 , 1025 - 1050 , 1050 - 1075 , 1075 - 1100 , 1100 - 1125 , 1125 - 1150 , 1150 - 1175 | ||
 | Click To Change The Sort Order: By Market Cap or Company Size Performance: Year-to-date, Week and Day |  |
|
Get the most comprehensive stock market coverage daily at 12Stocks.com ➞ Best Stocks Today ➞ Best Stocks Weekly ➞ Best Stocks Year-to-Date ➞ Best Stocks Trends ➞  Best Stocks Today 12Stocks.com Best Nasdaq Stocks ➞ Best S&P 500 Stocks ➞ Best Tech Stocks ➞ Best Biotech Stocks ➞ |
| Detailed Overview of Financial Stocks |
| Financial Technical Overview, Leaders & Laggards, Top Financial ETF Funds & Detailed Financial Stocks List, Charts, Trends & More |
| Financial Sector: Technical Analysis, Trends & YTD Performance | |
| Financial sector is composed of stocks
from banks, brokers, insurance, REITs
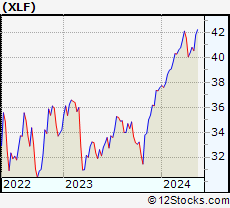
and services subsectors. Financial sector, as represented by XLF, an exchange-traded fund [ETF] that holds basket of Financial stocks (e.g, Bank of America, Goldman Sachs) is up by 8.74% and is currently outperforming the overall market by 2.24% year-to-date. Below is a quick view of Technical charts and trends: |
|
 XLF Weekly Chart |
|
| Long Term Trend: Very Good | |
| Medium Term Trend: Good | |
 XLF Daily Chart |
|
| Short Term Trend: Deteriorating | |
| Overall Trend Score: 83 | |
| YTD Performance: 8.74% | |
| **Trend Scores & Views Are Only For Educational Purposes And Not For Investing | |
| 12Stocks.com: Top Performing Financial Sector Stocks | ||||||||||||||||||||||||||||||||||||||||||||||||
 The top performing Financial sector stocks year to date are
Now, more recently, over last week, the top performing Financial sector stocks on the move are


|
||||||||||||||||||||||||||||||||||||||||||||||||
| 12Stocks.com: Investing in Financial Sector using Exchange Traded Funds | |
|
The following table shows list of key exchange traded funds (ETF) that
help investors track Financial Index. For detailed view, check out our ETF Funds section of our website. Quick View: Move mouse or cursor over ETF symbol (ticker) to view short-term Technical chart and over ETF name to view long term chart. Click on ticker or stock name for detailed view. Click on to add stock symbol to your watchlist and to view watchlist. |
12Stocks.com List of ETFs that track Financial Index
| Ticker | ETF Name | Watchlist | Recent Price | Smart Investing & Trading Score | Change % | Week % | Year-to-date % |
| XLF | Financial | | 40.88 | 83 | 0.16 | 0.16 | 8.74% |
| IAI | Broker-Dealers & Secs | | 113.43 | 83 | 0.37 | 0.37 | 4.51% |
| IYF | Financials | | 92.51 | 83 | 0.37 | 0.37 | 8.31% |
| IYG | Financial Services | | 64.57 | 83 | -0.06 | -0.06 | 8.09% |
| KRE | Regional Banking | | 48.25 | 54 | 0.12 | 0.12 | -7.97% |
| IXG | Global Financials | | 84.47 | 83 | 0.33 | 0.33 | 7.5% |
| VFH | Financials | | 99.23 | 83 | 0.31 | 0.31 | 7.56% |
| KBE | Bank | | 45.40 | 80 | 0.15 | 0.15 | -1.35% |
| FAS | Financial Bull 3X | | 101.08 | 75 | 0.45 | 0.45 | 22.3% |
| FAZ | Financial Bear 3X | | 10.81 | 32 | -0.51 | -0.51 | -20.96% |
| UYG | Financials | | 64.02 | 70 | 0.58 | 0.58 | 15.98% |
| IAT | Regional Banks | | 41.82 | 73 | 0.24 | 0.24 | -0.05% |
| KIE | Insurance | | 48.88 | 58 | 0.73 | 0.73 | 8.1% |
| PSCF | SmallCap Financials | | 46.33 | 47 | -0.06 | -0.06 | -5.79% |
| EUFN | Europe Financials | | 22.45 | 83 | -0.07 | -0.07 | 7.08% |
| PGF | Financial Preferred | | 14.63 | 39 | 0.38 | 0.38 | 0.31% |
| 12Stocks.com: Charts, Trends, Fundamental Data and Performances of Financial Stocks | |
|
We now take in-depth look at all Financial stocks including charts, multi-period performances and overall trends (as measured by Smart Investing & Trading Score). One can sort Financial stocks (click link to choose) by Daily, Weekly and by Year-to-Date performances. Also, one can sort by size of the company or by market capitalization. |
| Select Your Default Chart Type: | |||||
| |||||
| Click on stock symbol or name for detailed view. Click on to add stock symbol to your watchlist and to view watchlist. Quick View: Move mouse or cursor over "Daily" to quickly view daily Technical stock chart and over "Weekly" to view weekly Technical stock chart. | |||||

 | FULT Fulton Financial Corporation |
| Sector: Financials | |
| SubSector: Regional - Northeast Banks | |
| MarketCap: 2030.89 Millions | |
| Recent Price: 17.18 Smart Investing & Trading Score: 100 | |
| Day Percent Change: 9.96% Day Change: 1.56 | |
| Week Change: 9.96% Year-to-date Change: 4.3% | |
| FULT Links: Profile News Message Board | |
| Charts:- Daily , Weekly | |
| Add FULT to Watchlist: View: Get Complete FULT Trend Analysis ➞ | |
 | RILY B. Riley Financial, Inc. |
| Sector: Financials | |
| SubSector: Asset Management | |
| MarketCap: 443.703 Millions | |
| Recent Price: 38.40 Smart Investing & Trading Score: 100 | |
| Day Percent Change: 4.28% Day Change: 1.58 | |
| Week Change: 4.28% Year-to-date Change: 82.9% | |
| RILY Links: Profile News Message Board | |
| Charts:- Daily , Weekly | |
| Add RILY to Watchlist: View: Get Complete RILY Trend Analysis ➞ | |
 | IBN ICICI Bank Limited |
| Sector: Financials | |
| SubSector: Money Center Banks | |
| MarketCap: 31194.1 Millions | |
| Recent Price: 27.57 Smart Investing & Trading Score: 100 | |
| Day Percent Change: 3.92% Day Change: 1.04 | |
| Week Change: 3.92% Year-to-date Change: 15.7% | |
| IBN Links: Profile News Message Board | |
| Charts:- Daily , Weekly | |
| Add IBN to Watchlist: View: Get Complete IBN Trend Analysis ➞ | |
 | LAZ Lazard Ltd |
| Sector: Financials | |
| SubSector: Asset Management | |
| MarketCap: 3061.13 Millions | |
| Recent Price: 40.09 Smart Investing & Trading Score: 100 | |
| Day Percent Change: 2.83% Day Change: 1.10 | |
| Week Change: 2.83% Year-to-date Change: 15.2% | |
| LAZ Links: Profile News Message Board | |
| Charts:- Daily , Weekly | |
| Add LAZ to Watchlist: View: Get Complete LAZ Trend Analysis ➞ | |
 | LPLA LPL Financial Holdings Inc. |
| Sector: Financials | |
| SubSector: Investment Brokerage - National | |
| MarketCap: 4104.65 Millions | |
| Recent Price: 273.51 Smart Investing & Trading Score: 100 | |
| Day Percent Change: 2.70% Day Change: 7.19 | |
| Week Change: 2.7% Year-to-date Change: 20.2% | |
| LPLA Links: Profile News Message Board | |
| Charts:- Daily , Weekly | |
| Add LPLA to Watchlist: View: Get Complete LPLA Trend Analysis ➞ | |
 | HIW Highwoods Properties, Inc. |
| Sector: Financials | |
| SubSector: REIT - Office | |
| MarketCap: 3227.46 Millions | |
| Recent Price: 26.22 Smart Investing & Trading Score: 100 | |
| Day Percent Change: 2.10% Day Change: 0.54 | |
| Week Change: 2.1% Year-to-date Change: 14.2% | |
| HIW Links: Profile News Message Board | |
| Charts:- Daily , Weekly | |
| Add HIW to Watchlist: View: Get Complete HIW Trend Analysis ➞ | |
 | BY Byline Bancorp, Inc. |
| Sector: Financials | |
| SubSector: Regional - Midwest Banks | |
| MarketCap: 381.87 Millions | |
| Recent Price: 22.23 Smart Investing & Trading Score: 100 | |
| Day Percent Change: 2.07% Day Change: 0.45 | |
| Week Change: 2.07% Year-to-date Change: -5.7% | |
| BY Links: Profile News Message Board | |
| Charts:- Daily , Weekly | |
| Add BY to Watchlist: View: Get Complete BY Trend Analysis ➞ | |
 | CUZ Cousins Properties Incorporated |
| Sector: Financials | |
| SubSector: REIT - Diversified | |
| MarketCap: 3828.13 Millions | |
| Recent Price: 23.33 Smart Investing & Trading Score: 100 | |
| Day Percent Change: 2.06% Day Change: 0.47 | |
| Week Change: 2.06% Year-to-date Change: -4.2% | |
| CUZ Links: Profile News Message Board | |
| Charts:- Daily , Weekly | |
| Add CUZ to Watchlist: View: Get Complete CUZ Trend Analysis ➞ | |
 | HTLF Heartland Financial USA, Inc. |
| Sector: Financials | |
| SubSector: Regional - Southwest Banks | |
| MarketCap: 1143.85 Millions | |
| Recent Price: 42.56 Smart Investing & Trading Score: 100 | |
| Day Percent Change: 19.15% Day Change: 6.84 | |
| Week Change: 19.15% Year-to-date Change: 13.2% | |
| HTLF Links: Profile News Message Board | |
| Charts:- Daily , Weekly | |
| Add HTLF to Watchlist: View: Get Complete HTLF Trend Analysis ➞ | |
 | ASB Associated Banc-Corp |
| Sector: Financials | |
| SubSector: Regional - Midwest Banks | |
| MarketCap: 1904.8 Millions | |
| Recent Price: 21.97 Smart Investing & Trading Score: 100 | |
| Day Percent Change: 1.85% Day Change: 0.40 | |
| Week Change: 1.85% Year-to-date Change: 2.7% | |
| ASB Links: Profile News Message Board | |
| Charts:- Daily , Weekly | |
| Add ASB to Watchlist: View: Get Complete ASB Trend Analysis ➞ | |
 | PYPL PayPal Holdings, Inc. |
| Sector: Financials | |
| SubSector: Credit Services | |
| MarketCap: 108949 Millions | |
| Recent Price: 66.98 Smart Investing & Trading Score: 100 | |
| Day Percent Change: 1.55% Day Change: 1.03 | |
| Week Change: 1.55% Year-to-date Change: 9.1% | |
| PYPL Links: Profile News Message Board | |
| Charts:- Daily , Weekly | |
| Add PYPL to Watchlist: View: Get Complete PYPL Trend Analysis ➞ | |
 | SF Stifel Financial Corp. |
| Sector: Financials | |
| SubSector: Investment Brokerage - Regional | |
| MarketCap: 2783.65 Millions | |
| Recent Price: 80.16 Smart Investing & Trading Score: 100 | |
| Day Percent Change: 1.40% Day Change: 1.11 | |
| Week Change: 1.4% Year-to-date Change: 15.9% | |
| SF Links: Profile News Message Board | |
| Charts:- Daily , Weekly | |
| Add SF to Watchlist: View: Get Complete SF Trend Analysis ➞ | |
 | CGBD TCG BDC, Inc. |
| Sector: Financials | |
| SubSector: Asset Management | |
| MarketCap: 379.003 Millions | |
| Recent Price: 17.33 Smart Investing & Trading Score: 100 | |
| Day Percent Change: 1.40% Day Change: 0.24 | |
| Week Change: 1.4% Year-to-date Change: 15.8% | |
| CGBD Links: Profile News Message Board | |
| Charts:- Daily , Weekly | |
| Add CGBD to Watchlist: View: Get Complete CGBD Trend Analysis ➞ | |
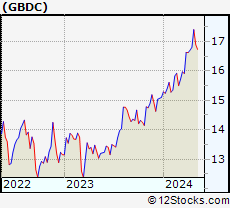 | GBDC Golub Capital BDC, Inc. |
| Sector: Financials | |
| SubSector: Asset Management | |
| MarketCap: 1493.23 Millions | |
| Recent Price: 17.63 Smart Investing & Trading Score: 100 | |
| Day Percent Change: 1.32% Day Change: 0.23 | |
| Week Change: 1.32% Year-to-date Change: 16.8% | |
| GBDC Links: Profile News Message Board | |
| Charts:- Daily , Weekly | |
| Add GBDC to Watchlist: View: Get Complete GBDC Trend Analysis ➞ | |
 | UMH UMH Properties, Inc. |
| Sector: Financials | |
| SubSector: REIT - Diversified | |
| MarketCap: 433.353 Millions | |
| Recent Price: 15.86 Smart Investing & Trading Score: 100 | |
| Day Percent Change: 1.28% Day Change: 0.20 | |
| Week Change: 1.28% Year-to-date Change: 3.5% | |
| UMH Links: Profile News Message Board | |
| Charts:- Daily , Weekly | |
| Add UMH to Watchlist: View: Get Complete UMH Trend Analysis ➞ | |
 | MAA Mid-America Apartment Communities, Inc. |
| Sector: Financials | |
| SubSector: REIT - Residential | |
| MarketCap: 11385.5 Millions | |
| Recent Price: 130.85 Smart Investing & Trading Score: 100 | |
| Day Percent Change: 1.25% Day Change: 1.62 | |
| Week Change: 1.25% Year-to-date Change: -2.7% | |
| MAA Links: Profile News Message Board | |
| Charts:- Daily , Weekly | |
| Add MAA to Watchlist: View: Get Complete MAA Trend Analysis ➞ | |
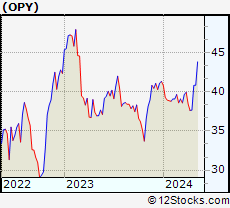 | OPY Oppenheimer Holdings Inc. |
| Sector: Financials | |
| SubSector: Investment Brokerage - Regional | |
| MarketCap: 243.565 Millions | |
| Recent Price: 41.31 Smart Investing & Trading Score: 100 | |
| Day Percent Change: 1.24% Day Change: 0.51 | |
| Week Change: 1.24% Year-to-date Change: 0.0% | |
| OPY Links: Profile News Message Board | |
| Charts:- Daily , Weekly | |
| Add OPY to Watchlist: View: Get Complete OPY Trend Analysis ➞ | |
 | ONB Old National Bancorp |
| Sector: Financials | |
| SubSector: Regional - Midwest Banks | |
| MarketCap: 2340.8 Millions | |
| Recent Price: 16.77 Smart Investing & Trading Score: 100 | |
| Day Percent Change: 1.18% Day Change: 0.20 | |
| Week Change: 1.18% Year-to-date Change: -0.7% | |
| ONB Links: Profile News Message Board | |
| Charts:- Daily , Weekly | |
| Add ONB to Watchlist: View: Get Complete ONB Trend Analysis ➞ | |
 | CTRE CareTrust REIT, Inc. |
| Sector: Financials | |
| SubSector: REIT - Healthcare Facilities | |
| MarketCap: 1507.94 Millions | |
| Recent Price: 24.59 Smart Investing & Trading Score: 100 | |
| Day Percent Change: 1.15% Day Change: 0.28 | |
| Week Change: 1.15% Year-to-date Change: 9.9% | |
| CTRE Links: Profile News Message Board | |
| Charts:- Daily , Weekly | |
| Add CTRE to Watchlist: View: Get Complete CTRE Trend Analysis ➞ | |
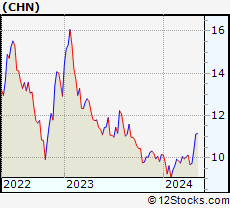 | CHN The China Fund, Inc. |
| Sector: Financials | |
| SubSector: Closed-End Fund - Foreign | |
| MarketCap: 176.047 Millions | |
| Recent Price: 10.47 Smart Investing & Trading Score: 100 | |
| Day Percent Change: 1.11% Day Change: 0.12 | |
| Week Change: 1.11% Year-to-date Change: 3.0% | |
| CHN Links: Profile News Message Board | |
| Charts:- Daily , Weekly | |
| Add CHN to Watchlist: View: Get Complete CHN Trend Analysis ➞ | |
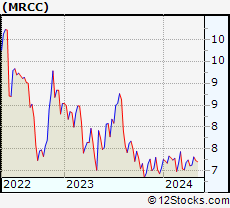 | MRCC Monroe Capital Corporation |
| Sector: Financials | |
| SubSector: Mortgage Investment | |
| MarketCap: 139.439 Millions | |
| Recent Price: 7.40 Smart Investing & Trading Score: 100 | |
| Day Percent Change: 1.09% Day Change: 0.08 | |
| Week Change: 1.09% Year-to-date Change: 4.7% | |
| MRCC Links: Profile News Message Board | |
| Charts:- Daily , Weekly | |
| Add MRCC to Watchlist: View: Get Complete MRCC Trend Analysis ➞ | |
 | CHCT Community Healthcare Trust Incorporated |
| Sector: Financials | |
| SubSector: REIT - Healthcare Facilities | |
| MarketCap: 698.614 Millions | |
| Recent Price: 26.60 Smart Investing & Trading Score: 100 | |
| Day Percent Change: 1.03% Day Change: 0.27 | |
| Week Change: 1.03% Year-to-date Change: -0.2% | |
| CHCT Links: Profile News Message Board | |
| Charts:- Daily , Weekly | |
| Add CHCT to Watchlist: View: Get Complete CHCT Trend Analysis ➞ | |
 | GS The Goldman Sachs Group, Inc. |
| Sector: Financials | |
| SubSector: Investment Brokerage - National | |
| MarketCap: 54579.3 Millions | |
| Recent Price: 431.95 Smart Investing & Trading Score: 100 | |
| Day Percent Change: 1.02% Day Change: 4.38 | |
| Week Change: 1.02% Year-to-date Change: 12.0% | |
| GS Links: Profile News Message Board | |
| Charts:- Daily , Weekly | |
| Add GS to Watchlist: View: Get Complete GS Trend Analysis ➞ | |
 | UVSP Univest Financial Corporation |
| Sector: Financials | |
| SubSector: Regional - Northeast Banks | |
| MarketCap: 467.999 Millions | |
| Recent Price: 21.43 Smart Investing & Trading Score: 100 | |
| Day Percent Change: 0.94% Day Change: 0.20 | |
| Week Change: 0.94% Year-to-date Change: -2.7% | |
| UVSP Links: Profile News Message Board | |
| Charts:- Daily , Weekly | |
| Add UVSP to Watchlist: View: Get Complete UVSP Trend Analysis ➞ | |
 | PIPR Piper Sandler Companies |
| Sector: Financials | |
| SubSector: Asset Management | |
| MarketCap: 759.603 Millions | |
| Recent Price: 198.95 Smart Investing & Trading Score: 100 | |
| Day Percent Change: 0.91% Day Change: 1.79 | |
| Week Change: 0.91% Year-to-date Change: 13.8% | |
| PIPR Links: Profile News Message Board | |
| Charts:- Daily , Weekly | |
| Add PIPR to Watchlist: View: Get Complete PIPR Trend Analysis ➞ | |
| For tabular summary view of above stock list: Summary View ➞ 0 - 25 , 25 - 50 , 50 - 75 , 75 - 100 , 100 - 125 , 125 - 150 , 150 - 175 , 175 - 200 , 200 - 225 , 225 - 250 , 250 - 275 , 275 - 300 , 300 - 325 , 325 - 350 , 350 - 375 , 375 - 400 , 400 - 425 , 425 - 450 , 450 - 475 , 475 - 500 , 500 - 525 , 525 - 550 , 550 - 575 , 575 - 600 , 600 - 625 , 625 - 650 , 650 - 675 , 675 - 700 , 700 - 725 , 725 - 750 , 750 - 775 , 775 - 800 , 800 - 825 , 825 - 850 , 850 - 875 , 875 - 900 , 900 - 925 , 925 - 950 , 950 - 975 , 975 - 1000 , 1000 - 1025 , 1025 - 1050 , 1050 - 1075 , 1075 - 1100 , 1100 - 1125 , 1125 - 1150 , 1150 - 1175 | ||
| Click To Change The Sort Order: By Market Cap or Company Size Performance: Year-to-date, Week and Day | |
| Select Chart Type: | ||
|
Best Stocks Today 12Stocks.com |
© 2024 12Stocks.com Terms & Conditions Privacy Contact Us
All Information Provided Only For Education And Not To Be Used For Investing or Trading. See Terms & Conditions


One More Thing ... Get Best Stocks Delivered Daily!
Never Ever Miss A Move With Our Top Ten Stocks Lists
Find Best Stocks In Any Market - Bull or Bear Market
Take A Peek At Our Top Ten Stocks Lists: Daily, Weekly, Year-to-Date & Top Trends
Find Best Stocks In Any Market - Bull or Bear Market
Take A Peek At Our Top Ten Stocks Lists: Daily, Weekly, Year-to-Date & Top Trends
Financial Stocks With Best Up Trends [0-bearish to 100-bullish]: Heartland [100], Fulton [100], B. Riley[100], ICICI Bank[100], Lazard [100], LPL [100], Highwoods Properties[100], Byline Bancorp[100], Cousins Properties[100], Associated Banc-Corp[100], PayPal [100]
Best Financial Stocks Year-to-Date:
Root [531.23%], Hippo [142.48%], Gladstone Capital[102.06%], Banco Macro[83%], B. Riley[82.92%], Grupo Financiero[81.93%], Banco BBVA[71.88%], Yiren Digital[63.62%], EverQuote [58.91%], Heritage Insurance[54.83%], Lufax Holding[51.79%] Best Financial Stocks This Week:
Heartland [19.15%], Fulton [9.96%], Territorial Bancorp[7.5%], Citizens [5.77%], Cartica Acquisition[4.84%], Hudson Pacific[4.81%], KE [4.42%], B. Riley[4.28%], Medical Properties[4.21%], NexGen Energy[4.08%], ICICI Bank[3.92%] Best Financial Stocks Daily:
Heartland [19.15%], Fulton [9.96%], Territorial Bancorp[7.50%], Citizens [5.77%], Cartica Acquisition[4.84%], Hudson Pacific[4.81%], KE [4.42%], B. Riley[4.28%], Medical Properties[4.21%], NexGen Energy[4.08%], ICICI Bank[3.92%]