
 Login Sign Up


| |||||
 |  | ||||

| 12Stocks.com Market Intelligence |
Best Financial Stocks
| In a hurry? Financial Stocks Lists: Performance Trends Table, Stock Charts
Sort Financial stocks: Daily, Weekly, Year-to-Date, Market Cap & Trends. Filter Financial stocks list by size:All Financial Large Mid-Range Small & MicroCap |
| 12Stocks.com Financial Stocks Performances & Trends Daily | |||||||||
|
|  The overall Smart Investing & Trading Score is 56 (0-bearish to 100-bullish) which puts Financial sector in short term neutral trend. The Smart Investing & Trading Score from previous trading session is 68 and hence a deterioration of trend.
| ||||||||
Here are the Smart Investing & Trading Scores of the most requested Financial stocks at 12Stocks.com (click stock name for detailed review):
|


| 12Stocks.com: Investing in Financial sector with Stocks | |
|
The following table helps investors and traders sort through current performance and trends (as measured by Smart Investing & Trading Score) of various
stocks in the Financial sector. Quick View: Move mouse or cursor over stock symbol (ticker) to view short-term Technical chart and over stock name to view long term chart. Click on  to add stock symbol to your watchlist and to add stock symbol to your watchlist and  to view watchlist. Click on any ticker or stock name for detailed market intelligence report for that stock. to view watchlist. Click on any ticker or stock name for detailed market intelligence report for that stock. |
12Stocks.com Performance of Stocks in Financial Sector
| Ticker | Stock Name | Watchlist | Category | Recent Price | Trend Score | Change % | YTD Change% |
| WASH | Washington Trust |   | Regional Banks | 25.99 | 67 | -1.81% | -19.73% |
| WAFD | Washington Federal | | S&L | 27.92 | 67 | -1.66% | -15.29% |
| BY | Byline Bancorp | | Regional Banks | 21.09 | 67 | -1.59% | -10.48% |
| ABCB | Ameris Bancorp | | Regional Banks | 47.51 | 67 | -1.53% | -10.44% |
| PGRE | Paramount | | Property Mgmt | 4.62 | 67 | -1.49% | -10.64% |
| FCF | First Commonwealth | | Regional Banks | 13.56 | 67 | -1.31% | -12.18% |
| DEA | Easterly Government | | REIT - Office | 11.72 | 67 | -1.26% | -12.80% |
| GTY | Getty Realty | | REIT - Retail | 27.04 | 67 | -1.24% | -7.46% |
| CZNC | Citizens & Northern | | Regional Banks | 17.65 | 67 | -1.12% | -21.31% |
| EBMT | Eagle Bancorp | | Regional Banks | 12.72 | 67 | -1.09% | -19.44% |
| BHLB | Berkshire Hills | | S&L | 22.10 | 67 | -1.07% | -10.99% |
| COLB | Columbia Banking | | S&L | 19.01 | 67 | -1.04% | -28.75% |
| VLY | Valley National | | Regional Banks | 7.77 | 67 | -0.89% | -28.45% |
| STBA | S&T Bancorp | | Regional Banks | 31.00 | 67 | -0.86% | -7.24% |
| SASR | Sandy Spring | | Regional Banks | 21.37 | 67 | -0.60% | -21.55% |
| ITIC | Investors Title | | Insurance | 162.88 | 67 | -0.46% | 0.46% |
| ROIC | Retail Opportunity | | REIT - Retail | 12.36 | 67 | -0.32% | -11.90% |
| AAT | American Assets | | REIT - Retail | 21.24 | 67 | -0.23% | -5.64% |
| O | Realty ome | | REIT - Retail | 53.80 | 67 | 0.24% | -6.30% |
| SYBT | Stock Yards | | Regional Banks | 46.18 | 67 | -4.01% | -10.31% |
| SMBK | Smart | | Regional Banks | 20.49 | 67 | -1.40% | -16.33% |
| LOB | Live Oak | | S&L | 34.28 | 66 | -14.02% | -24.66% |
| DRH | DiamondRock Hospitality | | REIT | 9.08 | 66 | -1.52% | -3.30% |
| YRD | Yiren Digital | | Credit Services | 5.04 | 66 | -0.79% | 61.54% |
| BRKH | Burtech Acquisition | | SPAC | 11.05 | 66 | 0.00% | 2.98% |
| For chart view version of above stock list: Chart View ➞ 0 - 25 , 25 - 50 , 50 - 75 , 75 - 100 , 100 - 125 , 125 - 150 , 150 - 175 , 175 - 200 , 200 - 225 , 225 - 250 , 250 - 275 , 275 - 300 , 300 - 325 , 325 - 350 , 350 - 375 , 375 - 400 , 400 - 425 , 425 - 450 , 450 - 475 , 475 - 500 , 500 - 525 , 525 - 550 , 550 - 575 , 575 - 600 , 600 - 625 , 625 - 650 , 650 - 675 , 675 - 700 , 700 - 725 , 725 - 750 , 750 - 775 , 775 - 800 , 800 - 825 , 825 - 850 , 850 - 875 , 875 - 900 , 900 - 925 , 925 - 950 , 950 - 975 , 975 - 1000 , 1000 - 1025 , 1025 - 1050 , 1050 - 1075 , 1075 - 1100 , 1100 - 1125 , 1125 - 1150 , 1150 - 1175 , 1175 - 1200 , 1200 - 1225 , 1225 - 1250 | ||
 | Click To Change The Sort Order: By Market Cap or Company Size Performance: Year-to-date, Week and Day |  |
|
Get the most comprehensive stock market coverage daily at 12Stocks.com ➞ Best Stocks Today ➞ Best Stocks Weekly ➞ Best Stocks Year-to-Date ➞ Best Stocks Trends ➞  Best Stocks Today 12Stocks.com Best Nasdaq Stocks ➞ Best S&P 500 Stocks ➞ Best Tech Stocks ➞ Best Biotech Stocks ➞ |
| Detailed Overview of Financial Stocks |
| Financial Technical Overview, Leaders & Laggards, Top Financial ETF Funds & Detailed Financial Stocks List, Charts, Trends & More |
| Financial Sector: Technical Analysis, Trends & YTD Performance | |
| Financial sector is composed of stocks
from banks, brokers, insurance, REITs
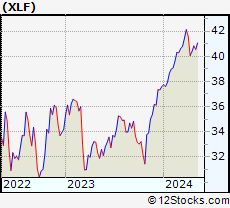
and services subsectors. Financial sector, as represented by XLF, an exchange-traded fund [ETF] that holds basket of Financial stocks (e.g, Bank of America, Goldman Sachs) is up by 8.72% and is currently outperforming the overall market by 3.56% year-to-date. Below is a quick view of Technical charts and trends: |
|
 XLF Weekly Chart |
|
| Long Term Trend: Very Good | |
| Medium Term Trend: Not Good | |
 XLF Daily Chart |
|
| Short Term Trend: Deteriorating | |
| Overall Trend Score: 56 | |
| YTD Performance: 8.72% | |
| **Trend Scores & Views Are Only For Educational Purposes And Not For Investing | |
| 12Stocks.com: Top Performing Financial Sector Stocks | ||||||||||||||||||||||||||||||||||||||||||||||||
 The top performing Financial sector stocks year to date are
Now, more recently, over last week, the top performing Financial sector stocks on the move are


|
||||||||||||||||||||||||||||||||||||||||||||||||
| 12Stocks.com: Investing in Financial Sector using Exchange Traded Funds | |
|
The following table shows list of key exchange traded funds (ETF) that
help investors track Financial Index. For detailed view, check out our ETF Funds section of our website. Quick View: Move mouse or cursor over ETF symbol (ticker) to view short-term Technical chart and over ETF name to view long term chart. Click on ticker or stock name for detailed view. Click on to add stock symbol to your watchlist and to view watchlist. |
12Stocks.com List of ETFs that track Financial Index
| Ticker | ETF Name | Watchlist | Recent Price | Smart Investing & Trading Score | Change % | Week % | Year-to-date % |
| XLF | Financial | | 40.88 | 56 | -0.58 | 1.24 | 8.72% |
| IAI | Broker-Dealers & Secs | | 112.15 | 48 | -0.66 | 1.01 | 3.34% |
| IYF | Financials | | 92.49 | 68 | -0.51 | 1.3 | 8.29% |
| IYG | Financial Services | | 64.56 | 76 | -0.54 | 1.8 | 8.07% |
| KRE | Regional Banking | | 48.47 | 67 | -1.10 | 2.43 | -7.55% |
| IXG | Global Financials | | 84.44 | 53 | -0.03 | 1.91 | 7.46% |
| VFH | Financials | | 99.12 | 68 | -0.60 | 1.4 | 7.44% |
| KBE | Bank | | 45.47 | 73 | -1.07 | 2.39 | -1.2% |
| FAS | Financial Bull 3X | | 101.43 | 61 | -1.72 | 3.57 | 22.72% |
| FAZ | Financial Bear 3X | | 10.79 | 40 | 1.70 | -3.66 | -21.07% |
| UYG | Financials | | 63.92 | 56 | -1.27 | 2.37 | 15.8% |
| IAT | Regional Banks | | 41.85 | 93 | -0.85 | 2.72 | 0.02% |
| KIE | Insurance | | 49.30 | 51 | -0.74 | 0.45 | 9.02% |
| PSCF | SmallCap Financials | | 46.29 | 65 | -1.59 | 1.8 | -5.88% |
| EUFN | Europe Financials | | 22.34 | 68 | -0.36 | 1.78 | 6.58% |
| PGF | Financial Preferred | | 14.57 | 37 | -1.09 | 0.28 | -0.07% |
| 12Stocks.com: Charts, Trends, Fundamental Data and Performances of Financial Stocks | |
|
We now take in-depth look at all Financial stocks including charts, multi-period performances and overall trends (as measured by Smart Investing & Trading Score). One can sort Financial stocks (click link to choose) by Daily, Weekly and by Year-to-Date performances. Also, one can sort by size of the company or by market capitalization. |
| Select Your Default Chart Type: | |||||
| |||||
| Click on stock symbol or name for detailed view. Click on to add stock symbol to your watchlist and to view watchlist. Quick View: Move mouse or cursor over "Daily" to quickly view daily Technical stock chart and over "Weekly" to view weekly Technical stock chart. | |||||

 | WASH Washington Trust Bancorp, Inc. |
| Sector: Financials | |
| SubSector: Regional - Northeast Banks | |
| MarketCap: 590.099 Millions | |
| Recent Price: 25.99 Smart Investing & Trading Score: 67 | |
| Day Percent Change: -1.81% Day Change: -0.48 | |
| Week Change: 1.72% Year-to-date Change: -19.7% | |
| WASH Links: Profile News Message Board | |
| Charts:- Daily , Weekly | |
| Add WASH to Watchlist: View: Get Complete WASH Trend Analysis ➞ | |
 | WAFD Washington Federal, Inc. |
| Sector: Financials | |
| SubSector: Savings & Loans | |
| MarketCap: 2219.2 Millions | |
| Recent Price: 27.92 Smart Investing & Trading Score: 67 | |
| Day Percent Change: -1.66% Day Change: -0.47 | |
| Week Change: 0.07% Year-to-date Change: -15.3% | |
| WAFD Links: Profile News Message Board | |
| Charts:- Daily , Weekly | |
| Add WAFD to Watchlist: View: Get Complete WAFD Trend Analysis ➞ | |
 | BY Byline Bancorp, Inc. |
| Sector: Financials | |
| SubSector: Regional - Midwest Banks | |
| MarketCap: 381.87 Millions | |
| Recent Price: 21.09 Smart Investing & Trading Score: 67 | |
| Day Percent Change: -1.59% Day Change: -0.34 | |
| Week Change: 1.79% Year-to-date Change: -10.5% | |
| BY Links: Profile News Message Board | |
| Charts:- Daily , Weekly | |
| Add BY to Watchlist: View: Get Complete BY Trend Analysis ➞ | |
 | ABCB Ameris Bancorp |
| Sector: Financials | |
| SubSector: Regional - Mid-Atlantic Banks | |
| MarketCap: 1537.79 Millions | |
| Recent Price: 47.51 Smart Investing & Trading Score: 67 | |
| Day Percent Change: -1.53% Day Change: -0.74 | |
| Week Change: 2.66% Year-to-date Change: -10.4% | |
| ABCB Links: Profile News Message Board | |
| Charts:- Daily , Weekly | |
| Add ABCB to Watchlist: View: Get Complete ABCB Trend Analysis ➞ | |
 | PGRE Paramount Group, Inc. |
| Sector: Financials | |
| SubSector: Property Management | |
| MarketCap: 1722.72 Millions | |
| Recent Price: 4.62 Smart Investing & Trading Score: 67 | |
| Day Percent Change: -1.49% Day Change: -0.07 | |
| Week Change: 1.09% Year-to-date Change: -10.6% | |
| PGRE Links: Profile News Message Board | |
| Charts:- Daily , Weekly | |
| Add PGRE to Watchlist: View: Get Complete PGRE Trend Analysis ➞ | |
 | FCF First Commonwealth Financial Corporation |
| Sector: Financials | |
| SubSector: Regional - Northeast Banks | |
| MarketCap: 900.299 Millions | |
| Recent Price: 13.56 Smart Investing & Trading Score: 67 | |
| Day Percent Change: -1.31% Day Change: -0.18 | |
| Week Change: 2.73% Year-to-date Change: -12.2% | |
| FCF Links: Profile News Message Board | |
| Charts:- Daily , Weekly | |
| Add FCF to Watchlist: View: Get Complete FCF Trend Analysis ➞ | |
 | DEA Easterly Government Properties, Inc. |
| Sector: Financials | |
| SubSector: REIT - Office | |
| MarketCap: 1832.56 Millions | |
| Recent Price: 11.72 Smart Investing & Trading Score: 67 | |
| Day Percent Change: -1.26% Day Change: -0.15 | |
| Week Change: 1.12% Year-to-date Change: -12.8% | |
| DEA Links: Profile News Message Board | |
| Charts:- Daily , Weekly | |
| Add DEA to Watchlist: View: Get Complete DEA Trend Analysis ➞ | |
 | GTY Getty Realty Corp. |
| Sector: Financials | |
| SubSector: REIT - Retail | |
| MarketCap: 926.114 Millions | |
| Recent Price: 27.04 Smart Investing & Trading Score: 67 | |
| Day Percent Change: -1.24% Day Change: -0.34 | |
| Week Change: 0.19% Year-to-date Change: -7.5% | |
| GTY Links: Profile News Message Board | |
| Charts:- Daily , Weekly | |
| Add GTY to Watchlist: View: Get Complete GTY Trend Analysis ➞ | |
 | CZNC Citizens & Northern Corporation |
| Sector: Financials | |
| SubSector: Regional - Mid-Atlantic Banks | |
| MarketCap: 274.459 Millions | |
| Recent Price: 17.65 Smart Investing & Trading Score: 67 | |
| Day Percent Change: -1.12% Day Change: -0.20 | |
| Week Change: -0.45% Year-to-date Change: -21.3% | |
| CZNC Links: Profile News Message Board | |
| Charts:- Daily , Weekly | |
| Add CZNC to Watchlist: View: Get Complete CZNC Trend Analysis ➞ | |
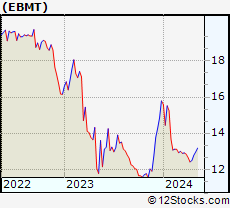 | EBMT Eagle Bancorp Montana, Inc. |
| Sector: Financials | |
| SubSector: Regional - Pacific Banks | |
| MarketCap: 106.929 Millions | |
| Recent Price: 12.72 Smart Investing & Trading Score: 67 | |
| Day Percent Change: -1.09% Day Change: -0.14 | |
| Week Change: 1.84% Year-to-date Change: -19.4% | |
| EBMT Links: Profile News Message Board | |
| Charts:- Daily , Weekly | |
| Add EBMT to Watchlist: View: Get Complete EBMT Trend Analysis ➞ | |
 | BHLB Berkshire Hills Bancorp, Inc. |
| Sector: Financials | |
| SubSector: Savings & Loans | |
| MarketCap: 686.33 Millions | |
| Recent Price: 22.10 Smart Investing & Trading Score: 67 | |
| Day Percent Change: -1.07% Day Change: -0.24 | |
| Week Change: 1.8% Year-to-date Change: -11.0% | |
| BHLB Links: Profile News Message Board | |
| Charts:- Daily , Weekly | |
| Add BHLB to Watchlist: View: Get Complete BHLB Trend Analysis ➞ | |
 | COLB Columbia Banking System, Inc. |
| Sector: Financials | |
| SubSector: Savings & Loans | |
| MarketCap: 1868.3 Millions | |
| Recent Price: 19.01 Smart Investing & Trading Score: 67 | |
| Day Percent Change: -1.04% Day Change: -0.20 | |
| Week Change: 3.82% Year-to-date Change: -28.8% | |
| COLB Links: Profile News Message Board | |
| Charts:- Daily , Weekly | |
| Add COLB to Watchlist: View: Get Complete COLB Trend Analysis ➞ | |
 | VLY Valley National Bancorp |
| Sector: Financials | |
| SubSector: Regional - Northeast Banks | |
| MarketCap: 2843.09 Millions | |
| Recent Price: 7.77 Smart Investing & Trading Score: 67 | |
| Day Percent Change: -0.89% Day Change: -0.07 | |
| Week Change: 0.78% Year-to-date Change: -28.5% | |
| VLY Links: Profile News Message Board | |
| Charts:- Daily , Weekly | |
| Add VLY to Watchlist: View: Get Complete VLY Trend Analysis ➞ | |
 | STBA S&T Bancorp, Inc. |
| Sector: Financials | |
| SubSector: Regional - Northeast Banks | |
| MarketCap: 1136.99 Millions | |
| Recent Price: 31.00 Smart Investing & Trading Score: 67 | |
| Day Percent Change: -0.86% Day Change: -0.27 | |
| Week Change: 1.74% Year-to-date Change: -7.2% | |
| STBA Links: Profile News Message Board | |
| Charts:- Daily , Weekly | |
| Add STBA to Watchlist: View: Get Complete STBA Trend Analysis ➞ | |
 | SASR Sandy Spring Bancorp, Inc. |
| Sector: Financials | |
| SubSector: Regional - Mid-Atlantic Banks | |
| MarketCap: 764.659 Millions | |
| Recent Price: 21.37 Smart Investing & Trading Score: 67 | |
| Day Percent Change: -0.60% Day Change: -0.13 | |
| Week Change: 2.94% Year-to-date Change: -21.6% | |
| SASR Links: Profile News Message Board | |
| Charts:- Daily , Weekly | |
| Add SASR to Watchlist: View: Get Complete SASR Trend Analysis ➞ | |
 | ITIC Investors Title Company |
| Sector: Financials | |
| SubSector: Surety & Title Insurance | |
| MarketCap: 219.518 Millions | |
| Recent Price: 162.88 Smart Investing & Trading Score: 67 | |
| Day Percent Change: -0.46% Day Change: -0.75 | |
| Week Change: 0.74% Year-to-date Change: 0.5% | |
| ITIC Links: Profile News Message Board | |
| Charts:- Daily , Weekly | |
| Add ITIC to Watchlist: View: Get Complete ITIC Trend Analysis ➞ | |
 | ROIC Retail Opportunity Investments Corp. |
| Sector: Financials | |
| SubSector: REIT - Retail | |
| MarketCap: 943.414 Millions | |
| Recent Price: 12.36 Smart Investing & Trading Score: 67 | |
| Day Percent Change: -0.32% Day Change: -0.04 | |
| Week Change: 0.65% Year-to-date Change: -11.9% | |
| ROIC Links: Profile News Message Board | |
| Charts:- Daily , Weekly | |
| Add ROIC to Watchlist: View: Get Complete ROIC Trend Analysis ➞ | |
 | AAT American Assets Trust, Inc. |
| Sector: Financials | |
| SubSector: REIT - Retail | |
| MarketCap: 1580.54 Millions | |
| Recent Price: 21.24 Smart Investing & Trading Score: 67 | |
| Day Percent Change: -0.23% Day Change: -0.05 | |
| Week Change: 1.19% Year-to-date Change: -5.6% | |
| AAT Links: Profile News Message Board | |
| Charts:- Daily , Weekly | |
| Add AAT to Watchlist: View: Get Complete AAT Trend Analysis ➞ | |
 | O Realty Income Corporation |
| Sector: Financials | |
| SubSector: REIT - Retail | |
| MarketCap: 17647.4 Millions | |
| Recent Price: 53.80 Smart Investing & Trading Score: 67 | |
| Day Percent Change: 0.24% Day Change: 0.13 | |
| Week Change: 1.43% Year-to-date Change: -6.3% | |
| O Links: Profile News Message Board | |
| Charts:- Daily , Weekly | |
| Add O to Watchlist: View: Get Complete O Trend Analysis ➞ | |
 | SYBT Stock Yards Bancorp, Inc. |
| Sector: Financials | |
| SubSector: Regional - Southeast Banks | |
| MarketCap: 629.235 Millions | |
| Recent Price: 46.18 Smart Investing & Trading Score: 67 | |
| Day Percent Change: -4.01% Day Change: -1.93 | |
| Week Change: 1.97% Year-to-date Change: -10.3% | |
| SYBT Links: Profile News Message Board | |
| Charts:- Daily , Weekly | |
| Add SYBT to Watchlist: View: Get Complete SYBT Trend Analysis ➞ | |
 | SMBK SmartFinancial, Inc. |
| Sector: Financials | |
| SubSector: Regional - Southeast Banks | |
| MarketCap: 174.035 Millions | |
| Recent Price: 20.49 Smart Investing & Trading Score: 67 | |
| Day Percent Change: -1.40% Day Change: -0.29 | |
| Week Change: 2.96% Year-to-date Change: -16.3% | |
| SMBK Links: Profile News Message Board | |
| Charts:- Daily , Weekly | |
| Add SMBK to Watchlist: View: Get Complete SMBK Trend Analysis ➞ | |
 | LOB Live Oak Bancshares, Inc. |
| Sector: Financials | |
| SubSector: Savings & Loans | |
| MarketCap: 394.23 Millions | |
| Recent Price: 34.28 Smart Investing & Trading Score: 66 | |
| Day Percent Change: -14.02% Day Change: -5.59 | |
| Week Change: -9.55% Year-to-date Change: -24.7% | |
| LOB Links: Profile News Message Board | |
| Charts:- Daily , Weekly | |
| Add LOB to Watchlist: View: Get Complete LOB Trend Analysis ➞ | |
 | DRH DiamondRock Hospitality Company |
| Sector: Financials | |
| SubSector: REIT - Hotel/Motel | |
| MarketCap: 964 Millions | |
| Recent Price: 9.08 Smart Investing & Trading Score: 66 | |
| Day Percent Change: -1.52% Day Change: -0.14 | |
| Week Change: 2.83% Year-to-date Change: -3.3% | |
| DRH Links: Profile News Message Board | |
| Charts:- Daily , Weekly | |
| Add DRH to Watchlist: View: Get Complete DRH Trend Analysis ➞ | |
 | YRD Yiren Digital Ltd. |
| Sector: Financials | |
| SubSector: Credit Services | |
| MarketCap: 330.208 Millions | |
| Recent Price: 5.04 Smart Investing & Trading Score: 66 | |
| Day Percent Change: -0.79% Day Change: -0.04 | |
| Week Change: 4.35% Year-to-date Change: 61.5% | |
| YRD Links: Profile News Message Board | |
| Charts:- Daily , Weekly | |
| Add YRD to Watchlist: View: Get Complete YRD Trend Analysis ➞ | |
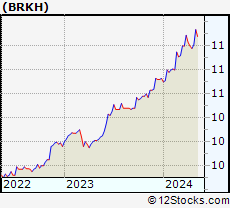 | BRKH Burtech Acquisition Corp. |
| Sector: Financials | |
| SubSector: SPAC | |
| MarketCap: 182 Millions | |
| Recent Price: 11.05 Smart Investing & Trading Score: 66 | |
| Day Percent Change: 0.00% Day Change: 0.00 | |
| Week Change: 0.65% Year-to-date Change: 3.0% | |
| BRKH Links: Profile News Message Board | |
| Charts:- Daily , Weekly | |
| Add BRKH to Watchlist: View: Get Complete BRKH Trend Analysis ➞ | |
| For tabular summary view of above stock list: Summary View ➞ 0 - 25 , 25 - 50 , 50 - 75 , 75 - 100 , 100 - 125 , 125 - 150 , 150 - 175 , 175 - 200 , 200 - 225 , 225 - 250 , 250 - 275 , 275 - 300 , 300 - 325 , 325 - 350 , 350 - 375 , 375 - 400 , 400 - 425 , 425 - 450 , 450 - 475 , 475 - 500 , 500 - 525 , 525 - 550 , 550 - 575 , 575 - 600 , 600 - 625 , 625 - 650 , 650 - 675 , 675 - 700 , 700 - 725 , 725 - 750 , 750 - 775 , 775 - 800 , 800 - 825 , 825 - 850 , 850 - 875 , 875 - 900 , 900 - 925 , 925 - 950 , 950 - 975 , 975 - 1000 , 1000 - 1025 , 1025 - 1050 , 1050 - 1075 , 1075 - 1100 , 1100 - 1125 , 1125 - 1150 , 1150 - 1175 , 1175 - 1200 , 1200 - 1225 , 1225 - 1250 | ||
| Click To Change The Sort Order: By Market Cap or Company Size Performance: Year-to-date, Week and Day | |
| Select Chart Type: | ||
|
Best Stocks Today 12Stocks.com |
© 2024 12Stocks.com Terms & Conditions Privacy Contact Us
All Information Provided Only For Education And Not To Be Used For Investing or Trading. See Terms & Conditions


One More Thing ... Get Best Stocks Delivered Daily!
Never Ever Miss A Move With Our Top Ten Stocks Lists
Find Best Stocks In Any Market - Bull or Bear Market
Take A Peek At Our Top Ten Stocks Lists: Daily, Weekly, Year-to-Date & Top Trends
Find Best Stocks In Any Market - Bull or Bear Market
Take A Peek At Our Top Ten Stocks Lists: Daily, Weekly, Year-to-Date & Top Trends
Financial Stocks With Best Up Trends [0-bearish to 100-bullish]: B. Riley[100], Deutsche Bank[100], Central Pacific[100], Virtu [100], Trustmark [100], Equity Residential[100], Third Coast[100], UDR [100], AvalonBay Communities[100], Capital Southwest[100], LTC Properties[100]
Best Financial Stocks Year-to-Date:
Root [465%], Hippo [128.87%], Gladstone Capital[98.88%], Banco Macro[71.01%], Grupo Financiero[70.81%], B. Riley[65.27%], Banco BBVA[64.71%], Yiren Digital[61.54%], Heritage Insurance[59.97%], Fidelis Insurance[56.23%], First [52.08%] Best Financial Stocks This Week:
B. Riley[73.54%], Oportun [34.91%], Provident Bancorp[19.9%], Cipher Mining[15.36%], First Citizens[14.87%], Root [14.33%], TOP [14.04%], Globe Life[13.19%], Deutsche Bank[12.63%], Trustmark [11.56%], Peakstone Realty[11.41%] Best Financial Stocks Daily:
B. Riley[16.61%], First Citizens[9.80%], Deutsche Bank[8.74%], Provident Bancorp[8.10%], Barclays [7.92%], MicroSectors Gold[5.71%], Fangdd Network[5.41%], Atlanticus [4.90%], Central Pacific[4.06%], Bridge [3.63%], Meta [3.58%]