
 Login Sign Up


| |||||
 |  | ||||

| 12Stocks.com Market Intelligence |
Best Financial Stocks
| In a hurry? Financial Stocks Lists: Performance Trends Table, Stock Charts
Sort Financial stocks: Daily, Weekly, Year-to-Date, Market Cap & Trends. Filter Financial stocks list by size:All Financial Large Mid-Range Small & MicroCap |
| 12Stocks.com Financial Stocks Performances & Trends Daily | |||||||||
|
|  The overall Smart Investing & Trading Score is 56 (0-bearish to 100-bullish) which puts Financial sector in short term neutral trend. The Smart Investing & Trading Score from previous trading session is 68 and hence a deterioration of trend.
| ||||||||
Here are the Smart Investing & Trading Scores of the most requested Financial stocks at 12Stocks.com (click stock name for detailed review):
|


| 12Stocks.com: Investing in Financial sector with Stocks | |
|
The following table helps investors and traders sort through current performance and trends (as measured by Smart Investing & Trading Score) of various
stocks in the Financial sector. Quick View: Move mouse or cursor over stock symbol (ticker) to view short-term Technical chart and over stock name to view long term chart. Click on  to add stock symbol to your watchlist and to add stock symbol to your watchlist and  to view watchlist. Click on any ticker or stock name for detailed market intelligence report for that stock. to view watchlist. Click on any ticker or stock name for detailed market intelligence report for that stock. |
12Stocks.com Performance of Stocks in Financial Sector
| Ticker | Stock Name | Watchlist | Category | Recent Price | Trend Score | Change % | YTD Change% |
| EZPW | EZCORP |   | Credit Services | 11.07 | 83 | -3.74% | 26.66% |
| TRTX | TPG RE | | Mortgage | 7.55 | 83 | -3.70% | 16.15% |
| LMND | Lemonade | | Insurance Property & Casualty | 17.06 | 83 | -2.01% | 5.77% |
| MCY | Mercury General | | Insurance | 54.30 | 83 | -1.67% | 45.54% |
| VIST | Vista Oil | | Asset Mgmt | 42.73 | 83 | -1.52% | 44.80% |
| JOE | St. Joe | | Real Estatet | 57.81 | 83 | 1.67% | -3.94% |
| SLAMU | Slam | | SPAC | 11.06 | 83 | 0.00% | 1.94% |
| WHF | WhiteHorse Finance | | Asset Mgmt | 12.82 | 83 | -1.38% | 4.23% |
| CBSH | Commerce Bancshares | | Regional Banks | 55.44 | 83 | -0.86% | 3.80% |
| UMH | UMH Properties | | REIT - | 15.63 | 83 | -0.38% | 2.02% |
| PFSI | PennyMac | | Mortgage | 86.20 | 81 | -6.38% | -2.46% |
| OSBC | Old Second | | Regional Banks | 14.13 | 81 | -2.55% | -8.48% |
| UFCS | United Fire | | Insurance | 22.42 | 81 | -1.28% | 11.43% |
| FITB | Fifth Third | | Regional Banks | 36.82 | 81 | -1.10% | 6.76% |
| GS | Goldman Sachs | | Brokerage | 420.05 | 81 | -0.71% | 8.89% |
| CPT | Camden Property | | REIT | 98.21 | 81 | -0.66% | -1.09% |
| OLP | One Liberty | | REIT - | 22.62 | 81 | -0.62% | 3.24% |
| BNRE | Brookfield Reinsurance | | Insurance - Reinsurance | 40.29 | 81 | -0.47% | -0.05% |
| NTB | Bank of N.T. Butterfield & Son | | Foreign Banks | 34.12 | 80 | 1.37% | 6.59% |
| WELL | Welltower | | REIT | 94.00 | 80 | 0.32% | 4.25% |
| CSGP | CoStar | | Property Mgmt | 90.34 | 80 | -1.75% | 3.38% |
| NXRT | NexPoint Residential | | REIT | 32.85 | 80 | -1.35% | -4.59% |
| THG | Hanover Insurance | | Insurance | 131.35 | 80 | -0.96% | 8.18% |
| FFBC | First | | Regional Banks | 22.36 | 80 | -0.84% | -5.85% |
| HWC | Hancock Whitney | | Regional Banks | 46.18 | 80 | -0.62% | -4.96% |
| For chart view version of above stock list: Chart View ➞ 0 - 25 , 25 - 50 , 50 - 75 , 75 - 100 , 100 - 125 , 125 - 150 , 150 - 175 , 175 - 200 , 200 - 225 , 225 - 250 , 250 - 275 , 275 - 300 , 300 - 325 , 325 - 350 , 350 - 375 , 375 - 400 , 400 - 425 , 425 - 450 , 450 - 475 , 475 - 500 , 500 - 525 , 525 - 550 , 550 - 575 , 575 - 600 , 600 - 625 , 625 - 650 , 650 - 675 , 675 - 700 , 700 - 725 , 725 - 750 , 750 - 775 , 775 - 800 , 800 - 825 , 825 - 850 , 850 - 875 , 875 - 900 , 900 - 925 , 925 - 950 , 950 - 975 , 975 - 1000 , 1000 - 1025 , 1025 - 1050 , 1050 - 1075 , 1075 - 1100 , 1100 - 1125 , 1125 - 1150 , 1150 - 1175 , 1175 - 1200 , 1200 - 1225 , 1225 - 1250 | ||
 | Click To Change The Sort Order: By Market Cap or Company Size Performance: Year-to-date, Week and Day |  |
|
Get the most comprehensive stock market coverage daily at 12Stocks.com ➞ Best Stocks Today ➞ Best Stocks Weekly ➞ Best Stocks Year-to-Date ➞ Best Stocks Trends ➞  Best Stocks Today 12Stocks.com Best Nasdaq Stocks ➞ Best S&P 500 Stocks ➞ Best Tech Stocks ➞ Best Biotech Stocks ➞ |
| Detailed Overview of Financial Stocks |
| Financial Technical Overview, Leaders & Laggards, Top Financial ETF Funds & Detailed Financial Stocks List, Charts, Trends & More |
| Financial Sector: Technical Analysis, Trends & YTD Performance | |
| Financial sector is composed of stocks
from banks, brokers, insurance, REITs
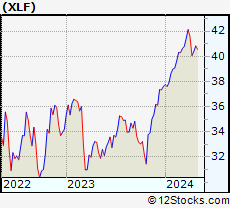
and services subsectors. Financial sector, as represented by XLF, an exchange-traded fund [ETF] that holds basket of Financial stocks (e.g, Bank of America, Goldman Sachs) is up by 8.72% and is currently outperforming the overall market by 3.56% year-to-date. Below is a quick view of Technical charts and trends: |
|
 XLF Weekly Chart |
|
| Long Term Trend: Very Good | |
| Medium Term Trend: Not Good | |
 XLF Daily Chart |
|
| Short Term Trend: Deteriorating | |
| Overall Trend Score: 56 | |
| YTD Performance: 8.72% | |
| **Trend Scores & Views Are Only For Educational Purposes And Not For Investing | |
| 12Stocks.com: Top Performing Financial Sector Stocks | ||||||||||||||||||||||||||||||||||||||||||||||||
 The top performing Financial sector stocks year to date are
Now, more recently, over last week, the top performing Financial sector stocks on the move are


|
||||||||||||||||||||||||||||||||||||||||||||||||
| 12Stocks.com: Investing in Financial Sector using Exchange Traded Funds | |
|
The following table shows list of key exchange traded funds (ETF) that
help investors track Financial Index. For detailed view, check out our ETF Funds section of our website. Quick View: Move mouse or cursor over ETF symbol (ticker) to view short-term Technical chart and over ETF name to view long term chart. Click on ticker or stock name for detailed view. Click on to add stock symbol to your watchlist and to view watchlist. |
12Stocks.com List of ETFs that track Financial Index
| Ticker | ETF Name | Watchlist | Recent Price | Smart Investing & Trading Score | Change % | Week % | Year-to-date % |
| XLF | Financial | | 40.88 | 56 | -0.58 | 1.24 | 8.72% |
| IAI | Broker-Dealers & Secs | | 112.15 | 48 | -0.66 | 1.01 | 3.34% |
| IYF | Financials | | 92.49 | 68 | -0.51 | 1.3 | 8.29% |
| IYG | Financial Services | | 64.56 | 76 | -0.54 | 1.8 | 8.07% |
| KRE | Regional Banking | | 48.47 | 67 | -1.10 | 2.43 | -7.55% |
| IXG | Global Financials | | 84.44 | 53 | -0.03 | 1.91 | 7.46% |
| VFH | Financials | | 99.12 | 68 | -0.60 | 1.4 | 7.44% |
| KBE | Bank | | 45.47 | 73 | -1.07 | 2.39 | -1.2% |
| FAS | Financial Bull 3X | | 101.43 | 61 | -1.72 | 3.57 | 22.72% |
| FAZ | Financial Bear 3X | | 10.79 | 40 | 1.70 | -3.66 | -21.07% |
| UYG | Financials | | 63.92 | 56 | -1.27 | 2.37 | 15.8% |
| IAT | Regional Banks | | 41.85 | 93 | -0.85 | 2.72 | 0.02% |
| KIE | Insurance | | 49.30 | 51 | -0.74 | 0.45 | 9.02% |
| PSCF | SmallCap Financials | | 46.29 | 65 | -1.59 | 1.8 | -5.88% |
| EUFN | Europe Financials | | 22.34 | 68 | -0.36 | 1.78 | 6.58% |
| PGF | Financial Preferred | | 14.57 | 37 | -1.09 | 0.28 | -0.07% |
| 12Stocks.com: Charts, Trends, Fundamental Data and Performances of Financial Stocks | |
|
We now take in-depth look at all Financial stocks including charts, multi-period performances and overall trends (as measured by Smart Investing & Trading Score). One can sort Financial stocks (click link to choose) by Daily, Weekly and by Year-to-Date performances. Also, one can sort by size of the company or by market capitalization. |
| Select Your Default Chart Type: | |||||
| |||||
| Click on stock symbol or name for detailed view. Click on to add stock symbol to your watchlist and to view watchlist. Quick View: Move mouse or cursor over "Daily" to quickly view daily Technical stock chart and over "Weekly" to view weekly Technical stock chart. | |||||

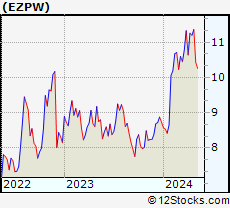 | EZPW EZCORP, Inc. |
| Sector: Financials | |
| SubSector: Credit Services | |
| MarketCap: 236.408 Millions | |
| Recent Price: 11.07 Smart Investing & Trading Score: 83 | |
| Day Percent Change: -3.74% Day Change: -0.43 | |
| Week Change: -1.16% Year-to-date Change: 26.7% | |
| EZPW Links: Profile News Message Board | |
| Charts:- Daily , Weekly | |
| Add EZPW to Watchlist: View: Get Complete EZPW Trend Analysis ➞ | |
 | TRTX TPG RE Finance Trust, Inc. |
| Sector: Financials | |
| SubSector: Mortgage Investment | |
| MarketCap: 607.739 Millions | |
| Recent Price: 7.55 Smart Investing & Trading Score: 83 | |
| Day Percent Change: -3.70% Day Change: -0.29 | |
| Week Change: 0.53% Year-to-date Change: 16.2% | |
| TRTX Links: Profile News Message Board | |
| Charts:- Daily , Weekly | |
| Add TRTX to Watchlist: View: Get Complete TRTX Trend Analysis ➞ | |
 | LMND Lemonade, Inc. |
| Sector: Financials | |
| SubSector: Insurance Property & Casualty | |
| MarketCap: 56457 Millions | |
| Recent Price: 17.06 Smart Investing & Trading Score: 83 | |
| Day Percent Change: -2.01% Day Change: -0.35 | |
| Week Change: 6.09% Year-to-date Change: 5.8% | |
| LMND Links: Profile News Message Board | |
| Charts:- Daily , Weekly | |
| Add LMND to Watchlist: View: Get Complete LMND Trend Analysis ➞ | |
 | MCY Mercury General Corporation |
| Sector: Financials | |
| SubSector: Property & Casualty Insurance | |
| MarketCap: 2122.12 Millions | |
| Recent Price: 54.30 Smart Investing & Trading Score: 83 | |
| Day Percent Change: -1.67% Day Change: -0.92 | |
| Week Change: 1.25% Year-to-date Change: 45.5% | |
| MCY Links: Profile News Message Board | |
| Charts:- Daily , Weekly | |
| Add MCY to Watchlist: View: Get Complete MCY Trend Analysis ➞ | |
 | VIST Vista Oil & Gas, S.A.B. de C.V. |
| Sector: Financials | |
| SubSector: Asset Management | |
| MarketCap: 201.603 Millions | |
| Recent Price: 42.73 Smart Investing & Trading Score: 83 | |
| Day Percent Change: -1.52% Day Change: -0.66 | |
| Week Change: 1.91% Year-to-date Change: 44.8% | |
| VIST Links: Profile News Message Board | |
| Charts:- Daily , Weekly | |
| Add VIST to Watchlist: View: Get Complete VIST Trend Analysis ➞ | |
 | JOE The St. Joe Company |
| Sector: Financials | |
| SubSector: Real Estate Development | |
| MarketCap: 1029.39 Millions | |
| Recent Price: 57.81 Smart Investing & Trading Score: 83 | |
| Day Percent Change: 1.67% Day Change: 0.95 | |
| Week Change: 5.34% Year-to-date Change: -3.9% | |
| JOE Links: Profile News Message Board | |
| Charts:- Daily , Weekly | |
| Add JOE to Watchlist: View: Get Complete JOE Trend Analysis ➞ | |
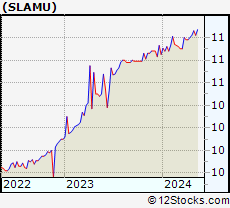 | SLAMU Slam Corp. |
| Sector: Financials | |
| SubSector: SPAC | |
| MarketCap: 422 Millions | |
| Recent Price: 11.06 Smart Investing & Trading Score: 83 | |
| Day Percent Change: 0.00% Day Change: 0.00 | |
| Week Change: 0.36% Year-to-date Change: 1.9% | |
| SLAMU Links: Profile News Message Board | |
| Charts:- Daily , Weekly | |
| Add SLAMU to Watchlist: View: Get Complete SLAMU Trend Analysis ➞ | |
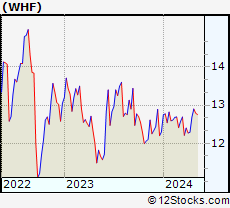 | WHF WhiteHorse Finance, Inc. |
| Sector: Financials | |
| SubSector: Asset Management | |
| MarketCap: 156.903 Millions | |
| Recent Price: 12.82 Smart Investing & Trading Score: 83 | |
| Day Percent Change: -1.38% Day Change: -0.18 | |
| Week Change: 1.02% Year-to-date Change: 4.2% | |
| WHF Links: Profile News Message Board | |
| Charts:- Daily , Weekly | |
| Add WHF to Watchlist: View: Get Complete WHF Trend Analysis ➞ | |
 | CBSH Commerce Bancshares, Inc. |
| Sector: Financials | |
| SubSector: Regional - Midwest Banks | |
| MarketCap: 6201.5 Millions | |
| Recent Price: 55.44 Smart Investing & Trading Score: 83 | |
| Day Percent Change: -0.86% Day Change: -0.48 | |
| Week Change: 2.95% Year-to-date Change: 3.8% | |
| CBSH Links: Profile News Message Board | |
| Charts:- Daily , Weekly | |
| Add CBSH to Watchlist: View: Get Complete CBSH Trend Analysis ➞ | |
 | UMH UMH Properties, Inc. |
| Sector: Financials | |
| SubSector: REIT - Diversified | |
| MarketCap: 433.353 Millions | |
| Recent Price: 15.63 Smart Investing & Trading Score: 83 | |
| Day Percent Change: -0.38% Day Change: -0.06 | |
| Week Change: 1.69% Year-to-date Change: 2.0% | |
| UMH Links: Profile News Message Board | |
| Charts:- Daily , Weekly | |
| Add UMH to Watchlist: View: Get Complete UMH Trend Analysis ➞ | |
 | PFSI PennyMac Financial Services, Inc. |
| Sector: Financials | |
| SubSector: Mortgage Investment | |
| MarketCap: 1588.09 Millions | |
| Recent Price: 86.20 Smart Investing & Trading Score: 81 | |
| Day Percent Change: -6.38% Day Change: -5.87 | |
| Week Change: -2% Year-to-date Change: -2.5% | |
| PFSI Links: Profile News Message Board | |
| Charts:- Daily , Weekly | |
| Add PFSI to Watchlist: View: Get Complete PFSI Trend Analysis ➞ | |
 | OSBC Old Second Bancorp, Inc. |
| Sector: Financials | |
| SubSector: Regional - Midwest Banks | |
| MarketCap: 237.17 Millions | |
| Recent Price: 14.13 Smart Investing & Trading Score: 81 | |
| Day Percent Change: -2.55% Day Change: -0.37 | |
| Week Change: -2.08% Year-to-date Change: -8.5% | |
| OSBC Links: Profile News Message Board | |
| Charts:- Daily , Weekly | |
| Add OSBC to Watchlist: View: Get Complete OSBC Trend Analysis ➞ | |
 | UFCS United Fire Group, Inc. |
| Sector: Financials | |
| SubSector: Property & Casualty Insurance | |
| MarketCap: 862.812 Millions | |
| Recent Price: 22.42 Smart Investing & Trading Score: 81 | |
| Day Percent Change: -1.28% Day Change: -0.29 | |
| Week Change: -1.67% Year-to-date Change: 11.4% | |
| UFCS Links: Profile News Message Board | |
| Charts:- Daily , Weekly | |
| Add UFCS to Watchlist: View: Get Complete UFCS Trend Analysis ➞ | |
 | FITB Fifth Third Bancorp |
| Sector: Financials | |
| SubSector: Regional - Midwest Banks | |
| MarketCap: 10197 Millions | |
| Recent Price: 36.82 Smart Investing & Trading Score: 81 | |
| Day Percent Change: -1.10% Day Change: -0.41 | |
| Week Change: 1.57% Year-to-date Change: 6.8% | |
| FITB Links: Profile News Message Board | |
| Charts:- Daily , Weekly | |
| Add FITB to Watchlist: View: Get Complete FITB Trend Analysis ➞ | |
 | GS The Goldman Sachs Group, Inc. |
| Sector: Financials | |
| SubSector: Investment Brokerage - National | |
| MarketCap: 54579.3 Millions | |
| Recent Price: 420.05 Smart Investing & Trading Score: 81 | |
| Day Percent Change: -0.71% Day Change: -2.99 | |
| Week Change: 3.97% Year-to-date Change: 8.9% | |
| GS Links: Profile News Message Board | |
| Charts:- Daily , Weekly | |
| Add GS to Watchlist: View: Get Complete GS Trend Analysis ➞ | |
 | CPT Camden Property Trust |
| Sector: Financials | |
| SubSector: REIT - Residential | |
| MarketCap: 7535.21 Millions | |
| Recent Price: 98.21 Smart Investing & Trading Score: 81 | |
| Day Percent Change: -0.66% Day Change: -0.65 | |
| Week Change: 1.99% Year-to-date Change: -1.1% | |
| CPT Links: Profile News Message Board | |
| Charts:- Daily , Weekly | |
| Add CPT to Watchlist: View: Get Complete CPT Trend Analysis ➞ | |
 | OLP One Liberty Properties, Inc. |
| Sector: Financials | |
| SubSector: REIT - Diversified | |
| MarketCap: 378.353 Millions | |
| Recent Price: 22.62 Smart Investing & Trading Score: 81 | |
| Day Percent Change: -0.62% Day Change: -0.14 | |
| Week Change: 2.17% Year-to-date Change: 3.2% | |
| OLP Links: Profile News Message Board | |
| Charts:- Daily , Weekly | |
| Add OLP to Watchlist: View: Get Complete OLP Trend Analysis ➞ | |
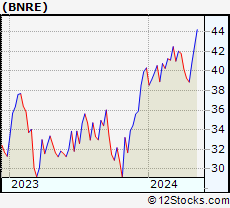 | BNRE Brookfield Reinsurance Ltd. |
| Sector: Financials | |
| SubSector: Insurance - Reinsurance | |
| MarketCap: 468 Millions | |
| Recent Price: 40.29 Smart Investing & Trading Score: 81 | |
| Day Percent Change: -0.47% Day Change: -0.19 | |
| Week Change: 3.68% Year-to-date Change: -0.1% | |
| BNRE Links: Profile News Message Board | |
| Charts:- Daily , Weekly | |
| Add BNRE to Watchlist: View: Get Complete BNRE Trend Analysis ➞ | |
 | NTB The Bank of N.T. Butterfield & Son Limited |
| Sector: Financials | |
| SubSector: Foreign Regional Banks | |
| MarketCap: 889.379 Millions | |
| Recent Price: 34.12 Smart Investing & Trading Score: 80 | |
| Day Percent Change: 1.37% Day Change: 0.46 | |
| Week Change: 9.85% Year-to-date Change: 6.6% | |
| NTB Links: Profile News Message Board | |
| Charts:- Daily , Weekly | |
| Add NTB to Watchlist: View: Get Complete NTB Trend Analysis ➞ | |
 | WELL Welltower Inc. |
| Sector: Financials | |
| SubSector: REIT - Healthcare Facilities | |
| MarketCap: 21398.8 Millions | |
| Recent Price: 94.00 Smart Investing & Trading Score: 80 | |
| Day Percent Change: 0.32% Day Change: 0.30 | |
| Week Change: 2.93% Year-to-date Change: 4.3% | |
| WELL Links: Profile News Message Board | |
| Charts:- Daily , Weekly | |
| Add WELL to Watchlist: View: Get Complete WELL Trend Analysis ➞ | |
 | CSGP CoStar Group, Inc. |
| Sector: Financials | |
| SubSector: Property Management | |
| MarketCap: 21454.4 Millions | |
| Recent Price: 90.34 Smart Investing & Trading Score: 80 | |
| Day Percent Change: -1.75% Day Change: -1.61 | |
| Week Change: 7.22% Year-to-date Change: 3.4% | |
| CSGP Links: Profile News Message Board | |
| Charts:- Daily , Weekly | |
| Add CSGP to Watchlist: View: Get Complete CSGP Trend Analysis ➞ | |
 | NXRT NexPoint Residential Trust, Inc. |
| Sector: Financials | |
| SubSector: REIT - Residential | |
| MarketCap: 839.161 Millions | |
| Recent Price: 32.85 Smart Investing & Trading Score: 80 | |
| Day Percent Change: -1.35% Day Change: -0.45 | |
| Week Change: 2.3% Year-to-date Change: -4.6% | |
| NXRT Links: Profile News Message Board | |
| Charts:- Daily , Weekly | |
| Add NXRT to Watchlist: View: Get Complete NXRT Trend Analysis ➞ | |
 | THG The Hanover Insurance Group, Inc. |
| Sector: Financials | |
| SubSector: Property & Casualty Insurance | |
| MarketCap: 3677.92 Millions | |
| Recent Price: 131.35 Smart Investing & Trading Score: 80 | |
| Day Percent Change: -0.96% Day Change: -1.27 | |
| Week Change: 0.21% Year-to-date Change: 8.2% | |
| THG Links: Profile News Message Board | |
| Charts:- Daily , Weekly | |
| Add THG to Watchlist: View: Get Complete THG Trend Analysis ➞ | |
 | FFBC First Financial Bancorp. |
| Sector: Financials | |
| SubSector: Regional - Midwest Banks | |
| MarketCap: 1363.7 Millions | |
| Recent Price: 22.36 Smart Investing & Trading Score: 80 | |
| Day Percent Change: -0.84% Day Change: -0.19 | |
| Week Change: 2.15% Year-to-date Change: -5.9% | |
| FFBC Links: Profile News Message Board | |
| Charts:- Daily , Weekly | |
| Add FFBC to Watchlist: View: Get Complete FFBC Trend Analysis ➞ | |
 | HWC Hancock Whitney Corporation |
| Sector: Financials | |
| SubSector: Regional - Southeast Banks | |
| MarketCap: 1438.55 Millions | |
| Recent Price: 46.18 Smart Investing & Trading Score: 80 | |
| Day Percent Change: -0.62% Day Change: -0.29 | |
| Week Change: 4.34% Year-to-date Change: -5.0% | |
| HWC Links: Profile News Message Board | |
| Charts:- Daily , Weekly | |
| Add HWC to Watchlist: View: Get Complete HWC Trend Analysis ➞ | |
| For tabular summary view of above stock list: Summary View ➞ 0 - 25 , 25 - 50 , 50 - 75 , 75 - 100 , 100 - 125 , 125 - 150 , 150 - 175 , 175 - 200 , 200 - 225 , 225 - 250 , 250 - 275 , 275 - 300 , 300 - 325 , 325 - 350 , 350 - 375 , 375 - 400 , 400 - 425 , 425 - 450 , 450 - 475 , 475 - 500 , 500 - 525 , 525 - 550 , 550 - 575 , 575 - 600 , 600 - 625 , 625 - 650 , 650 - 675 , 675 - 700 , 700 - 725 , 725 - 750 , 750 - 775 , 775 - 800 , 800 - 825 , 825 - 850 , 850 - 875 , 875 - 900 , 900 - 925 , 925 - 950 , 950 - 975 , 975 - 1000 , 1000 - 1025 , 1025 - 1050 , 1050 - 1075 , 1075 - 1100 , 1100 - 1125 , 1125 - 1150 , 1150 - 1175 , 1175 - 1200 , 1200 - 1225 , 1225 - 1250 | ||
| Click To Change The Sort Order: By Market Cap or Company Size Performance: Year-to-date, Week and Day | |
| Select Chart Type: | ||
|
Best Stocks Today 12Stocks.com |
© 2024 12Stocks.com Terms & Conditions Privacy Contact Us
All Information Provided Only For Education And Not To Be Used For Investing or Trading. See Terms & Conditions


One More Thing ... Get Best Stocks Delivered Daily!
Never Ever Miss A Move With Our Top Ten Stocks Lists
Find Best Stocks In Any Market - Bull or Bear Market
Take A Peek At Our Top Ten Stocks Lists: Daily, Weekly, Year-to-Date & Top Trends
Find Best Stocks In Any Market - Bull or Bear Market
Take A Peek At Our Top Ten Stocks Lists: Daily, Weekly, Year-to-Date & Top Trends
Financial Stocks With Best Up Trends [0-bearish to 100-bullish]: B. Riley[100], Deutsche Bank[100], Central Pacific[100], Virtu [100], Trustmark [100], Equity Residential[100], Third Coast[100], UDR [100], AvalonBay Communities[100], Capital Southwest[100], LTC Properties[100]
Best Financial Stocks Year-to-Date:
Root [465%], Hippo [128.87%], Gladstone Capital[98.88%], Banco Macro[71.01%], Grupo Financiero[70.81%], B. Riley[65.27%], Banco BBVA[64.71%], Yiren Digital[61.54%], Heritage Insurance[59.97%], Fidelis Insurance[56.23%], First [52.08%] Best Financial Stocks This Week:
B. Riley[73.54%], Oportun [34.91%], Provident Bancorp[19.9%], Cipher Mining[15.36%], First Citizens[14.87%], Root [14.33%], TOP [14.04%], Globe Life[13.19%], Deutsche Bank[12.63%], Trustmark [11.56%], Peakstone Realty[11.41%] Best Financial Stocks Daily:
B. Riley[16.61%], First Citizens[9.80%], Deutsche Bank[8.74%], Provident Bancorp[8.10%], Barclays [7.92%], MicroSectors Gold[5.71%], Fangdd Network[5.41%], Atlanticus [4.90%], Central Pacific[4.06%], Bridge [3.63%], Meta [3.58%]