
 Login Sign Up


| |||||
 |  | ||||

| 12Stocks.com Market Intelligence |
Best Financial Stocks
| In a hurry? Financial Stocks Lists: Performance Trends Table, Stock Charts
Sort Financial stocks: Daily, Weekly, Year-to-Date, Market Cap & Trends. Filter Financial stocks list by size:All Financial Large Mid-Range Small & MicroCap |
| 12Stocks.com Financial Stocks Performances & Trends Daily | |||||||||
|
|  The overall Smart Investing & Trading Score is 36 (0-bearish to 100-bullish) which puts Financial sector in short term bearish to neutral trend. The Smart Investing & Trading Score from previous trading session is 21 and hence an improvement of trend.
| ||||||||
Here are the Smart Investing & Trading Scores of the most requested Financial stocks at 12Stocks.com (click stock name for detailed review):
|


| 12Stocks.com: Investing in Financial sector with Stocks | |
|
The following table helps investors and traders sort through current performance and trends (as measured by Smart Investing & Trading Score) of various
stocks in the Financial sector. Quick View: Move mouse or cursor over stock symbol (ticker) to view short-term Technical chart and over stock name to view long term chart. Click on  to add stock symbol to your watchlist and to add stock symbol to your watchlist and  to view watchlist. Click on any ticker or stock name for detailed market intelligence report for that stock. to view watchlist. Click on any ticker or stock name for detailed market intelligence report for that stock. |
12Stocks.com Performance of Stocks in Financial Sector
| Ticker | Stock Name | Watchlist | Category | Recent Price | Trend Score | Change % | YTD Change% |
| FCBC | First Community |   | Regional Banks | 35.00 | 90 | 2.65% | -5.66% |
| NMIH | NMI | | Insurance | 32.49 | 90 | 2.65% | 9.47% |
| EPR | EPR Properties | | REIT - Retail | 42.10 | 90 | 2.53% | -13.11% |
| HLI | Houlihan Lokey | | Brokerage | 130.55 | 90 | 2.52% | 8.87% |
| SRCE | 1st Source | | Regional Banks | 51.70 | 90 | 2.17% | -5.91% |
| HUIZ | Huize Holding | | Insurance | 0.75 | 90 | 13.61% | -16.22% |
| EQBK | Equity Bancshares | | Regional Banks | 34.14 | 90 | 1.94% | 0.71% |
| AGM | Federal Agricultural | | Credit Services | 193.35 | 90 | 1.83% | 1.11% |
| CNO | CNO | | Insurance | 27.17 | 90 | 1.72% | -2.62% |
| BSBR | Banco Santander | | Foreign Banks | 5.74 | 90 | 1.59% | -12.37% |
| MBWM | Mercantile Bank | | Regional Banks | 38.06 | 90 | 1.52% | -5.75% |
| ORI | Old Republic | | Insurance | 30.64 | 90 | 1.19% | 4.22% |
| TWO | Two Harbors | | Mortgage | 12.88 | 90 | 1.18% | -7.54% |
| MLP | Maui Land | | Real Estatet | 20.12 | 90 | 1.00% | 26.62% |
| AMAL | Amalgamated Bank | | Regional Banks | 25.13 | 90 | 1.00% | -6.72% |
| FCF | First Commonwealth | | Regional Banks | 13.59 | 90 | 0.82% | -11.98% |
| BCSF | Bain Capital | | Asset Mgmt | 16.71 | 90 | -0.89% | 10.88% |
| FT | Franklin Universal | | Closed-End Fund - Debt | 6.62 | 90 | -0.15% | -0.45% |
| MCB | Metropolitan Bank | | Regional Banks | 42.63 | 88 | 4.20% | -23.02% |
| JXN | Jackson | | Insurance - Life | 70.59 | 88 | 2.16% | 37.33% |
| WAL | Western Alliance | | Regional Banks | 59.96 | 88 | 2.02% | -8.86% |
| CADE | Cadence Ban | | Regional Banks | 28.73 | 88 | 1.77% | -2.91% |
| BANF | BancFirst | | Regional - Southwest Banks | 92.07 | 88 | 1.69% | -5.40% |
| NXRT | NexPoint Residential | | REIT | 34.27 | 88 | 0.59% | -0.46% |
| BBAR | Banco BBVA | | Foreign Banks | 9.60 | 88 | -0.83% | 76.47% |
| For chart view version of above stock list: Chart View ➞ 0 - 25 , 25 - 50 , 50 - 75 , 75 - 100 , 100 - 125 , 125 - 150 , 150 - 175 , 175 - 200 , 200 - 225 , 225 - 250 , 250 - 275 , 275 - 300 , 300 - 325 , 325 - 350 , 350 - 375 , 375 - 400 , 400 - 425 , 425 - 450 , 450 - 475 , 475 - 500 , 500 - 525 , 525 - 550 , 550 - 575 , 575 - 600 , 600 - 625 , 625 - 650 , 650 - 675 , 675 - 700 , 700 - 725 , 725 - 750 , 750 - 775 , 775 - 800 , 800 - 825 , 825 - 850 , 850 - 875 , 875 - 900 , 900 - 925 , 925 - 950 , 950 - 975 , 975 - 1000 , 1000 - 1025 , 1025 - 1050 , 1050 - 1075 , 1075 - 1100 , 1100 - 1125 , 1125 - 1150 , 1150 - 1175 , 1175 - 1200 , 1200 - 1225 , 1225 - 1250 | ||
 | Click To Change The Sort Order: By Market Cap or Company Size Performance: Year-to-date, Week and Day |  |
|
Get the most comprehensive stock market coverage daily at 12Stocks.com ➞ Best Stocks Today ➞ Best Stocks Weekly ➞ Best Stocks Year-to-Date ➞ Best Stocks Trends ➞  Best Stocks Today 12Stocks.com Best Nasdaq Stocks ➞ Best S&P 500 Stocks ➞ Best Tech Stocks ➞ Best Biotech Stocks ➞ |
| Detailed Overview of Financial Stocks |
| Financial Technical Overview, Leaders & Laggards, Top Financial ETF Funds & Detailed Financial Stocks List, Charts, Trends & More |
| Financial Sector: Technical Analysis, Trends & YTD Performance | |
| Financial sector is composed of stocks
from banks, brokers, insurance, REITs
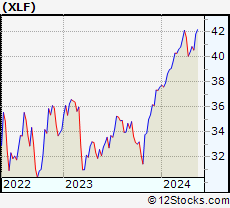
and services subsectors. Financial sector, as represented by XLF, an exchange-traded fund [ETF] that holds basket of Financial stocks (e.g, Bank of America, Goldman Sachs) is up by 7.61% and is currently outperforming the overall market by 1.99% year-to-date. Below is a quick view of Technical charts and trends: |
|
 XLF Weekly Chart |
|
| Long Term Trend: Good | |
| Medium Term Trend: Good | |
 XLF Daily Chart |
|
| Short Term Trend: Not Good | |
| Overall Trend Score: 36 | |
| YTD Performance: 7.61% | |
| **Trend Scores & Views Are Only For Educational Purposes And Not For Investing | |
| 12Stocks.com: Top Performing Financial Sector Stocks | ||||||||||||||||||||||||||||||||||||||||||||||||
 The top performing Financial sector stocks year to date are
Now, more recently, over last week, the top performing Financial sector stocks on the move are


|
||||||||||||||||||||||||||||||||||||||||||||||||
| 12Stocks.com: Investing in Financial Sector using Exchange Traded Funds | |
|
The following table shows list of key exchange traded funds (ETF) that
help investors track Financial Index. For detailed view, check out our ETF Funds section of our website. Quick View: Move mouse or cursor over ETF symbol (ticker) to view short-term Technical chart and over ETF name to view long term chart. Click on ticker or stock name for detailed view. Click on to add stock symbol to your watchlist and to view watchlist. |
12Stocks.com List of ETFs that track Financial Index
| Ticker | ETF Name | Watchlist | Recent Price | Smart Investing & Trading Score | Change % | Week % | Year-to-date % |
| XLF | Financial | | 40.46 | 36 | 0.25 | -0.88 | 7.61% |
| IAI | Broker-Dealers & Secs | | 113.15 | 78 | 0.96 | 0.12 | 4.26% |
| IYF | Financials | | 92.12 | 59 | 0.49 | -0.05 | 7.86% |
| IYG | Financial Services | | 63.89 | 21 | 0.55 | -1.11 | 6.95% |
| KRE | Regional Banking | | 49.02 | 86 | 1.64 | 1.72 | -6.5% |
| IXG | Global Financials | | 84.11 | 66 | 0.61 | -0.1 | 7.04% |
| VFH | Financials | | 98.37 | 21 | 0.62 | -0.57 | 6.62% |
| KBE | Bank | | 45.86 | 100 | 1.30 | 1.17 | -0.35% |
| FAS | Financial Bull 3X | | 97.90 | 25 | 0.62 | -2.71 | 18.45% |
| FAZ | Financial Bear 3X | | 11.18 | 44 | -0.71 | 2.95 | -18.22% |
| UYG | Financials | | 62.28 | 28 | 0.21 | -2.15 | 12.83% |
| IAT | Regional Banks | | 41.90 | 79 | 0.96 | 0.43 | 0.14% |
| KIE | Insurance | | 49.31 | 54 | 0.33 | 1.61 | 9.04% |
| PSCF | SmallCap Financials | | 46.24 | 56 | 0.00 | -0.25 | -5.97% |
| EUFN | Europe Financials | | 22.57 | 71 | 1.55 | 0.51 | 7.71% |
| PGF | Financial Preferred | | 14.64 | 32 | 0.27 | 0.48 | 0.41% |
| 12Stocks.com: Charts, Trends, Fundamental Data and Performances of Financial Stocks | |
|
We now take in-depth look at all Financial stocks including charts, multi-period performances and overall trends (as measured by Smart Investing & Trading Score). One can sort Financial stocks (click link to choose) by Daily, Weekly and by Year-to-Date performances. Also, one can sort by size of the company or by market capitalization. |
| Select Your Default Chart Type: | |||||
| |||||
| Click on stock symbol or name for detailed view. Click on to add stock symbol to your watchlist and to view watchlist. Quick View: Move mouse or cursor over "Daily" to quickly view daily Technical stock chart and over "Weekly" to view weekly Technical stock chart. | |||||

 | FCBC First Community Bankshares, Inc. |
| Sector: Financials | |
| SubSector: Regional - Mid-Atlantic Banks | |
| MarketCap: 393.459 Millions | |
| Recent Price: 35.00 Smart Investing & Trading Score: 90 | |
| Day Percent Change: 2.65% Day Change: 0.91 | |
| Week Change: 4.45% Year-to-date Change: -5.7% | |
| FCBC Links: Profile News Message Board | |
| Charts:- Daily , Weekly | |
| Add FCBC to Watchlist: View: Get Complete FCBC Trend Analysis ➞ | |
 | NMIH NMI Holdings, Inc. |
| Sector: Financials | |
| SubSector: Surety & Title Insurance | |
| MarketCap: 816.018 Millions | |
| Recent Price: 32.49 Smart Investing & Trading Score: 90 | |
| Day Percent Change: 2.65% Day Change: 0.84 | |
| Week Change: 4.44% Year-to-date Change: 9.5% | |
| NMIH Links: Profile News Message Board | |
| Charts:- Daily , Weekly | |
| Add NMIH to Watchlist: View: Get Complete NMIH Trend Analysis ➞ | |
 | EPR EPR Properties |
| Sector: Financials | |
| SubSector: REIT - Retail | |
| MarketCap: 2217.64 Millions | |
| Recent Price: 42.10 Smart Investing & Trading Score: 90 | |
| Day Percent Change: 2.53% Day Change: 1.04 | |
| Week Change: 2.71% Year-to-date Change: -13.1% | |
| EPR Links: Profile News Message Board | |
| Charts:- Daily , Weekly | |
| Add EPR to Watchlist: View: Get Complete EPR Trend Analysis ➞ | |
 | HLI Houlihan Lokey, Inc. |
| Sector: Financials | |
| SubSector: Investment Brokerage - National | |
| MarketCap: 3352.65 Millions | |
| Recent Price: 130.55 Smart Investing & Trading Score: 90 | |
| Day Percent Change: 2.52% Day Change: 3.21 | |
| Week Change: 3.04% Year-to-date Change: 8.9% | |
| HLI Links: Profile News Message Board | |
| Charts:- Daily , Weekly | |
| Add HLI to Watchlist: View: Get Complete HLI Trend Analysis ➞ | |
 | SRCE 1st Source Corporation |
| Sector: Financials | |
| SubSector: Regional - Midwest Banks | |
| MarketCap: 784.77 Millions | |
| Recent Price: 51.70 Smart Investing & Trading Score: 90 | |
| Day Percent Change: 2.17% Day Change: 1.10 | |
| Week Change: 4.83% Year-to-date Change: -5.9% | |
| SRCE Links: Profile News Message Board | |
| Charts:- Daily , Weekly | |
| Add SRCE to Watchlist: View: Get Complete SRCE Trend Analysis ➞ | |
 | HUIZ Huize Holding Limited |
| Sector: Financials | |
| SubSector: Insurance Brokers | |
| MarketCap: 37157 Millions | |
| Recent Price: 0.75 Smart Investing & Trading Score: 90 | |
| Day Percent Change: 13.61% Day Change: 0.09 | |
| Week Change: 22.6% Year-to-date Change: -16.2% | |
| HUIZ Links: Profile News Message Board | |
| Charts:- Daily , Weekly | |
| Add HUIZ to Watchlist: View: Get Complete HUIZ Trend Analysis ➞ | |
 | EQBK Equity Bancshares, Inc. |
| Sector: Financials | |
| SubSector: Regional - Midwest Banks | |
| MarketCap: 272.87 Millions | |
| Recent Price: 34.14 Smart Investing & Trading Score: 90 | |
| Day Percent Change: 1.94% Day Change: 0.65 | |
| Week Change: 2.49% Year-to-date Change: 0.7% | |
| EQBK Links: Profile News Message Board | |
| Charts:- Daily , Weekly | |
| Add EQBK to Watchlist: View: Get Complete EQBK Trend Analysis ➞ | |
 | AGM Federal Agricultural Mortgage Corporation |
| Sector: Financials | |
| SubSector: Credit Services | |
| MarketCap: 542.008 Millions | |
| Recent Price: 193.35 Smart Investing & Trading Score: 90 | |
| Day Percent Change: 1.83% Day Change: 3.47 | |
| Week Change: 1.21% Year-to-date Change: 1.1% | |
| AGM Links: Profile News Message Board | |
| Charts:- Daily , Weekly | |
| Add AGM to Watchlist: View: Get Complete AGM Trend Analysis ➞ | |
 | CNO CNO Financial Group, Inc. |
| Sector: Financials | |
| SubSector: Accident & Health Insurance | |
| MarketCap: 1746.9 Millions | |
| Recent Price: 27.17 Smart Investing & Trading Score: 90 | |
| Day Percent Change: 1.72% Day Change: 0.46 | |
| Week Change: 2.92% Year-to-date Change: -2.6% | |
| CNO Links: Profile News Message Board | |
| Charts:- Daily , Weekly | |
| Add CNO to Watchlist: View: Get Complete CNO Trend Analysis ➞ | |
 | BSBR Banco Santander (Brasil) S.A. |
| Sector: Financials | |
| SubSector: Foreign Regional Banks | |
| MarketCap: 21961.4 Millions | |
| Recent Price: 5.74 Smart Investing & Trading Score: 90 | |
| Day Percent Change: 1.59% Day Change: 0.09 | |
| Week Change: 7.09% Year-to-date Change: -12.4% | |
| BSBR Links: Profile News Message Board | |
| Charts:- Daily , Weekly | |
| Add BSBR to Watchlist: View: Get Complete BSBR Trend Analysis ➞ | |
 | MBWM Mercantile Bank Corporation |
| Sector: Financials | |
| SubSector: Regional - Midwest Banks | |
| MarketCap: 372.77 Millions | |
| Recent Price: 38.06 Smart Investing & Trading Score: 90 | |
| Day Percent Change: 1.52% Day Change: 0.57 | |
| Week Change: 5.17% Year-to-date Change: -5.8% | |
| MBWM Links: Profile News Message Board | |
| Charts:- Daily , Weekly | |
| Add MBWM to Watchlist: View: Get Complete MBWM Trend Analysis ➞ | |
 | ORI Old Republic International Corporation |
| Sector: Financials | |
| SubSector: Property & Casualty Insurance | |
| MarketCap: 4420.92 Millions | |
| Recent Price: 30.64 Smart Investing & Trading Score: 90 | |
| Day Percent Change: 1.19% Day Change: 0.36 | |
| Week Change: 1.69% Year-to-date Change: 4.2% | |
| ORI Links: Profile News Message Board | |
| Charts:- Daily , Weekly | |
| Add ORI to Watchlist: View: Get Complete ORI Trend Analysis ➞ | |
 | TWO Two Harbors Investment Corp. |
| Sector: Financials | |
| SubSector: Mortgage Investment | |
| MarketCap: 1979.59 Millions | |
| Recent Price: 12.88 Smart Investing & Trading Score: 90 | |
| Day Percent Change: 1.18% Day Change: 0.15 | |
| Week Change: 2.79% Year-to-date Change: -7.5% | |
| TWO Links: Profile News Message Board | |
| Charts:- Daily , Weekly | |
| Add TWO to Watchlist: View: Get Complete TWO Trend Analysis ➞ | |
 | MLP Maui Land & Pineapple Company, Inc. |
| Sector: Financials | |
| SubSector: Real Estate Development | |
| MarketCap: 186.619 Millions | |
| Recent Price: 20.12 Smart Investing & Trading Score: 90 | |
| Day Percent Change: 1.00% Day Change: 0.20 | |
| Week Change: 1.56% Year-to-date Change: 26.6% | |
| MLP Links: Profile News Message Board | |
| Charts:- Daily , Weekly | |
| Add MLP to Watchlist: View: Get Complete MLP Trend Analysis ➞ | |
 | AMAL Amalgamated Bank |
| Sector: Financials | |
| SubSector: Regional - Northeast Banks | |
| MarketCap: 321.899 Millions | |
| Recent Price: 25.13 Smart Investing & Trading Score: 90 | |
| Day Percent Change: 1.00% Day Change: 0.25 | |
| Week Change: 2.15% Year-to-date Change: -6.7% | |
| AMAL Links: Profile News Message Board | |
| Charts:- Daily , Weekly | |
| Add AMAL to Watchlist: View: Get Complete AMAL Trend Analysis ➞ | |
 | FCF First Commonwealth Financial Corporation |
| Sector: Financials | |
| SubSector: Regional - Northeast Banks | |
| MarketCap: 900.299 Millions | |
| Recent Price: 13.59 Smart Investing & Trading Score: 90 | |
| Day Percent Change: 0.82% Day Change: 0.11 | |
| Week Change: 0.3% Year-to-date Change: -12.0% | |
| FCF Links: Profile News Message Board | |
| Charts:- Daily , Weekly | |
| Add FCF to Watchlist: View: Get Complete FCF Trend Analysis ➞ | |
 | BCSF Bain Capital Specialty Finance, Inc. |
| Sector: Financials | |
| SubSector: Asset Management | |
| MarketCap: 562.203 Millions | |
| Recent Price: 16.71 Smart Investing & Trading Score: 90 | |
| Day Percent Change: -0.89% Day Change: -0.15 | |
| Week Change: 1.46% Year-to-date Change: 10.9% | |
| BCSF Links: Profile News Message Board | |
| Charts:- Daily , Weekly | |
| Add BCSF to Watchlist: View: Get Complete BCSF Trend Analysis ➞ | |
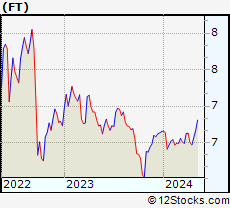 | FT Franklin Universal Trust |
| Sector: Financials | |
| SubSector: Closed-End Fund - Debt | |
| MarketCap: 135.907 Millions | |
| Recent Price: 6.62 Smart Investing & Trading Score: 90 | |
| Day Percent Change: -0.15% Day Change: -0.01 | |
| Week Change: 0.76% Year-to-date Change: -0.5% | |
| FT Links: Profile News Message Board | |
| Charts:- Daily , Weekly | |
| Add FT to Watchlist: View: Get Complete FT Trend Analysis ➞ | |
 | MCB Metropolitan Bank Holding Corp. |
| Sector: Financials | |
| SubSector: Regional - Northeast Banks | |
| MarketCap: 212.999 Millions | |
| Recent Price: 42.63 Smart Investing & Trading Score: 88 | |
| Day Percent Change: 4.20% Day Change: 1.72 | |
| Week Change: 1.19% Year-to-date Change: -23.0% | |
| MCB Links: Profile News Message Board | |
| Charts:- Daily , Weekly | |
| Add MCB to Watchlist: View: Get Complete MCB Trend Analysis ➞ | |
 | JXN Jackson Financial Inc. |
| Sector: Financials | |
| SubSector: Insurance - Life | |
| MarketCap: 2460 Millions | |
| Recent Price: 70.59 Smart Investing & Trading Score: 88 | |
| Day Percent Change: 2.16% Day Change: 1.49 | |
| Week Change: 1.48% Year-to-date Change: 37.3% | |
| JXN Links: Profile News Message Board | |
| Charts:- Daily , Weekly | |
| Add JXN to Watchlist: View: Get Complete JXN Trend Analysis ➞ | |
 | WAL Western Alliance Bancorporation |
| Sector: Financials | |
| SubSector: Regional - Pacific Banks | |
| MarketCap: 2980.09 Millions | |
| Recent Price: 59.96 Smart Investing & Trading Score: 88 | |
| Day Percent Change: 2.02% Day Change: 1.19 | |
| Week Change: 2.18% Year-to-date Change: -8.9% | |
| WAL Links: Profile News Message Board | |
| Charts:- Daily , Weekly | |
| Add WAL to Watchlist: View: Get Complete WAL Trend Analysis ➞ | |
 | CADE Cadence Bancorporation |
| Sector: Financials | |
| SubSector: Regional - Southeast Banks | |
| MarketCap: 756.335 Millions | |
| Recent Price: 28.73 Smart Investing & Trading Score: 88 | |
| Day Percent Change: 1.77% Day Change: 0.50 | |
| Week Change: -1% Year-to-date Change: -2.9% | |
| CADE Links: Profile News Message Board | |
| Charts:- Daily , Weekly | |
| Add CADE to Watchlist: View: Get Complete CADE Trend Analysis ➞ | |
 | BANF BancFirst Corporation |
| Sector: Financials | |
| SubSector: Regional - Southwest Banks | |
| MarketCap: 1068.65 Millions | |
| Recent Price: 92.07 Smart Investing & Trading Score: 88 | |
| Day Percent Change: 1.69% Day Change: 1.53 | |
| Week Change: 3.36% Year-to-date Change: -5.4% | |
| BANF Links: Profile News Message Board | |
| Charts:- Daily , Weekly | |
| Add BANF to Watchlist: View: Get Complete BANF Trend Analysis ➞ | |
 | NXRT NexPoint Residential Trust, Inc. |
| Sector: Financials | |
| SubSector: REIT - Residential | |
| MarketCap: 839.161 Millions | |
| Recent Price: 34.27 Smart Investing & Trading Score: 88 | |
| Day Percent Change: 0.59% Day Change: 0.20 | |
| Week Change: 3.01% Year-to-date Change: -0.5% | |
| NXRT Links: Profile News Message Board | |
| Charts:- Daily , Weekly | |
| Add NXRT to Watchlist: View: Get Complete NXRT Trend Analysis ➞ | |
 | BBAR Banco BBVA Argentina S.A. |
| Sector: Financials | |
| SubSector: Foreign Regional Banks | |
| MarketCap: 895.479 Millions | |
| Recent Price: 9.60 Smart Investing & Trading Score: 88 | |
| Day Percent Change: -0.83% Day Change: -0.08 | |
| Week Change: 3.78% Year-to-date Change: 76.5% | |
| BBAR Links: Profile News Message Board | |
| Charts:- Daily , Weekly | |
| Add BBAR to Watchlist: View: Get Complete BBAR Trend Analysis ➞ | |
| For tabular summary view of above stock list: Summary View ➞ 0 - 25 , 25 - 50 , 50 - 75 , 75 - 100 , 100 - 125 , 125 - 150 , 150 - 175 , 175 - 200 , 200 - 225 , 225 - 250 , 250 - 275 , 275 - 300 , 300 - 325 , 325 - 350 , 350 - 375 , 375 - 400 , 400 - 425 , 425 - 450 , 450 - 475 , 475 - 500 , 500 - 525 , 525 - 550 , 550 - 575 , 575 - 600 , 600 - 625 , 625 - 650 , 650 - 675 , 675 - 700 , 700 - 725 , 725 - 750 , 750 - 775 , 775 - 800 , 800 - 825 , 825 - 850 , 850 - 875 , 875 - 900 , 900 - 925 , 925 - 950 , 950 - 975 , 975 - 1000 , 1000 - 1025 , 1025 - 1050 , 1050 - 1075 , 1075 - 1100 , 1100 - 1125 , 1125 - 1150 , 1150 - 1175 , 1175 - 1200 , 1200 - 1225 , 1225 - 1250 | ||
| Click To Change The Sort Order: By Market Cap or Company Size Performance: Year-to-date, Week and Day | |
| Select Chart Type: | ||
|
Best Stocks Today 12Stocks.com |
© 2024 12Stocks.com Terms & Conditions Privacy Contact Us
All Information Provided Only For Education And Not To Be Used For Investing or Trading. See Terms & Conditions


One More Thing ... Get Best Stocks Delivered Daily!
Never Ever Miss A Move With Our Top Ten Stocks Lists
Find Best Stocks In Any Market - Bull or Bear Market
Take A Peek At Our Top Ten Stocks Lists: Daily, Weekly, Year-to-Date & Top Trends
Find Best Stocks In Any Market - Bull or Bear Market
Take A Peek At Our Top Ten Stocks Lists: Daily, Weekly, Year-to-Date & Top Trends
Financial Stocks With Best Up Trends [0-bearish to 100-bullish]: KE [100], Regional Management[100], Noah [100], ING Groep[100], Markel [100], Genworth [100], Ventas [100], EverQuote [100], Farmers & Merchants Bancorp[100], AXIS Capital[100], KraneShares Trust[100]
Best Financial Stocks Year-to-Date:
Root [443.51%], Hippo [99.34%], Gladstone Capital[98.36%], Banco Macro[95.51%], Grupo Financiero[84.42%], Banco BBVA[76.47%], EverQuote [75.9%], Yiren Digital[74.68%], LendingTree [62.99%], Grupo Supervielle[60.34%], B. Riley[60.03%] Best Financial Stocks This Week:
LendingTree [30.4%], Office Properties[28.36%], Huize Holding[22.6%], Heartland [21%], Industrial Logistics[17.49%], Douglas Elliman[16.81%], LendingClub [15.19%], KE [13.55%], New York[13.47%], SelectQuote [11.8%], Skyward Specialty[11.44%] Best Financial Stocks Daily:
Office Properties[29.00%], Huize Holding[13.61%], KE [12.64%], SelectQuote [11.80%], eXp World[11.03%], Coinbase Global[10.36%], Regional Management[8.03%], Noah [7.83%], Cipher Mining[7.74%], X [7.14%], 360 Finance[7.05%]