
 Login Sign Up


| |||||
 |  | ||||

| 12Stocks.com Market Intelligence |
Best Financial Stocks
| In a hurry? Financial Stocks Lists: Performance Trends Table, Stock Charts
Sort Financial stocks: Daily, Weekly, Year-to-Date, Market Cap & Trends. Filter Financial stocks list by size:All Financial Large Mid-Range Small & MicroCap |
| 12Stocks.com Financial Stocks Performances & Trends Daily | |||||||||
|
|  The overall Smart Investing & Trading Score is 53 (0-bearish to 100-bullish) which puts Financial sector in short term neutral trend. The Smart Investing & Trading Score from previous trading session is 36 and hence an improvement of trend.
| ||||||||
Here are the Smart Investing & Trading Scores of the most requested Financial stocks at 12Stocks.com (click stock name for detailed review):
|


| 12Stocks.com: Investing in Financial sector with Stocks | |
|
The following table helps investors and traders sort through current performance and trends (as measured by Smart Investing & Trading Score) of various
stocks in the Financial sector. Quick View: Move mouse or cursor over stock symbol (ticker) to view short-term Technical chart and over stock name to view long term chart. Click on  to add stock symbol to your watchlist and to add stock symbol to your watchlist and  to view watchlist. Click on any ticker or stock name for detailed market intelligence report for that stock. to view watchlist. Click on any ticker or stock name for detailed market intelligence report for that stock. |
12Stocks.com Performance of Stocks in Financial Sector
| Ticker | Stock Name | Watchlist | Category | Recent Price | Trend Score | Change % | YTD Change% |
| EHI | Western Asset |   | Closed-End Fund - Debt | 6.93 | 64 | 0.27% | -4.16% |
| BME | BlackRock Health | | Closed-End Fund - Equity | 39.59 | 64 | 0.25% | -2.15% |
| EVG | Eaton Vance | | Closed-End Fund - Debt | 10.55 | 64 | 0.19% | 1.64% |
| CNDA | Concord Acquisition | | SPAC | 10.59 | 64 | 0.19% | 2.02% |
| CBNK | Capital Bancorp | | S&L | 19.99 | 64 | 0.05% | -17.40% |
| FTF | Franklin | | Asset Mgmt | 6.29 | 64 | 0.00% | 1.13% |
| MBI | MBIA | | Insurance | 6.38 | 64 | -1.69% | 4.25% |
| ESGR | Enstar | | Insurance | 298.73 | 64 | -0.26% | 1.49% |
| FIF | First Trust | | Closed-End Fund - Equity | 18.10 | 64 | 0.06% | 9.96% |
| SCM | Stellus Capital | | Asset Mgmt | 14.00 | 64 | -0.99% | 8.95% |
| PGR | Progressive | | Insurance | 208.72 | 64 | -0.15% | 31.04% |
| BMO | Bank of Montreal | | Banks | 91.23 | 63 | 1.49% | -7.79% |
| GLAD | Gladstone Capital | | Closed-End Fund - Debt | 21.43 | 63 | 0.89% | 100.28% |
| OMF | OneMain | | Credit Services | 51.20 | 63 | 0.77% | 4.07% |
| HBCP | Home Bancorp | | S&L | 36.95 | 63 | 0.57% | -12.04% |
| MSOS | AdvisorShares Pure | | Exchange Traded Fund | 9.67 | 63 | 0.52% | 38.14% |
| COIN | Coinbase Global | | Financial Data & Stock Exchanges | 223.25 | 63 | 0.38% | 29.20% |
| BCSA | Blockchain Coinvestors | | SPAC | 11.20 | 63 | 0.09% | 3.04% |
| FRT | Federal Realty | | REIT - Retail | 102.01 | 63 | -2.76% | -1.01% |
| PYPL | PayPal | | Credit Services | 65.70 | 63 | -1.91% | 6.99% |
| MBINM | Merchants Bancorp | | Banks - Regional | 25.92 | 63 | -1.03% | 4.98% |
| ALTL | Pacer Lunt | | Exchange Traded Fund | 34.15 | 63 | 0.47% | 1.82% |
| THY | Agility Shares | | Exchange Traded Fund | 22.27 | 63 | 0.42% | -1.40% |
| OXLCO | Oxford Lane | | Asset Mgmt | 22.30 | 63 | 0.22% | 1.18% |
| ALSA | Alpha Star | | SPAC | 11.38 | 63 | 0.09% | 1.70% |
| For chart view version of above stock list: Chart View ➞ 0 - 25 , 25 - 50 , 50 - 75 , 75 - 100 , 100 - 125 , 125 - 150 , 150 - 175 , 175 - 200 , 200 - 225 , 225 - 250 , 250 - 275 , 275 - 300 , 300 - 325 , 325 - 350 , 350 - 375 , 375 - 400 , 400 - 425 , 425 - 450 , 450 - 475 , 475 - 500 , 500 - 525 , 525 - 550 , 550 - 575 , 575 - 600 , 600 - 625 , 625 - 650 , 650 - 675 , 675 - 700 , 700 - 725 , 725 - 750 , 750 - 775 , 775 - 800 , 800 - 825 , 825 - 850 , 850 - 875 , 875 - 900 , 900 - 925 , 925 - 950 , 950 - 975 , 975 - 1000 , 1000 - 1025 , 1025 - 1050 , 1050 - 1075 , 1075 - 1100 , 1100 - 1125 , 1125 - 1150 , 1150 - 1175 , 1175 - 1200 , 1200 - 1225 , 1225 - 1250 | ||
 | Click To Change The Sort Order: By Market Cap or Company Size Performance: Year-to-date, Week and Day |  |
|
Get the most comprehensive stock market coverage daily at 12Stocks.com ➞ Best Stocks Today ➞ Best Stocks Weekly ➞ Best Stocks Year-to-Date ➞ Best Stocks Trends ➞  Best Stocks Today 12Stocks.com Best Nasdaq Stocks ➞ Best S&P 500 Stocks ➞ Best Tech Stocks ➞ Best Biotech Stocks ➞ |
| Detailed Overview of Financial Stocks |
| Financial Technical Overview, Leaders & Laggards, Top Financial ETF Funds & Detailed Financial Stocks List, Charts, Trends & More |
| Financial Sector: Technical Analysis, Trends & YTD Performance | |
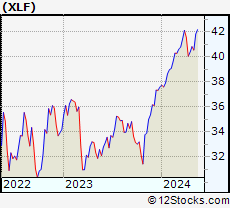
| Financial sector is composed of stocks
from banks, brokers, insurance, REITs
and services subsectors. Financial sector, as represented by XLF, an exchange-traded fund [ETF] that holds basket of Financial stocks (e.g, Bank of America, Goldman Sachs) is up by 7.85% and is currently outperforming the overall market by 0.97% year-to-date. Below is a quick view of Technical charts and trends: |
|
 XLF Weekly Chart |
|
| Long Term Trend: Good | |
| Medium Term Trend: Good | |
 XLF Daily Chart |
|
| Short Term Trend: Very Good | |
| Overall Trend Score: 53 | |
| YTD Performance: 7.85% | |
| **Trend Scores & Views Are Only For Educational Purposes And Not For Investing | |
| 12Stocks.com: Top Performing Financial Sector Stocks | ||||||||||||||||||||||||||||||||||||||||||||||||
 The top performing Financial sector stocks year to date are
Now, more recently, over last week, the top performing Financial sector stocks on the move are


|
||||||||||||||||||||||||||||||||||||||||||||||||
| 12Stocks.com: Investing in Financial Sector using Exchange Traded Funds | |
|
The following table shows list of key exchange traded funds (ETF) that
help investors track Financial Index. For detailed view, check out our ETF Funds section of our website. Quick View: Move mouse or cursor over ETF symbol (ticker) to view short-term Technical chart and over ETF name to view long term chart. Click on ticker or stock name for detailed view. Click on to add stock symbol to your watchlist and to view watchlist. |
12Stocks.com List of ETFs that track Financial Index
| Ticker | ETF Name | Watchlist | Recent Price | Smart Investing & Trading Score | Change % | Week % | Year-to-date % |
| XLF | Financial | | 40.55 | 53 | 0.22 | -0.66 | 7.85% |
| IAI | Broker-Dealers & Secs | | 114.27 | 95 | 0.98 | 1.11 | 5.29% |
| IYF | Financials | | 92.47 | 78 | 0.38 | 0.33 | 8.27% |
| IYG | Financial Services | | 64.09 | 60 | 0.31 | -0.8 | 7.29% |
| KRE | Regional Banking | | 49.65 | 100 | 1.29 | 3.03 | -5.3% |
| IXG | Global Financials | | 84.84 | 85 | 0.87 | 0.77 | 7.97% |
| VFH | Financials | | 98.70 | 73 | 0.34 | -0.23 | 6.98% |
| KBE | Bank | | 46.39 | 100 | 1.16 | 2.34 | 0.8% |
| FAS | Financial Bull 3X | | 98.83 | 60 | 0.95 | -1.79 | 19.58% |
| FAZ | Financial Bear 3X | | 11.08 | 17 | -0.89 | 2.03 | -18.95% |
| UYG | Financials | | 62.79 | 60 | 0.56 | -1.35 | 13.75% |
| IAT | Regional Banks | | 42.29 | 100 | 0.93 | 1.37 | 1.08% |
| KIE | Insurance | | 49.48 | 60 | 0.39 | 1.96 | 9.42% |
| PSCF | SmallCap Financials | | 47.28 | 100 | 0.77 | 1.98 | -3.86% |
| EUFN | Europe Financials | | 22.65 | 85 | 0.24 | 0.82 | 8.04% |
| PGF | Financial Preferred | | 14.85 | 64 | 1.43 | 1.92 | 1.85% |
| 12Stocks.com: Charts, Trends, Fundamental Data and Performances of Financial Stocks | |
|
We now take in-depth look at all Financial stocks including charts, multi-period performances and overall trends (as measured by Smart Investing & Trading Score). One can sort Financial stocks (click link to choose) by Daily, Weekly and by Year-to-Date performances. Also, one can sort by size of the company or by market capitalization. |
| Select Your Default Chart Type: | |||||
| |||||
| Click on stock symbol or name for detailed view. Click on to add stock symbol to your watchlist and to view watchlist. Quick View: Move mouse or cursor over "Daily" to quickly view daily Technical stock chart and over "Weekly" to view weekly Technical stock chart. | |||||

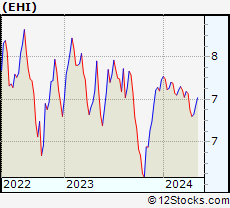 | EHI Western Asset Global High Income Fund Inc. |
| Sector: Financials | |
| SubSector: Closed-End Fund - Debt | |
| MarketCap: 299.407 Millions | |
| Recent Price: 6.93 Smart Investing & Trading Score: 64 | |
| Day Percent Change: 0.27% Day Change: 0.02 | |
| Week Change: 1.52% Year-to-date Change: -4.2% | |
| EHI Links: Profile News Message Board | |
| Charts:- Daily , Weekly | |
| Add EHI to Watchlist: View: Get Complete EHI Trend Analysis ➞ | |
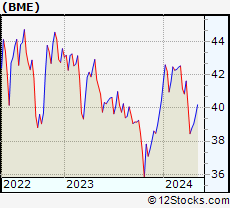 | BME BlackRock Health Sciences Trust |
| Sector: Financials | |
| SubSector: Closed-End Fund - Equity | |
| MarketCap: 325.547 Millions | |
| Recent Price: 39.59 Smart Investing & Trading Score: 64 | |
| Day Percent Change: 0.25% Day Change: 0.10 | |
| Week Change: 1.36% Year-to-date Change: -2.2% | |
| BME Links: Profile News Message Board | |
| Charts:- Daily , Weekly | |
| Add BME to Watchlist: View: Get Complete BME Trend Analysis ➞ | |
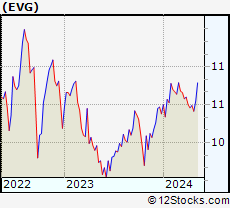 | EVG Eaton Vance Short Duration Diversified Income Fund |
| Sector: Financials | |
| SubSector: Closed-End Fund - Debt | |
| MarketCap: 183.207 Millions | |
| Recent Price: 10.55 Smart Investing & Trading Score: 64 | |
| Day Percent Change: 0.19% Day Change: 0.02 | |
| Week Change: 1.3% Year-to-date Change: 1.6% | |
| EVG Links: Profile News Message Board | |
| Charts:- Daily , Weekly | |
| Add EVG to Watchlist: View: Get Complete EVG Trend Analysis ➞ | |
 | CNDA Concord Acquisition Corp II |
| Sector: Financials | |
| SubSector: SPAC | |
| MarketCap: 359 Millions | |
| Recent Price: 10.59 Smart Investing & Trading Score: 64 | |
| Day Percent Change: 0.19% Day Change: 0.02 | |
| Week Change: 0.28% Year-to-date Change: 2.0% | |
| CNDA Links: Profile News Message Board | |
| Charts:- Daily , Weekly | |
| Add CNDA to Watchlist: View: Get Complete CNDA Trend Analysis ➞ | |
 | CBNK Capital Bancorp, Inc. |
| Sector: Financials | |
| SubSector: Savings & Loans | |
| MarketCap: 174.93 Millions | |
| Recent Price: 19.99 Smart Investing & Trading Score: 64 | |
| Day Percent Change: 0.05% Day Change: 0.01 | |
| Week Change: 2.09% Year-to-date Change: -17.4% | |
| CBNK Links: Profile News Message Board | |
| Charts:- Daily , Weekly | |
| Add CBNK to Watchlist: View: Get Complete CBNK Trend Analysis ➞ | |
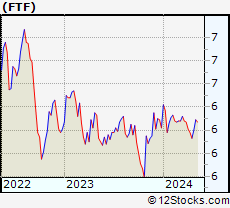 | FTF Franklin Limited Duration Income Trust |
| Sector: Financials | |
| SubSector: Asset Management | |
| MarketCap: 210.603 Millions | |
| Recent Price: 6.29 Smart Investing & Trading Score: 64 | |
| Day Percent Change: 0.00% Day Change: 0.00 | |
| Week Change: 1.45% Year-to-date Change: 1.1% | |
| FTF Links: Profile News Message Board | |
| Charts:- Daily , Weekly | |
| Add FTF to Watchlist: View: Get Complete FTF Trend Analysis ➞ | |
 | MBI MBIA Inc. |
| Sector: Financials | |
| SubSector: Property & Casualty Insurance | |
| MarketCap: 539.012 Millions | |
| Recent Price: 6.38 Smart Investing & Trading Score: 64 | |
| Day Percent Change: -1.69% Day Change: -0.11 | |
| Week Change: -6.45% Year-to-date Change: 4.3% | |
| MBI Links: Profile News Message Board | |
| Charts:- Daily , Weekly | |
| Add MBI to Watchlist: View: Get Complete MBI Trend Analysis ➞ | |
 | ESGR Enstar Group Limited |
| Sector: Financials | |
| SubSector: Property & Casualty Insurance | |
| MarketCap: 2886.02 Millions | |
| Recent Price: 298.73 Smart Investing & Trading Score: 64 | |
| Day Percent Change: -0.26% Day Change: -0.78 | |
| Week Change: 3.62% Year-to-date Change: 1.5% | |
| ESGR Links: Profile News Message Board | |
| Charts:- Daily , Weekly | |
| Add ESGR to Watchlist: View: Get Complete ESGR Trend Analysis ➞ | |
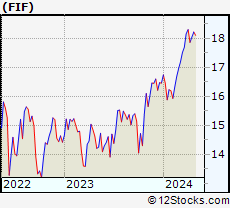 | FIF First Trust Energy Infrastructure Fund |
| Sector: Financials | |
| SubSector: Closed-End Fund - Equity | |
| MarketCap: 135.347 Millions | |
| Recent Price: 18.10 Smart Investing & Trading Score: 64 | |
| Day Percent Change: 0.06% Day Change: 0.01 | |
| Week Change: -0.66% Year-to-date Change: 10.0% | |
| FIF Links: Profile News Message Board | |
| Charts:- Daily , Weekly | |
| Add FIF to Watchlist: View: Get Complete FIF Trend Analysis ➞ | |
 | SCM Stellus Capital Investment Corporation |
| Sector: Financials | |
| SubSector: Asset Management | |
| MarketCap: 127.403 Millions | |
| Recent Price: 14.00 Smart Investing & Trading Score: 64 | |
| Day Percent Change: -0.99% Day Change: -0.14 | |
| Week Change: -0.99% Year-to-date Change: 9.0% | |
| SCM Links: Profile News Message Board | |
| Charts:- Daily , Weekly | |
| Add SCM to Watchlist: View: Get Complete SCM Trend Analysis ➞ | |
 | PGR The Progressive Corporation |
| Sector: Financials | |
| SubSector: Property & Casualty Insurance | |
| MarketCap: 43112 Millions | |
| Recent Price: 208.72 Smart Investing & Trading Score: 64 | |
| Day Percent Change: -0.15% Day Change: -0.31 | |
| Week Change: 0.33% Year-to-date Change: 31.0% | |
| PGR Links: Profile News Message Board | |
| Charts:- Daily , Weekly | |
| Add PGR to Watchlist: View: Get Complete PGR Trend Analysis ➞ | |
 | BMO Bank of Montreal |
| Sector: Financials | |
| SubSector: Money Center Banks | |
| MarketCap: 32830.2 Millions | |
| Recent Price: 91.23 Smart Investing & Trading Score: 63 | |
| Day Percent Change: 1.49% Day Change: 1.34 | |
| Week Change: 0.35% Year-to-date Change: -7.8% | |
| BMO Links: Profile News Message Board | |
| Charts:- Daily , Weekly | |
| Add BMO to Watchlist: View: Get Complete BMO Trend Analysis ➞ | |
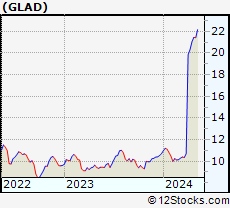 | GLAD Gladstone Capital Corporation |
| Sector: Financials | |
| SubSector: Closed-End Fund - Debt | |
| MarketCap: 174.807 Millions | |
| Recent Price: 21.43 Smart Investing & Trading Score: 63 | |
| Day Percent Change: 0.89% Day Change: 0.19 | |
| Week Change: -0.09% Year-to-date Change: 100.3% | |
| GLAD Links: Profile News Message Board | |
| Charts:- Daily , Weekly | |
| Add GLAD to Watchlist: View: Get Complete GLAD Trend Analysis ➞ | |
 | OMF OneMain Holdings, Inc. |
| Sector: Financials | |
| SubSector: Credit Services | |
| MarketCap: 2753.38 Millions | |
| Recent Price: 51.20 Smart Investing & Trading Score: 63 | |
| Day Percent Change: 0.77% Day Change: 0.39 | |
| Week Change: 0.61% Year-to-date Change: 4.1% | |
| OMF Links: Profile News Message Board | |
| Charts:- Daily , Weekly | |
| Add OMF to Watchlist: View: Get Complete OMF Trend Analysis ➞ | |
 | HBCP Home Bancorp, Inc. |
| Sector: Financials | |
| SubSector: Savings & Loans | |
| MarketCap: 206.83 Millions | |
| Recent Price: 36.95 Smart Investing & Trading Score: 63 | |
| Day Percent Change: 0.57% Day Change: 0.21 | |
| Week Change: 3.85% Year-to-date Change: -12.0% | |
| HBCP Links: Profile News Message Board | |
| Charts:- Daily , Weekly | |
| Add HBCP to Watchlist: View: Get Complete HBCP Trend Analysis ➞ | |
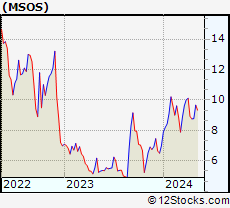 | MSOS AdvisorShares Pure US Cannabis ETF |
| Sector: Financials | |
| SubSector: Exchange Traded Fund | |
| MarketCap: 60157 Millions | |
| Recent Price: 9.67 Smart Investing & Trading Score: 63 | |
| Day Percent Change: 0.52% Day Change: 0.05 | |
| Week Change: 10.14% Year-to-date Change: 38.1% | |
| MSOS Links: Profile News Message Board | |
| Charts:- Daily , Weekly | |
| Add MSOS to Watchlist: View: Get Complete MSOS Trend Analysis ➞ | |
 | COIN Coinbase Global, Inc. |
| Sector: Financials | |
| SubSector: Financial Data & Stock Exchanges | |
| MarketCap: 16390 Millions | |
| Recent Price: 223.25 Smart Investing & Trading Score: 63 | |
| Day Percent Change: 0.38% Day Change: 0.84 | |
| Week Change: -5.58% Year-to-date Change: 29.2% | |
| COIN Links: Profile News Message Board | |
| Charts:- Daily , Weekly | |
| Add COIN to Watchlist: View: Get Complete COIN Trend Analysis ➞ | |
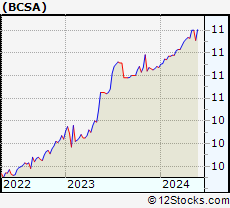 | BCSA Blockchain Coinvestors Acquisition Corp. I |
| Sector: Financials | |
| SubSector: SPAC | |
| MarketCap: 159 Millions | |
| Recent Price: 11.20 Smart Investing & Trading Score: 63 | |
| Day Percent Change: 0.09% Day Change: 0.01 | |
| Week Change: 0% Year-to-date Change: 3.0% | |
| BCSA Links: Profile News Message Board | |
| Charts:- Daily , Weekly | |
| Add BCSA to Watchlist: View: Get Complete BCSA Trend Analysis ➞ | |
 | FRT Federal Realty Investment Trust |
| Sector: Financials | |
| SubSector: REIT - Retail | |
| MarketCap: 5878.64 Millions | |
| Recent Price: 102.01 Smart Investing & Trading Score: 63 | |
| Day Percent Change: -2.76% Day Change: -2.90 | |
| Week Change: -0.18% Year-to-date Change: -1.0% | |
| FRT Links: Profile News Message Board | |
| Charts:- Daily , Weekly | |
| Add FRT to Watchlist: View: Get Complete FRT Trend Analysis ➞ | |
 | PYPL PayPal Holdings, Inc. |
| Sector: Financials | |
| SubSector: Credit Services | |
| MarketCap: 108949 Millions | |
| Recent Price: 65.70 Smart Investing & Trading Score: 63 | |
| Day Percent Change: -1.91% Day Change: -1.28 | |
| Week Change: -0.39% Year-to-date Change: 7.0% | |
| PYPL Links: Profile News Message Board | |
| Charts:- Daily , Weekly | |
| Add PYPL to Watchlist: View: Get Complete PYPL Trend Analysis ➞ | |
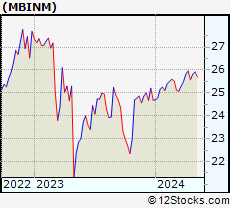 | MBINM Merchants Bancorp |
| Sector: Financials | |
| SubSector: Banks - Regional | |
| MarketCap: 1110 Millions | |
| Recent Price: 25.92 Smart Investing & Trading Score: 63 | |
| Day Percent Change: -1.03% Day Change: -0.27 | |
| Week Change: 0.39% Year-to-date Change: 5.0% | |
| MBINM Links: Profile News Message Board | |
| Charts:- Daily , Weekly | |
| Add MBINM to Watchlist: View: Get Complete MBINM Trend Analysis ➞ | |
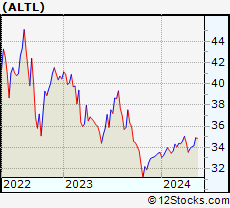 | ALTL Pacer Lunt Large Cap Alternator ETF |
| Sector: Financials | |
| SubSector: Exchange Traded Fund | |
| MarketCap: 60157 Millions | |
| Recent Price: 34.15 Smart Investing & Trading Score: 63 | |
| Day Percent Change: 0.47% Day Change: 0.16 | |
| Week Change: 0.21% Year-to-date Change: 1.8% | |
| ALTL Links: Profile News Message Board | |
| Charts:- Daily , Weekly | |
| Add ALTL to Watchlist: View: Get Complete ALTL Trend Analysis ➞ | |
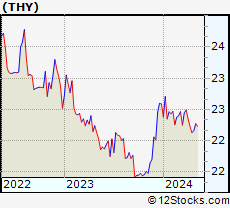 | THY Agility Shares Dynamic Tactical Income ETF |
| Sector: Financials | |
| SubSector: Exchange Traded Fund | |
| MarketCap: 60157 Millions | |
| Recent Price: 22.27 Smart Investing & Trading Score: 63 | |
| Day Percent Change: 0.42% Day Change: 0.09 | |
| Week Change: 0.51% Year-to-date Change: -1.4% | |
| THY Links: Profile News Message Board | |
| Charts:- Daily , Weekly | |
| Add THY to Watchlist: View: Get Complete THY Trend Analysis ➞ | |
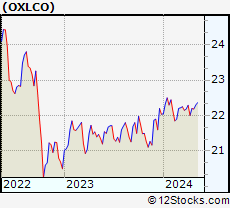 | OXLCO Oxford Lane Capital Corp. |
| Sector: Financials | |
| SubSector: Asset Management | |
| MarketCap: 718.003 Millions | |
| Recent Price: 22.30 Smart Investing & Trading Score: 63 | |
| Day Percent Change: 0.22% Day Change: 0.05 | |
| Week Change: 0.51% Year-to-date Change: 1.2% | |
| OXLCO Links: Profile News Message Board | |
| Charts:- Daily , Weekly | |
| Add OXLCO to Watchlist: View: Get Complete OXLCO Trend Analysis ➞ | |
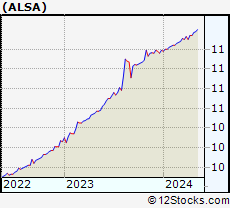 | ALSA Alpha Star Acquisition Corporation |
| Sector: Financials | |
| SubSector: SPAC | |
| MarketCap: 158 Millions | |
| Recent Price: 11.38 Smart Investing & Trading Score: 63 | |
| Day Percent Change: 0.09% Day Change: 0.01 | |
| Week Change: 0.09% Year-to-date Change: 1.7% | |
| ALSA Links: Profile News Message Board | |
| Charts:- Daily , Weekly | |
| Add ALSA to Watchlist: View: Get Complete ALSA Trend Analysis ➞ | |
| For tabular summary view of above stock list: Summary View ➞ 0 - 25 , 25 - 50 , 50 - 75 , 75 - 100 , 100 - 125 , 125 - 150 , 150 - 175 , 175 - 200 , 200 - 225 , 225 - 250 , 250 - 275 , 275 - 300 , 300 - 325 , 325 - 350 , 350 - 375 , 375 - 400 , 400 - 425 , 425 - 450 , 450 - 475 , 475 - 500 , 500 - 525 , 525 - 550 , 550 - 575 , 575 - 600 , 600 - 625 , 625 - 650 , 650 - 675 , 675 - 700 , 700 - 725 , 725 - 750 , 750 - 775 , 775 - 800 , 800 - 825 , 825 - 850 , 850 - 875 , 875 - 900 , 900 - 925 , 925 - 950 , 950 - 975 , 975 - 1000 , 1000 - 1025 , 1025 - 1050 , 1050 - 1075 , 1075 - 1100 , 1100 - 1125 , 1125 - 1150 , 1150 - 1175 , 1175 - 1200 , 1200 - 1225 , 1225 - 1250 | ||
| Click To Change The Sort Order: By Market Cap or Company Size Performance: Year-to-date, Week and Day | |
| Select Chart Type: | ||
|
Best Stocks Today 12Stocks.com |
© 2024 12Stocks.com Terms & Conditions Privacy Contact Us
All Information Provided Only For Education And Not To Be Used For Investing or Trading. See Terms & Conditions


One More Thing ... Get Best Stocks Delivered Daily!
Never Ever Miss A Move With Our Top Ten Stocks Lists
Find Best Stocks In Any Market - Bull or Bear Market
Take A Peek At Our Top Ten Stocks Lists: Daily, Weekly, Year-to-Date & Top Trends
Find Best Stocks In Any Market - Bull or Bear Market
Take A Peek At Our Top Ten Stocks Lists: Daily, Weekly, Year-to-Date & Top Trends
Financial Stocks With Best Up Trends [0-bearish to 100-bullish]: Siebert [100], Office Properties[100], Banco BBVA[100], AG Mortgage[100], Grupo Financiero[100], Banco Macro[100], Global X[100], Grupo Supervielle[100], Reinsurance [100], Camden Property[100], Noah [100]
Best Financial Stocks Year-to-Date:
Root [436.68%], Banco Macro[109.83%], Hippo [103.4%], Gladstone Capital[100.28%], Grupo Financiero[98.78%], Banco BBVA[92.83%], EverQuote [77.7%], Grupo Supervielle[69.21%], Yiren Digital[66.99%], LendingTree [62.96%], Lufax Holding[53.09%] Best Financial Stocks This Week:
Office Properties[42.79%], LendingTree [30.37%], SelectQuote [26.71%], Heartland [23.01%], Industrial Logistics[20.39%], New York[18.86%], KE [17.8%], Banco Macro[17.21%], Douglas Elliman[16.39%], Siebert [14.85%], eXp World[14.82%] Best Financial Stocks Daily:
Siebert [17.17%], SelectQuote [13.33%], Office Properties[12.11%], Banco BBVA[9.27%], Oportun [9.01%], AG Mortgage[8.85%], Diversified Healthcare[8.26%], RE/MAX [7.68%], Grupo Financiero[7.62%], Banco Macro[7.32%], Xenia Hotels[7.01%]