
 Login Sign Up


| |||||
 |  | ||||

| 12Stocks.com Market Intelligence |
Best Financial Stocks
| In a hurry? Financial Stocks Lists: Performance Trends Table, Stock Charts
Sort Financial stocks: Daily, Weekly, Year-to-Date, Market Cap & Trends. Filter Financial stocks list by size:All Financial Large Mid-Range Small & MicroCap |
| 12Stocks.com Financial Stocks Performances & Trends Daily | |||||||||
|
|  The overall Smart Investing & Trading Score is 36 (0-bearish to 100-bullish) which puts Financial sector in short term bearish to neutral trend. The Smart Investing & Trading Score from previous trading session is 21 and hence an improvement of trend.
| ||||||||
Here are the Smart Investing & Trading Scores of the most requested Financial stocks at 12Stocks.com (click stock name for detailed review):
|


| 12Stocks.com: Investing in Financial sector with Stocks | |
|
The following table helps investors and traders sort through current performance and trends (as measured by Smart Investing & Trading Score) of various
stocks in the Financial sector. Quick View: Move mouse or cursor over stock symbol (ticker) to view short-term Technical chart and over stock name to view long term chart. Click on  to add stock symbol to your watchlist and to add stock symbol to your watchlist and  to view watchlist. Click on any ticker or stock name for detailed market intelligence report for that stock. to view watchlist. Click on any ticker or stock name for detailed market intelligence report for that stock. |
12Stocks.com Performance of Stocks in Financial Sector
| Ticker | Stock Name | Watchlist | Category | Recent Price | Trend Score | Change % | YTD Change% |
| AMP | Ameriprise |   | Asset Mgmt | 416.48 | 58 | 0.74% | 9.65% |
| LCNB | LCNB | | Regional Banks | 14.47 | 58 | 0.70% | -8.24% |
| IRS | IRSA Inversiones | | Real Estatet | 9.49 | 58 | 0.32% | 10.35% |
| HIG | Hartford | | Insurance | 97.49 | 58 | 0.28% | 21.29% |
| PHYT | Pyrophyte Acquisition | | SPAC | 11.38 | 58 | 0.18% | 3.45% |
| MCAC | Mountain Crest | | SPAC | 11.23 | 58 | 0.00% | 3.69% |
| CBLS | Changebridge Capital | | Exchange Traded Fund | 23.08 | 58 | 0.00% | 12.07% |
| ALCC | AltC Acquisition | | SPAC | 13.02 | 58 | -6.60% | 23.53% |
| ACT | Enact | | Insurance - Specialty | 29.82 | 58 | -0.50% | 2.54% |
| FG | F&G Annuities | | Insurance - Life | 38.42 | 58 | -0.38% | -16.66% |
| GAIN | Gladstone | | Investments | 14.22 | 58 | -0.14% | 0.49% |
| IVCA | Investcorp India | | SPAC | 11.27 | 58 | 0.09% | 2.45% |
| WIW | Western Asset | | Closed-End Fund - Debt | 8.42 | 58 | 0.00% | -2.88% |
| APCA | AP Acquisition | | SPAC | 11.36 | 58 | 0.00% | 2.07% |
| XYF | X | | Credit Services | 3.91 | 57 | 5.39% | 6.83% |
| MSBI | Midland States | | Regional Banks | 23.81 | 57 | 3.57% | -13.61% |
| PNFP | Pinnacle | | Regional Banks | 80.85 | 57 | 3.32% | -7.30% |
| NWBI | Northwest Bancshares | | S&L | 10.93 | 57 | 2.44% | -12.42% |
| SMBC | Southern Missouri | | S&L | 41.31 | 57 | 2.00% | -22.63% |
| FFIN | First | | Regional - Southwest Banks | 30.59 | 57 | 1.90% | 0.96% |
| CBNK | Capital Bancorp | | S&L | 19.98 | 57 | 1.78% | -17.44% |
| PECO | Phillips Edison | | REIT - Retail | 33.22 | 57 | 1.78% | -9.80% |
| FMNB | Farmers National | | Regional Banks | 12.39 | 57 | 1.31% | -14.26% |
| QCRH | QCR | | Regional - Southwest Banks | 57.00 | 57 | 1.08% | -2.38% |
| LKFN | Lakeland | | Regional Banks | 61.29 | 57 | 1.04% | -5.94% |
| For chart view version of above stock list: Chart View ➞ 0 - 25 , 25 - 50 , 50 - 75 , 75 - 100 , 100 - 125 , 125 - 150 , 150 - 175 , 175 - 200 , 200 - 225 , 225 - 250 , 250 - 275 , 275 - 300 , 300 - 325 , 325 - 350 , 350 - 375 , 375 - 400 , 400 - 425 , 425 - 450 , 450 - 475 , 475 - 500 , 500 - 525 , 525 - 550 , 550 - 575 , 575 - 600 , 600 - 625 , 625 - 650 , 650 - 675 , 675 - 700 , 700 - 725 , 725 - 750 , 750 - 775 , 775 - 800 , 800 - 825 , 825 - 850 , 850 - 875 , 875 - 900 , 900 - 925 , 925 - 950 , 950 - 975 , 975 - 1000 , 1000 - 1025 , 1025 - 1050 , 1050 - 1075 , 1075 - 1100 , 1100 - 1125 , 1125 - 1150 , 1150 - 1175 , 1175 - 1200 , 1200 - 1225 , 1225 - 1250 | ||
 | Click To Change The Sort Order: By Market Cap or Company Size Performance: Year-to-date, Week and Day |  |
|
Get the most comprehensive stock market coverage daily at 12Stocks.com ➞ Best Stocks Today ➞ Best Stocks Weekly ➞ Best Stocks Year-to-Date ➞ Best Stocks Trends ➞  Best Stocks Today 12Stocks.com Best Nasdaq Stocks ➞ Best S&P 500 Stocks ➞ Best Tech Stocks ➞ Best Biotech Stocks ➞ |
| Detailed Overview of Financial Stocks |
| Financial Technical Overview, Leaders & Laggards, Top Financial ETF Funds & Detailed Financial Stocks List, Charts, Trends & More |
| Financial Sector: Technical Analysis, Trends & YTD Performance | |
| Financial sector is composed of stocks
from banks, brokers, insurance, REITs
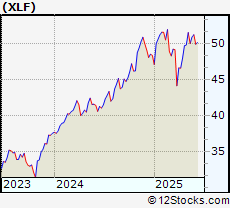
and services subsectors. Financial sector, as represented by XLF, an exchange-traded fund [ETF] that holds basket of Financial stocks (e.g, Bank of America, Goldman Sachs) is up by 7.61% and is currently outperforming the overall market by 1.99% year-to-date. Below is a quick view of Technical charts and trends: |
|
 XLF Weekly Chart |
|
| Long Term Trend: Good | |
| Medium Term Trend: Good | |
 XLF Daily Chart |
|
| Short Term Trend: Not Good | |
| Overall Trend Score: 36 | |
| YTD Performance: 7.61% | |
| **Trend Scores & Views Are Only For Educational Purposes And Not For Investing | |
| 12Stocks.com: Top Performing Financial Sector Stocks | ||||||||||||||||||||||||||||||||||||||||||||||||
 The top performing Financial sector stocks year to date are
Now, more recently, over last week, the top performing Financial sector stocks on the move are


|
||||||||||||||||||||||||||||||||||||||||||||||||
| 12Stocks.com: Investing in Financial Sector using Exchange Traded Funds | |
|
The following table shows list of key exchange traded funds (ETF) that
help investors track Financial Index. For detailed view, check out our ETF Funds section of our website. Quick View: Move mouse or cursor over ETF symbol (ticker) to view short-term Technical chart and over ETF name to view long term chart. Click on ticker or stock name for detailed view. Click on to add stock symbol to your watchlist and to view watchlist. |
12Stocks.com List of ETFs that track Financial Index
| Ticker | ETF Name | Watchlist | Recent Price | Smart Investing & Trading Score | Change % | Week % | Year-to-date % |
| XLF | Financial | | 40.46 | 36 | 0.25 | -0.88 | 7.61% |
| IAI | Broker-Dealers & Secs | | 113.16 | 78 | 0.97 | 0.13 | 4.27% |
| IYF | Financials | | 92.12 | 59 | 0.49 | -0.05 | 7.86% |
| IYG | Financial Services | | 63.89 | 46 | 0.55 | -1.11 | 6.95% |
| KRE | Regional Banking | | 49.02 | 86 | 1.64 | 1.72 | -6.5% |
| IXG | Global Financials | | 84.11 | 66 | 0.61 | -0.1 | 7.04% |
| VFH | Financials | | 98.37 | 46 | 0.62 | -0.57 | 6.62% |
| KBE | Bank | | 45.86 | 100 | 1.30 | 1.17 | -0.35% |
| FAS | Financial Bull 3X | | 97.90 | 15 | 0.62 | -2.71 | 18.45% |
| FAZ | Financial Bear 3X | | 11.18 | 39 | -0.71 | 2.95 | -18.22% |
| UYG | Financials | | 62.44 | 28 | 0.47 | -1.9 | 13.12% |
| IAT | Regional Banks | | 41.90 | 86 | 0.96 | 0.43 | 0.14% |
| KIE | Insurance | | 49.29 | 54 | 0.28 | 1.57 | 9% |
| PSCF | SmallCap Financials | | 46.92 | 93 | 1.47 | 1.21 | -4.6% |
| EUFN | Europe Financials | | 22.59 | 66 | 1.62 | 0.58 | 7.78% |
| PGF | Financial Preferred | | 14.64 | 25 | 0.27 | 0.48 | 0.41% |
| 12Stocks.com: Charts, Trends, Fundamental Data and Performances of Financial Stocks | |
|
We now take in-depth look at all Financial stocks including charts, multi-period performances and overall trends (as measured by Smart Investing & Trading Score). One can sort Financial stocks (click link to choose) by Daily, Weekly and by Year-to-Date performances. Also, one can sort by size of the company or by market capitalization. |
| Select Your Default Chart Type: | |||||
| |||||
| Click on stock symbol or name for detailed view. Click on to add stock symbol to your watchlist and to view watchlist. Quick View: Move mouse or cursor over "Daily" to quickly view daily Technical stock chart and over "Weekly" to view weekly Technical stock chart. | |||||

 | AMP Ameriprise Financial, Inc. |
| Sector: Financials | |
| SubSector: Asset Management | |
| MarketCap: 13270.5 Millions | |
| Recent Price: 416.48 Smart Investing & Trading Score: 58 | |
| Day Percent Change: 0.74% Day Change: 3.04 | |
| Week Change: 1.58% Year-to-date Change: 9.7% | |
| AMP Links: Profile News Message Board | |
| Charts:- Daily , Weekly | |
| Add AMP to Watchlist: View: Get Complete AMP Trend Analysis ➞ | |
 | LCNB LCNB Corp. |
| Sector: Financials | |
| SubSector: Regional - Mid-Atlantic Banks | |
| MarketCap: 176.759 Millions | |
| Recent Price: 14.47 Smart Investing & Trading Score: 58 | |
| Day Percent Change: 0.70% Day Change: 0.10 | |
| Week Change: -5.05% Year-to-date Change: -8.2% | |
| LCNB Links: Profile News Message Board | |
| Charts:- Daily , Weekly | |
| Add LCNB to Watchlist: View: Get Complete LCNB Trend Analysis ➞ | |
 | IRS IRSA Inversiones y Representaciones Sociedad Anonima |
| Sector: Financials | |
| SubSector: Real Estate Development | |
| MarketCap: 257.519 Millions | |
| Recent Price: 9.49 Smart Investing & Trading Score: 58 | |
| Day Percent Change: 0.32% Day Change: 0.03 | |
| Week Change: 0.42% Year-to-date Change: 10.4% | |
| IRS Links: Profile News Message Board | |
| Charts:- Daily , Weekly | |
| Add IRS to Watchlist: View: Get Complete IRS Trend Analysis ➞ | |
 | HIG The Hartford Financial Services Group, Inc. |
| Sector: Financials | |
| SubSector: Property & Casualty Insurance | |
| MarketCap: 12582.8 Millions | |
| Recent Price: 97.49 Smart Investing & Trading Score: 58 | |
| Day Percent Change: 0.28% Day Change: 0.27 | |
| Week Change: 2.3% Year-to-date Change: 21.3% | |
| HIG Links: Profile News Message Board | |
| Charts:- Daily , Weekly | |
| Add HIG to Watchlist: View: Get Complete HIG Trend Analysis ➞ | |
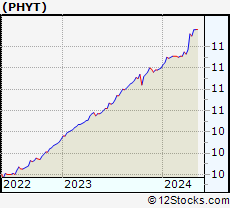 | PHYT Pyrophyte Acquisition Corp. |
| Sector: Financials | |
| SubSector: SPAC | |
| MarketCap: 149 Millions | |
| Recent Price: 11.38 Smart Investing & Trading Score: 58 | |
| Day Percent Change: 0.18% Day Change: 0.02 | |
| Week Change: 0.18% Year-to-date Change: 3.5% | |
| PHYT Links: Profile News Message Board | |
| Charts:- Daily , Weekly | |
| Add PHYT to Watchlist: View: Get Complete PHYT Trend Analysis ➞ | |
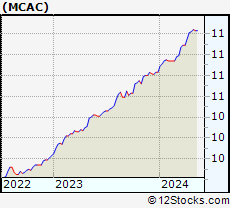 | MCAC Mountain Crest Acquisition Corp |
| Sector: Financials | |
| SubSector: SPAC | |
| MarketCap: 80157 Millions | |
| Recent Price: 11.23 Smart Investing & Trading Score: 58 | |
| Day Percent Change: 0.00% Day Change: 0.00 | |
| Week Change: -0.09% Year-to-date Change: 3.7% | |
| MCAC Links: Profile News Message Board | |
| Charts:- Daily , Weekly | |
| Add MCAC to Watchlist: View: Get Complete MCAC Trend Analysis ➞ | |
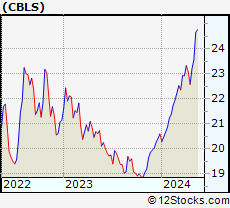 | CBLS Changebridge Capital Long/Short Equity ETF |
| Sector: Financials | |
| SubSector: Exchange Traded Fund | |
| MarketCap: 60157 Millions | |
| Recent Price: 23.08 Smart Investing & Trading Score: 58 | |
| Day Percent Change: 0.00% Day Change: 0.00 | |
| Week Change: -0.56% Year-to-date Change: 12.1% | |
| CBLS Links: Profile News Message Board | |
| Charts:- Daily , Weekly | |
| Add CBLS to Watchlist: View: Get Complete CBLS Trend Analysis ➞ | |
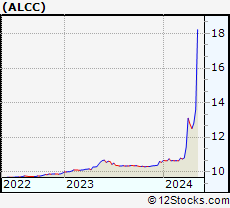 | ALCC AltC Acquisition Corp. |
| Sector: Financials | |
| SubSector: SPAC | |
| MarketCap: 666 Millions | |
| Recent Price: 13.02 Smart Investing & Trading Score: 58 | |
| Day Percent Change: -6.60% Day Change: -0.92 | |
| Week Change: 1.64% Year-to-date Change: 23.5% | |
| ALCC Links: Profile News Message Board | |
| Charts:- Daily , Weekly | |
| Add ALCC to Watchlist: View: Get Complete ALCC Trend Analysis ➞ | |
 | ACT Enact Holdings, Inc. |
| Sector: Financials | |
| SubSector: Insurance - Specialty | |
| MarketCap: 4010 Millions | |
| Recent Price: 29.82 Smart Investing & Trading Score: 58 | |
| Day Percent Change: -0.50% Day Change: -0.15 | |
| Week Change: -0.4% Year-to-date Change: 2.5% | |
| ACT Links: Profile News Message Board | |
| Charts:- Daily , Weekly | |
| Add ACT to Watchlist: View: Get Complete ACT Trend Analysis ➞ | |
 | FG F&G Annuities & Life, Inc. |
| Sector: Financials | |
| SubSector: Insurance - Life | |
| MarketCap: 2960 Millions | |
| Recent Price: 38.42 Smart Investing & Trading Score: 58 | |
| Day Percent Change: -0.38% Day Change: -0.15 | |
| Week Change: -1.55% Year-to-date Change: -16.7% | |
| FG Links: Profile News Message Board | |
| Charts:- Daily , Weekly | |
| Add FG to Watchlist: View: Get Complete FG Trend Analysis ➞ | |
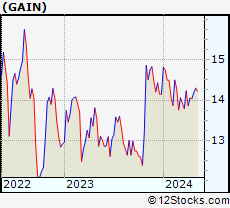 | GAIN Gladstone Investment Corporation |
| Sector: Financials | |
| SubSector: Diversified Investments | |
| MarketCap: 255.17 Millions | |
| Recent Price: 14.22 Smart Investing & Trading Score: 58 | |
| Day Percent Change: -0.14% Day Change: -0.02 | |
| Week Change: 0.21% Year-to-date Change: 0.5% | |
| GAIN Links: Profile News Message Board | |
| Charts:- Daily , Weekly | |
| Add GAIN to Watchlist: View: Get Complete GAIN Trend Analysis ➞ | |
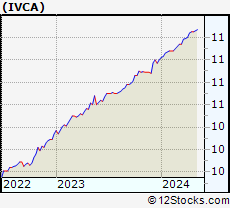 | IVCA Investcorp India Acquisition Corp |
| Sector: Financials | |
| SubSector: SPAC | |
| MarketCap: 345 Millions | |
| Recent Price: 11.27 Smart Investing & Trading Score: 58 | |
| Day Percent Change: 0.09% Day Change: 0.01 | |
| Week Change: 0.18% Year-to-date Change: 2.5% | |
| IVCA Links: Profile News Message Board | |
| Charts:- Daily , Weekly | |
| Add IVCA to Watchlist: View: Get Complete IVCA Trend Analysis ➞ | |
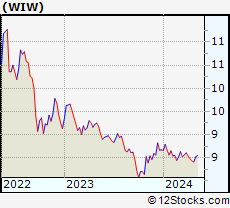 | WIW Western Asset Inflation-Linked Opportunities & Income Fund |
| Sector: Financials | |
| SubSector: Closed-End Fund - Debt | |
| MarketCap: 569.607 Millions | |
| Recent Price: 8.42 Smart Investing & Trading Score: 58 | |
| Day Percent Change: 0.00% Day Change: 0.00 | |
| Week Change: 0.12% Year-to-date Change: -2.9% | |
| WIW Links: Profile News Message Board | |
| Charts:- Daily , Weekly | |
| Add WIW to Watchlist: View: Get Complete WIW Trend Analysis ➞ | |
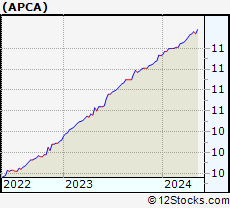 | APCA AP Acquisition Corp. |
| Sector: Financials | |
| SubSector: SPAC | |
| MarketCap: 233 Millions | |
| Recent Price: 11.36 Smart Investing & Trading Score: 58 | |
| Day Percent Change: 0.00% Day Change: 0.00 | |
| Week Change: 0% Year-to-date Change: 2.1% | |
| APCA Links: Profile News Message Board | |
| Charts:- Daily , Weekly | |
| Add APCA to Watchlist: View: Get Complete APCA Trend Analysis ➞ | |
 | XYF X Financial |
| Sector: Financials | |
| SubSector: Credit Services | |
| MarketCap: 168.008 Millions | |
| Recent Price: 3.91 Smart Investing & Trading Score: 57 | |
| Day Percent Change: 5.39% Day Change: 0.20 | |
| Week Change: 1.66% Year-to-date Change: 6.8% | |
| XYF Links: Profile News Message Board | |
| Charts:- Daily , Weekly | |
| Add XYF to Watchlist: View: Get Complete XYF Trend Analysis ➞ | |
 | MSBI Midland States Bancorp, Inc. |
| Sector: Financials | |
| SubSector: Regional - Midwest Banks | |
| MarketCap: 400.27 Millions | |
| Recent Price: 23.81 Smart Investing & Trading Score: 57 | |
| Day Percent Change: 3.57% Day Change: 0.82 | |
| Week Change: 6.48% Year-to-date Change: -13.6% | |
| MSBI Links: Profile News Message Board | |
| Charts:- Daily , Weekly | |
| Add MSBI to Watchlist: View: Get Complete MSBI Trend Analysis ➞ | |
 | PNFP Pinnacle Financial Partners, Inc. |
| Sector: Financials | |
| SubSector: Regional - Southeast Banks | |
| MarketCap: 2771.75 Millions | |
| Recent Price: 80.85 Smart Investing & Trading Score: 57 | |
| Day Percent Change: 3.32% Day Change: 2.60 | |
| Week Change: 0.7% Year-to-date Change: -7.3% | |
| PNFP Links: Profile News Message Board | |
| Charts:- Daily , Weekly | |
| Add PNFP to Watchlist: View: Get Complete PNFP Trend Analysis ➞ | |
 | NWBI Northwest Bancshares, Inc. |
| Sector: Financials | |
| SubSector: Savings & Loans | |
| MarketCap: 1266.3 Millions | |
| Recent Price: 10.93 Smart Investing & Trading Score: 57 | |
| Day Percent Change: 2.44% Day Change: 0.26 | |
| Week Change: 1.02% Year-to-date Change: -12.4% | |
| NWBI Links: Profile News Message Board | |
| Charts:- Daily , Weekly | |
| Add NWBI to Watchlist: View: Get Complete NWBI Trend Analysis ➞ | |
 | SMBC Southern Missouri Bancorp, Inc. |
| Sector: Financials | |
| SubSector: Savings & Loans | |
| MarketCap: 272.53 Millions | |
| Recent Price: 41.31 Smart Investing & Trading Score: 57 | |
| Day Percent Change: 2.00% Day Change: 0.81 | |
| Week Change: 0.9% Year-to-date Change: -22.6% | |
| SMBC Links: Profile News Message Board | |
| Charts:- Daily , Weekly | |
| Add SMBC to Watchlist: View: Get Complete SMBC Trend Analysis ➞ | |
 | FFIN First Financial Bankshares, Inc. |
| Sector: Financials | |
| SubSector: Regional - Southwest Banks | |
| MarketCap: 3503.75 Millions | |
| Recent Price: 30.59 Smart Investing & Trading Score: 57 | |
| Day Percent Change: 1.90% Day Change: 0.57 | |
| Week Change: 0.76% Year-to-date Change: 1.0% | |
| FFIN Links: Profile News Message Board | |
| Charts:- Daily , Weekly | |
| Add FFIN to Watchlist: View: Get Complete FFIN Trend Analysis ➞ | |
 | CBNK Capital Bancorp, Inc. |
| Sector: Financials | |
| SubSector: Savings & Loans | |
| MarketCap: 174.93 Millions | |
| Recent Price: 19.98 Smart Investing & Trading Score: 57 | |
| Day Percent Change: 1.78% Day Change: 0.35 | |
| Week Change: 2.04% Year-to-date Change: -17.4% | |
| CBNK Links: Profile News Message Board | |
| Charts:- Daily , Weekly | |
| Add CBNK to Watchlist: View: Get Complete CBNK Trend Analysis ➞ | |
 | PECO Phillips Edison & Company, Inc. |
| Sector: Financials | |
| SubSector: REIT - Retail | |
| MarketCap: 3920 Millions | |
| Recent Price: 33.22 Smart Investing & Trading Score: 57 | |
| Day Percent Change: 1.78% Day Change: 0.58 | |
| Week Change: 1.87% Year-to-date Change: -9.8% | |
| PECO Links: Profile News Message Board | |
| Charts:- Daily , Weekly | |
| Add PECO to Watchlist: View: Get Complete PECO Trend Analysis ➞ | |
 | FMNB Farmers National Banc Corp. |
| Sector: Financials | |
| SubSector: Regional - Midwest Banks | |
| MarketCap: 366.57 Millions | |
| Recent Price: 12.39 Smart Investing & Trading Score: 57 | |
| Day Percent Change: 1.31% Day Change: 0.16 | |
| Week Change: 2.65% Year-to-date Change: -14.3% | |
| FMNB Links: Profile News Message Board | |
| Charts:- Daily , Weekly | |
| Add FMNB to Watchlist: View: Get Complete FMNB Trend Analysis ➞ | |
 | QCRH QCR Holdings, Inc. |
| Sector: Financials | |
| SubSector: Regional - Southwest Banks | |
| MarketCap: 465.765 Millions | |
| Recent Price: 57.00 Smart Investing & Trading Score: 57 | |
| Day Percent Change: 1.08% Day Change: 0.61 | |
| Week Change: 1.41% Year-to-date Change: -2.4% | |
| QCRH Links: Profile News Message Board | |
| Charts:- Daily , Weekly | |
| Add QCRH to Watchlist: View: Get Complete QCRH Trend Analysis ➞ | |
 | LKFN Lakeland Financial Corporation |
| Sector: Financials | |
| SubSector: Regional - Midwest Banks | |
| MarketCap: 903.27 Millions | |
| Recent Price: 61.29 Smart Investing & Trading Score: 57 | |
| Day Percent Change: 1.04% Day Change: 0.63 | |
| Week Change: 2.54% Year-to-date Change: -5.9% | |
| LKFN Links: Profile News Message Board | |
| Charts:- Daily , Weekly | |
| Add LKFN to Watchlist: View: Get Complete LKFN Trend Analysis ➞ | |
| For tabular summary view of above stock list: Summary View ➞ 0 - 25 , 25 - 50 , 50 - 75 , 75 - 100 , 100 - 125 , 125 - 150 , 150 - 175 , 175 - 200 , 200 - 225 , 225 - 250 , 250 - 275 , 275 - 300 , 300 - 325 , 325 - 350 , 350 - 375 , 375 - 400 , 400 - 425 , 425 - 450 , 450 - 475 , 475 - 500 , 500 - 525 , 525 - 550 , 550 - 575 , 575 - 600 , 600 - 625 , 625 - 650 , 650 - 675 , 675 - 700 , 700 - 725 , 725 - 750 , 750 - 775 , 775 - 800 , 800 - 825 , 825 - 850 , 850 - 875 , 875 - 900 , 900 - 925 , 925 - 950 , 950 - 975 , 975 - 1000 , 1000 - 1025 , 1025 - 1050 , 1050 - 1075 , 1075 - 1100 , 1100 - 1125 , 1125 - 1150 , 1150 - 1175 , 1175 - 1200 , 1200 - 1225 , 1225 - 1250 | ||
| Click To Change The Sort Order: By Market Cap or Company Size Performance: Year-to-date, Week and Day | |
| Select Chart Type: | ||
|
Best Stocks Today 12Stocks.com |
© 2024 12Stocks.com Terms & Conditions Privacy Contact Us
All Information Provided Only For Education And Not To Be Used For Investing or Trading. See Terms & Conditions


One More Thing ... Get Best Stocks Delivered Daily!
Never Ever Miss A Move With Our Top Ten Stocks Lists
Find Best Stocks In Any Market - Bull or Bear Market
Take A Peek At Our Top Ten Stocks Lists: Daily, Weekly, Year-to-Date & Top Trends
Find Best Stocks In Any Market - Bull or Bear Market
Take A Peek At Our Top Ten Stocks Lists: Daily, Weekly, Year-to-Date & Top Trends
Financial Stocks With Best Up Trends [0-bearish to 100-bullish]: KE [100], Regional Management[100], Noah [100], 360 Finance[100], ING Groep[100], Markel [100], Genworth [100], Ventas [100], EverQuote [100], AXIS Capital[100], China Fund[100]
Best Financial Stocks Year-to-Date:
Root [442.98%], Hippo [99.34%], Gladstone Capital[98.5%], Banco Macro[95.51%], Grupo Financiero[84.71%], Banco BBVA[76.47%], EverQuote [75.9%], Yiren Digital[74.68%], LendingTree [62.7%], Grupo Supervielle[60.34%], B. Riley[59.98%] Best Financial Stocks This Week:
LendingTree [30.16%], Office Properties[27.36%], Huize Holding[22.7%], Heartland [21.11%], Industrial Logistics[17.36%], Douglas Elliman[16.81%], LendingClub [15.19%], KE [13.55%], New York[13.47%], Territorial Bancorp[12.02%], SelectQuote [11.8%] Best Financial Stocks Daily:
Office Properties[28.00%], Huize Holding[13.70%], KE [12.64%], SelectQuote [11.80%], eXp World[10.84%], Coinbase Global[10.36%], Regional Management[8.03%], Noah [7.83%], Cipher Mining[7.74%], 360 Finance[7.05%], ING Groep[7.03%]