
 Login Sign Up


| |||||
 |  | ||||

| 12Stocks.com Market Intelligence |
Best Financial Stocks
| In a hurry? Financial Stocks Lists: Performance Trends Table, Stock Charts
Sort Financial stocks: Daily, Weekly, Year-to-Date, Market Cap & Trends. Filter Financial stocks list by size:All Financial Large Mid-Range Small & MicroCap |
| 12Stocks.com Financial Stocks Performances & Trends Daily | |||||||||
|
|  The overall Smart Investing & Trading Score is 90 (0-bearish to 100-bullish) which puts Financial sector in short term bullish trend. The Smart Investing & Trading Score from previous trading session is 95 and hence a deterioration of trend.
| ||||||||
Here are the Smart Investing & Trading Scores of the most requested Financial stocks at 12Stocks.com (click stock name for detailed review):
|


| 12Stocks.com: Investing in Financial sector with Stocks | |
|
The following table helps investors and traders sort through current performance and trends (as measured by Smart Investing & Trading Score) of various
stocks in the Financial sector. Quick View: Move mouse or cursor over stock symbol (ticker) to view short-term Technical chart and over stock name to view long term chart. Click on  to add stock symbol to your watchlist and to add stock symbol to your watchlist and  to view watchlist. Click on any ticker or stock name for detailed market intelligence report for that stock. to view watchlist. Click on any ticker or stock name for detailed market intelligence report for that stock. |
12Stocks.com Performance of Stocks in Financial Sector
| Ticker | Stock Name | Watchlist | Category | Recent Price | Trend Score | Change % | YTD Change% |
| CBSH | Commerce Bancshares |   | Regional Banks | 56.38 | 76 | 0.64% | 5.56% |
| SRCE | 1st Source | | Regional Banks | 51.67 | 76 | 0.58% | -5.97% |
| NXRT | NexPoint Residential | | REIT | 35.02 | 76 | 0.57% | 1.71% |
| FBP | First Ban | | Foreign Banks | 18.06 | 76 | 0.50% | 9.79% |
| NTB | Bank of N.T. Butterfield & Son | | Foreign Banks | 35.27 | 76 | 0.46% | 10.18% |
| NNI | Nelnet | | Credit Services | 96.74 | 76 | 0.44% | 9.66% |
| ETX | Eaton Vance | | Asset Mgmt | 18.34 | 76 | 0.44% | 5.77% |
| IIF | Morgan Stanley | | Closed-End Fund - Foreign | 23.63 | 76 | 0.38% | 10.06% |
| CXW | CoreCivic | | REIT - | 15.36 | 76 | 0.33% | 5.71% |
| UCBI | United Community | | Regional Banks | 26.35 | 76 | 0.27% | -9.95% |
| ABCB | Ameris Bancorp | | Regional Banks | 49.63 | 76 | 0.26% | -6.45% |
| IVR | Invesco Mortgage | | Mortgage | 9.14 | 76 | 0.22% | 3.16% |
| PB | Prosperity Bancshares | | Regional - Southwest Banks | 63.25 | 76 | 0.22% | -6.61% |
| HYT | BlackRock Corporate | | Closed-End Fund - Debt | 9.88 | 76 | 0.10% | 4.77% |
| CADE | Cadence Ban | | Regional Banks | 29.20 | 76 | 0.07% | -1.32% |
| SIXH | 6 Meridian | | Exchange Traded Fund | 35.70 | 76 | 0.06% | 7.21% |
| FFBC | First | | Regional Banks | 23.33 | 76 | 0.00% | -1.77% |
| PDT | John Hancock | | Closed-End Fund - Debt | 11.67 | 76 | 0.00% | 9.58% |
| ALSA | Alpha Star | | SPAC | 11.44 | 76 | 0.00% | 2.23% |
| MAA | Mid-America Apartment | | REIT | 132.99 | 76 | -2.35% | -1.09% |
| UDR | UDR | | REIT | 38.27 | 76 | -1.80% | -0.05% |
| NNN | National Retail | | REIT - | 41.72 | 76 | -1.74% | -3.20% |
| WPC | W. P. | | REIT - | 56.79 | 76 | -1.70% | -12.37% |
| ADC | Agree Realty | | Property Mgmt | 58.35 | 76 | -1.44% | -7.31% |
| NTST | NetSTREIT | | REIT Retail | 17.25 | 76 | -1.26% | -3.42% |
| For chart view version of above stock list: Chart View ➞ 0 - 25 , 25 - 50 , 50 - 75 , 75 - 100 , 100 - 125 , 125 - 150 , 150 - 175 , 175 - 200 , 200 - 225 , 225 - 250 , 250 - 275 , 275 - 300 , 300 - 325 , 325 - 350 , 350 - 375 , 375 - 400 , 400 - 425 , 425 - 450 , 450 - 475 , 475 - 500 , 500 - 525 , 525 - 550 , 550 - 575 , 575 - 600 , 600 - 625 , 625 - 650 , 650 - 675 , 675 - 700 , 700 - 725 , 725 - 750 , 750 - 775 , 775 - 800 , 800 - 825 , 825 - 850 , 850 - 875 , 875 - 900 , 900 - 925 , 925 - 950 , 950 - 975 , 975 - 1000 , 1000 - 1025 , 1025 - 1050 , 1050 - 1075 , 1075 - 1100 , 1100 - 1125 , 1125 - 1150 , 1150 - 1175 , 1175 - 1200 , 1200 - 1225 | ||
 | Click To Change The Sort Order: By Market Cap or Company Size Performance: Year-to-date, Week and Day |  |
|
Get the most comprehensive stock market coverage daily at 12Stocks.com ➞ Best Stocks Today ➞ Best Stocks Weekly ➞ Best Stocks Year-to-Date ➞ Best Stocks Trends ➞  Best Stocks Today 12Stocks.com Best Nasdaq Stocks ➞ Best S&P 500 Stocks ➞ Best Tech Stocks ➞ Best Biotech Stocks ➞ |
| Detailed Overview of Financial Stocks |
| Financial Technical Overview, Leaders & Laggards, Top Financial ETF Funds & Detailed Financial Stocks List, Charts, Trends & More |
| Financial Sector: Technical Analysis, Trends & YTD Performance | |
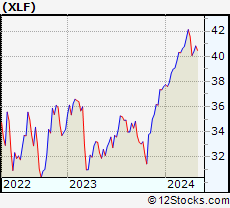
| Financial sector is composed of stocks
from banks, brokers, insurance, REITs
and services subsectors. Financial sector, as represented by XLF, an exchange-traded fund [ETF] that holds basket of Financial stocks (e.g, Bank of America, Goldman Sachs) is up by 10% and is currently outperforming the overall market by 1.96% year-to-date. Below is a quick view of Technical charts and trends: |
|
 XLF Weekly Chart |
|
| Long Term Trend: Very Good | |
| Medium Term Trend: Very Good | |
 XLF Daily Chart |
|
| Short Term Trend: Very Good | |
| Overall Trend Score: 90 | |
| YTD Performance: 10% | |
| **Trend Scores & Views Are Only For Educational Purposes And Not For Investing | |
| 12Stocks.com: Top Performing Financial Sector Stocks | ||||||||||||||||||||||||||||||||||||||||||||||||
 The top performing Financial sector stocks year to date are
Now, more recently, over last week, the top performing Financial sector stocks on the move are


|
||||||||||||||||||||||||||||||||||||||||||||||||
| 12Stocks.com: Investing in Financial Sector using Exchange Traded Funds | |
|
The following table shows list of key exchange traded funds (ETF) that
help investors track Financial Index. For detailed view, check out our ETF Funds section of our website. Quick View: Move mouse or cursor over ETF symbol (ticker) to view short-term Technical chart and over ETF name to view long term chart. Click on ticker or stock name for detailed view. Click on to add stock symbol to your watchlist and to view watchlist. |
12Stocks.com List of ETFs that track Financial Index
| Ticker | ETF Name | Watchlist | Recent Price | Smart Investing & Trading Score | Change % | Week % | Year-to-date % |
| XLF | Financial | | 41.36 | 90 | 0.36 | 2 | 10% |
| IAI | Broker-Dealers & Secs | | 115.70 | 93 | 0.13 | 1.25 | 6.61% |
| IYF | Financials | | 94.06 | 88 | 0.34 | 1.72 | 10.13% |
| IYG | Financial Services | | 65.27 | 95 | 0.42 | 1.84 | 9.26% |
| KRE | Regional Banking | | 50.17 | 88 | 0.58 | 1.05 | -4.31% |
| IXG | Global Financials | | 85.93 | 88 | -0.28 | 1.28 | 9.36% |
| VFH | Financials | | 100.48 | 95 | 0.39 | 1.8 | 8.91% |
| KBE | Bank | | 47.05 | 88 | 0.49 | 1.42 | 2.24% |
| FAS | Financial Bull 3X | | 104.40 | 95 | 1.10 | 5.64 | 26.32% |
| FAZ | Financial Bear 3X | | 10.47 | 0 | -1.32 | -5.51 | -23.41% |
| UYG | Financials | | 64.79 | 95 | 0.11 | 3.19 | 17.37% |
| IAT | Regional Banks | | 42.79 | 93 | 0.71 | 1.18 | 2.27% |
| KIE | Insurance | | 50.80 | 95 | 0.18 | 2.67 | 12.34% |
| PSCF | SmallCap Financials | | 47.64 | 88 | -0.43 | 0.77 | -3.13% |
| EUFN | Europe Financials | | 23.32 | 100 | 0.32 | 3 | 11.28% |
| PGF | Financial Preferred | | 14.69 | 32 | -0.81 | -1.08 | 0.75% |
| 12Stocks.com: Charts, Trends, Fundamental Data and Performances of Financial Stocks | |
|
We now take in-depth look at all Financial stocks including charts, multi-period performances and overall trends (as measured by Smart Investing & Trading Score). One can sort Financial stocks (click link to choose) by Daily, Weekly and by Year-to-Date performances. Also, one can sort by size of the company or by market capitalization. |
| Select Your Default Chart Type: | |||||
| |||||
| Click on stock symbol or name for detailed view. Click on to add stock symbol to your watchlist and to view watchlist. Quick View: Move mouse or cursor over "Daily" to quickly view daily Technical stock chart and over "Weekly" to view weekly Technical stock chart. | |||||

 | CBSH Commerce Bancshares, Inc. |
| Sector: Financials | |
| SubSector: Regional - Midwest Banks | |
| MarketCap: 6201.5 Millions | |
| Recent Price: 56.38 Smart Investing & Trading Score: 76 | |
| Day Percent Change: 0.64% Day Change: 0.36 | |
| Week Change: 0.43% Year-to-date Change: 5.6% | |
| CBSH Links: Profile News Message Board | |
| Charts:- Daily , Weekly | |
| Add CBSH to Watchlist: View: Get Complete CBSH Trend Analysis ➞ | |
 | SRCE 1st Source Corporation |
| Sector: Financials | |
| SubSector: Regional - Midwest Banks | |
| MarketCap: 784.77 Millions | |
| Recent Price: 51.67 Smart Investing & Trading Score: 76 | |
| Day Percent Change: 0.58% Day Change: 0.30 | |
| Week Change: 0.43% Year-to-date Change: -6.0% | |
| SRCE Links: Profile News Message Board | |
| Charts:- Daily , Weekly | |
| Add SRCE to Watchlist: View: Get Complete SRCE Trend Analysis ➞ | |
 | NXRT NexPoint Residential Trust, Inc. |
| Sector: Financials | |
| SubSector: REIT - Residential | |
| MarketCap: 839.161 Millions | |
| Recent Price: 35.02 Smart Investing & Trading Score: 76 | |
| Day Percent Change: 0.57% Day Change: 0.20 | |
| Week Change: 0.49% Year-to-date Change: 1.7% | |
| NXRT Links: Profile News Message Board | |
| Charts:- Daily , Weekly | |
| Add NXRT to Watchlist: View: Get Complete NXRT Trend Analysis ➞ | |
 | FBP First BanCorp. |
| Sector: Financials | |
| SubSector: Foreign Regional Banks | |
| MarketCap: 913.079 Millions | |
| Recent Price: 18.06 Smart Investing & Trading Score: 76 | |
| Day Percent Change: 0.50% Day Change: 0.09 | |
| Week Change: -0.11% Year-to-date Change: 9.8% | |
| FBP Links: Profile News Message Board | |
| Charts:- Daily , Weekly | |
| Add FBP to Watchlist: View: Get Complete FBP Trend Analysis ➞ | |
 | NTB The Bank of N.T. Butterfield & Son Limited |
| Sector: Financials | |
| SubSector: Foreign Regional Banks | |
| MarketCap: 889.379 Millions | |
| Recent Price: 35.27 Smart Investing & Trading Score: 76 | |
| Day Percent Change: 0.46% Day Change: 0.16 | |
| Week Change: -0.28% Year-to-date Change: 10.2% | |
| NTB Links: Profile News Message Board | |
| Charts:- Daily , Weekly | |
| Add NTB to Watchlist: View: Get Complete NTB Trend Analysis ➞ | |
 | NNI Nelnet, Inc. |
| Sector: Financials | |
| SubSector: Credit Services | |
| MarketCap: 1664.38 Millions | |
| Recent Price: 96.74 Smart Investing & Trading Score: 76 | |
| Day Percent Change: 0.44% Day Change: 0.42 | |
| Week Change: 0.18% Year-to-date Change: 9.7% | |
| NNI Links: Profile News Message Board | |
| Charts:- Daily , Weekly | |
| Add NNI to Watchlist: View: Get Complete NNI Trend Analysis ➞ | |
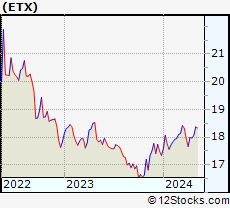 | ETX Eaton Vance Municipal Income 2028 Term Trust |
| Sector: Financials | |
| SubSector: Asset Management | |
| MarketCap: 199.103 Millions | |
| Recent Price: 18.34 Smart Investing & Trading Score: 76 | |
| Day Percent Change: 0.44% Day Change: 0.08 | |
| Week Change: -0.16% Year-to-date Change: 5.8% | |
| ETX Links: Profile News Message Board | |
| Charts:- Daily , Weekly | |
| Add ETX to Watchlist: View: Get Complete ETX Trend Analysis ➞ | |
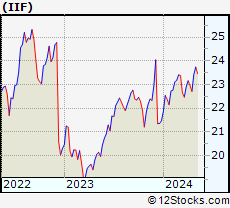 | IIF Morgan Stanley India Investment Fund, Inc. |
| Sector: Financials | |
| SubSector: Closed-End Fund - Foreign | |
| MarketCap: 166.247 Millions | |
| Recent Price: 23.63 Smart Investing & Trading Score: 76 | |
| Day Percent Change: 0.38% Day Change: 0.09 | |
| Week Change: -0.46% Year-to-date Change: 10.1% | |
| IIF Links: Profile News Message Board | |
| Charts:- Daily , Weekly | |
| Add IIF to Watchlist: View: Get Complete IIF Trend Analysis ➞ | |
 | CXW CoreCivic, Inc. |
| Sector: Financials | |
| SubSector: REIT - Diversified | |
| MarketCap: 1440.23 Millions | |
| Recent Price: 15.36 Smart Investing & Trading Score: 76 | |
| Day Percent Change: 0.33% Day Change: 0.05 | |
| Week Change: 0.66% Year-to-date Change: 5.7% | |
| CXW Links: Profile News Message Board | |
| Charts:- Daily , Weekly | |
| Add CXW to Watchlist: View: Get Complete CXW Trend Analysis ➞ | |
 | UCBI United Community Banks, Inc. |
| Sector: Financials | |
| SubSector: Regional - Mid-Atlantic Banks | |
| MarketCap: 1593.99 Millions | |
| Recent Price: 26.35 Smart Investing & Trading Score: 76 | |
| Day Percent Change: 0.27% Day Change: 0.07 | |
| Week Change: 0.11% Year-to-date Change: -10.0% | |
| UCBI Links: Profile News Message Board | |
| Charts:- Daily , Weekly | |
| Add UCBI to Watchlist: View: Get Complete UCBI Trend Analysis ➞ | |
 | ABCB Ameris Bancorp |
| Sector: Financials | |
| SubSector: Regional - Mid-Atlantic Banks | |
| MarketCap: 1537.79 Millions | |
| Recent Price: 49.63 Smart Investing & Trading Score: 76 | |
| Day Percent Change: 0.26% Day Change: 0.13 | |
| Week Change: -0.38% Year-to-date Change: -6.5% | |
| ABCB Links: Profile News Message Board | |
| Charts:- Daily , Weekly | |
| Add ABCB to Watchlist: View: Get Complete ABCB Trend Analysis ➞ | |
 | IVR Invesco Mortgage Capital Inc. |
| Sector: Financials | |
| SubSector: Mortgage Investment | |
| MarketCap: 1182.19 Millions | |
| Recent Price: 9.14 Smart Investing & Trading Score: 76 | |
| Day Percent Change: 0.22% Day Change: 0.02 | |
| Week Change: 0.33% Year-to-date Change: 3.2% | |
| IVR Links: Profile News Message Board | |
| Charts:- Daily , Weekly | |
| Add IVR to Watchlist: View: Get Complete IVR Trend Analysis ➞ | |
 | PB Prosperity Bancshares, Inc. |
| Sector: Financials | |
| SubSector: Regional - Southwest Banks | |
| MarketCap: 4682.25 Millions | |
| Recent Price: 63.25 Smart Investing & Trading Score: 76 | |
| Day Percent Change: 0.22% Day Change: 0.14 | |
| Week Change: 0.29% Year-to-date Change: -6.6% | |
| PB Links: Profile News Message Board | |
| Charts:- Daily , Weekly | |
| Add PB to Watchlist: View: Get Complete PB Trend Analysis ➞ | |
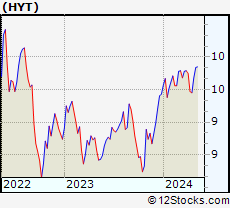 | HYT BlackRock Corporate High Yield Fund, Inc. |
| Sector: Financials | |
| SubSector: Closed-End Fund - Debt | |
| MarketCap: 902.007 Millions | |
| Recent Price: 9.88 Smart Investing & Trading Score: 76 | |
| Day Percent Change: 0.10% Day Change: 0.01 | |
| Week Change: 0.41% Year-to-date Change: 4.8% | |
| HYT Links: Profile News Message Board | |
| Charts:- Daily , Weekly | |
| Add HYT to Watchlist: View: Get Complete HYT Trend Analysis ➞ | |
 | CADE Cadence Bancorporation |
| Sector: Financials | |
| SubSector: Regional - Southeast Banks | |
| MarketCap: 756.335 Millions | |
| Recent Price: 29.20 Smart Investing & Trading Score: 76 | |
| Day Percent Change: 0.07% Day Change: 0.02 | |
| Week Change: 0.69% Year-to-date Change: -1.3% | |
| CADE Links: Profile News Message Board | |
| Charts:- Daily , Weekly | |
| Add CADE to Watchlist: View: Get Complete CADE Trend Analysis ➞ | |
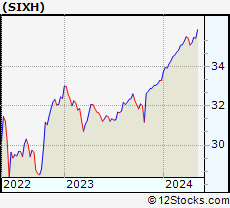 | SIXH 6 Meridian Hedged Equity Index Option Strategy ETF |
| Sector: Financials | |
| SubSector: Exchange Traded Fund | |
| MarketCap: 60157 Millions | |
| Recent Price: 35.70 Smart Investing & Trading Score: 76 | |
| Day Percent Change: 0.06% Day Change: 0.02 | |
| Week Change: 0.68% Year-to-date Change: 7.2% | |
| SIXH Links: Profile News Message Board | |
| Charts:- Daily , Weekly | |
| Add SIXH to Watchlist: View: Get Complete SIXH Trend Analysis ➞ | |
 | FFBC First Financial Bancorp. |
| Sector: Financials | |
| SubSector: Regional - Midwest Banks | |
| MarketCap: 1363.7 Millions | |
| Recent Price: 23.33 Smart Investing & Trading Score: 76 | |
| Day Percent Change: 0.00% Day Change: 0.00 | |
| Week Change: 0.17% Year-to-date Change: -1.8% | |
| FFBC Links: Profile News Message Board | |
| Charts:- Daily , Weekly | |
| Add FFBC to Watchlist: View: Get Complete FFBC Trend Analysis ➞ | |
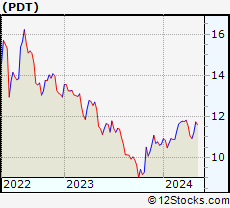 | PDT John Hancock Premium Dividend Fund |
| Sector: Financials | |
| SubSector: Closed-End Fund - Debt | |
| MarketCap: 404.207 Millions | |
| Recent Price: 11.67 Smart Investing & Trading Score: 76 | |
| Day Percent Change: 0.00% Day Change: 0.00 | |
| Week Change: -0.51% Year-to-date Change: 9.6% | |
| PDT Links: Profile News Message Board | |
| Charts:- Daily , Weekly | |
| Add PDT to Watchlist: View: Get Complete PDT Trend Analysis ➞ | |
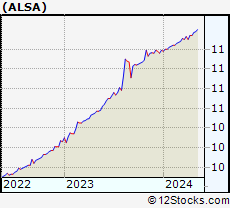 | ALSA Alpha Star Acquisition Corporation |
| Sector: Financials | |
| SubSector: SPAC | |
| MarketCap: 158 Millions | |
| Recent Price: 11.44 Smart Investing & Trading Score: 76 | |
| Day Percent Change: 0.00% Day Change: 0.00 | |
| Week Change: 0.53% Year-to-date Change: 2.2% | |
| ALSA Links: Profile News Message Board | |
| Charts:- Daily , Weekly | |
| Add ALSA to Watchlist: View: Get Complete ALSA Trend Analysis ➞ | |
 | MAA Mid-America Apartment Communities, Inc. |
| Sector: Financials | |
| SubSector: REIT - Residential | |
| MarketCap: 11385.5 Millions | |
| Recent Price: 132.99 Smart Investing & Trading Score: 76 | |
| Day Percent Change: -2.35% Day Change: -3.20 | |
| Week Change: -0.01% Year-to-date Change: -1.1% | |
| MAA Links: Profile News Message Board | |
| Charts:- Daily , Weekly | |
| Add MAA to Watchlist: View: Get Complete MAA Trend Analysis ➞ | |
 | UDR UDR, Inc. |
| Sector: Financials | |
| SubSector: REIT - Residential | |
| MarketCap: 10180.1 Millions | |
| Recent Price: 38.27 Smart Investing & Trading Score: 76 | |
| Day Percent Change: -1.80% Day Change: -0.70 | |
| Week Change: 0.1% Year-to-date Change: -0.1% | |
| UDR Links: Profile News Message Board | |
| Charts:- Daily , Weekly | |
| Add UDR to Watchlist: View: Get Complete UDR Trend Analysis ➞ | |
 | NNN National Retail Properties, Inc. |
| Sector: Financials | |
| SubSector: REIT - Diversified | |
| MarketCap: 5459.93 Millions | |
| Recent Price: 41.72 Smart Investing & Trading Score: 76 | |
| Day Percent Change: -1.74% Day Change: -0.74 | |
| Week Change: -0.19% Year-to-date Change: -3.2% | |
| NNN Links: Profile News Message Board | |
| Charts:- Daily , Weekly | |
| Add NNN to Watchlist: View: Get Complete NNN Trend Analysis ➞ | |
 | WPC W. P. Carey Inc. |
| Sector: Financials | |
| SubSector: REIT - Diversified | |
| MarketCap: 9560.03 Millions | |
| Recent Price: 56.79 Smart Investing & Trading Score: 76 | |
| Day Percent Change: -1.70% Day Change: -0.98 | |
| Week Change: 0.19% Year-to-date Change: -12.4% | |
| WPC Links: Profile News Message Board | |
| Charts:- Daily , Weekly | |
| Add WPC to Watchlist: View: Get Complete WPC Trend Analysis ➞ | |
 | ADC Agree Realty Corporation |
| Sector: Financials | |
| SubSector: Property Management | |
| MarketCap: 2573.82 Millions | |
| Recent Price: 58.35 Smart Investing & Trading Score: 76 | |
| Day Percent Change: -1.44% Day Change: -0.85 | |
| Week Change: -0.73% Year-to-date Change: -7.3% | |
| ADC Links: Profile News Message Board | |
| Charts:- Daily , Weekly | |
| Add ADC to Watchlist: View: Get Complete ADC Trend Analysis ➞ | |
 | NTST NetSTREIT Corp. |
| Sector: Financials | |
| SubSector: REIT Retail | |
| MarketCap: 51267 Millions | |
| Recent Price: 17.25 Smart Investing & Trading Score: 76 | |
| Day Percent Change: -1.26% Day Change: -0.22 | |
| Week Change: -0.63% Year-to-date Change: -3.4% | |
| NTST Links: Profile News Message Board | |
| Charts:- Daily , Weekly | |
| Add NTST to Watchlist: View: Get Complete NTST Trend Analysis ➞ | |
| For tabular summary view of above stock list: Summary View ➞ 0 - 25 , 25 - 50 , 50 - 75 , 75 - 100 , 100 - 125 , 125 - 150 , 150 - 175 , 175 - 200 , 200 - 225 , 225 - 250 , 250 - 275 , 275 - 300 , 300 - 325 , 325 - 350 , 350 - 375 , 375 - 400 , 400 - 425 , 425 - 450 , 450 - 475 , 475 - 500 , 500 - 525 , 525 - 550 , 550 - 575 , 575 - 600 , 600 - 625 , 625 - 650 , 650 - 675 , 675 - 700 , 700 - 725 , 725 - 750 , 750 - 775 , 775 - 800 , 800 - 825 , 825 - 850 , 850 - 875 , 875 - 900 , 900 - 925 , 925 - 950 , 950 - 975 , 975 - 1000 , 1000 - 1025 , 1025 - 1050 , 1050 - 1075 , 1075 - 1100 , 1100 - 1125 , 1125 - 1150 , 1150 - 1175 , 1175 - 1200 , 1200 - 1225 | ||
| Click To Change The Sort Order: By Market Cap or Company Size Performance: Year-to-date, Week and Day | |
| Select Chart Type: | ||
|
Best Stocks Today 12Stocks.com |
© 2024 12Stocks.com Terms & Conditions Privacy Contact Us
All Information Provided Only For Education And Not To Be Used For Investing or Trading. See Terms & Conditions


One More Thing ... Get Best Stocks Delivered Daily!
Never Ever Miss A Move With Our Top Ten Stocks Lists
Find Best Stocks In Any Market - Bull or Bear Market
Take A Peek At Our Top Ten Stocks Lists: Daily, Weekly, Year-to-Date & Top Trends
Find Best Stocks In Any Market - Bull or Bear Market
Take A Peek At Our Top Ten Stocks Lists: Daily, Weekly, Year-to-Date & Top Trends
Financial Stocks With Best Up Trends [0-bearish to 100-bullish]: Hannon Armstrong[100], BRP [100], AltC Acquisition[100], KB [100], IRSA Inversiones[100], Credicorp [100], WhiteHorse Finance[100], Corebridge [100], Lakeland Bancorp[100], Provident [100], Mercury General[100]
Best Financial Stocks Year-to-Date:
Root [497.8%], Banco Macro[124.63%], Grupo Financiero[109.18%], Gladstone Capital[105.7%], Banco BBVA[105.51%], Hippo [103.29%], EverQuote [94.61%], SelectQuote [82.85%], Grupo Supervielle[79.56%], Vista Oil[59.76%], LendingTree [57.47%] Best Financial Stocks This Week:
Ambac [24.88%], SelectQuote [22.79%], Hannon Armstrong[17.21%], Trupanion [16.12%], Globe Life[15.4%], BRP [14.02%], eHealth [13.56%], IRSA Inversiones[13.52%], Citizens [12.32%], Root [11.39%], AltC Acquisition[11.35%] Best Financial Stocks Daily:
Hannon Armstrong[16.27%], BRP [12.10%], Citizens [11.79%], OppFi [11.67%], Hywin [11.14%], Huize Holding[6.04%], Camping World[5.86%], AltC Acquisition[5.68%], Globe Life[5.08%], Civista Bancshares[4.85%], National Bankshares[4.80%]