
 Login Sign Up


| |||||
 |  | ||||

| 12Stocks.com Market Intelligence |
Best Financial Stocks
| In a hurry? Financial Stocks Lists: Performance Trends Table, Stock Charts
Sort Financial stocks: Daily, Weekly, Year-to-Date, Market Cap & Trends. Filter Financial stocks list by size:All Financial Large Mid-Range Small & MicroCap |
| 12Stocks.com Financial Stocks Performances & Trends Daily | |||||||||
|
|  The overall Smart Investing & Trading Score is 53 (0-bearish to 100-bullish) which puts Financial sector in short term neutral trend. The Smart Investing & Trading Score from previous trading session is 36 and hence an improvement of trend.
| ||||||||
Here are the Smart Investing & Trading Scores of the most requested Financial stocks at 12Stocks.com (click stock name for detailed review):
|


| 12Stocks.com: Investing in Financial sector with Stocks | |
|
The following table helps investors and traders sort through current performance and trends (as measured by Smart Investing & Trading Score) of various
stocks in the Financial sector. Quick View: Move mouse or cursor over stock symbol (ticker) to view short-term Technical chart and over stock name to view long term chart. Click on  to add stock symbol to your watchlist and to add stock symbol to your watchlist and  to view watchlist. Click on any ticker or stock name for detailed market intelligence report for that stock. to view watchlist. Click on any ticker or stock name for detailed market intelligence report for that stock. |
12Stocks.com Performance of Stocks in Financial Sector
| Ticker | Stock Name | Watchlist | Category | Recent Price | Trend Score | Change % | YTD Change% |
| CAC | Camden National |   | Regional Banks | 32.03 | 95 | -0.31% | -14.88% |
| EQBK | Equity Bancshares | | Regional Banks | 34.04 | 95 | -0.29% | 0.41% |
| BRT | BRT Apartments | | Mortgage | 18.48 | 95 | -0.22% | -0.59% |
| ORI | Old Republic | | Insurance | 30.62 | 95 | -0.07% | 4.15% |
| IIF | Morgan Stanley | | Closed-End Fund - Foreign | 23.74 | 95 | -0.04% | 10.57% |
| SASR | Sandy Spring | | Regional Banks | 22.24 | 93 | 2.39% | -18.36% |
| PFS | Provident | | S&L | 15.57 | 93 | 2.30% | -13.64% |
| BANR | Banner | | Regional Banks | 46.24 | 93 | 2.14% | -13.67% |
| NTST | NetSTREIT | | REIT Retail | 17.36 | 93 | 1.58% | -2.80% |
| MPB | Mid Penn | | Regional Banks | 21.32 | 93 | 1.57% | -12.19% |
| CASH | Meta | | S&L | 52.93 | 93 | 1.52% | 0.00% |
| WAFD | Washington Federal | | S&L | 28.45 | 93 | 1.46% | -13.68% |
| NTRS | Northern Trust | | Asset Mgmt | 84.62 | 93 | 1.34% | 0.28% |
| TFC | Truist | | Regional Banks | 38.85 | 93 | 1.30% | 5.23% |
| TRST | TrustCo Bank | | Regional Banks | 27.93 | 93 | 1.16% | -10.05% |
| MS | Morgan Stanley | | Brokerage | 93.64 | 93 | 1.07% | 0.42% |
| NBHC | National Bank | | Regional Banks | 34.76 | 93 | 1.05% | -6.53% |
| TOWN | TowneBank | | Regional Banks | 27.30 | 93 | 1.00% | -8.27% |
| UNTY | Unity Bancorp | | Banks | 27.70 | 93 | 0.95% | -6.39% |
| CADE | Cadence Ban | | Regional Banks | 29.00 | 93 | 0.94% | -1.99% |
| VOYA | Voya | | Asset Mgmt | 70.75 | 93 | 0.93% | -3.03% |
| FRME | First Merchants | | Regional Banks | 34.69 | 93 | 0.87% | -6.45% |
| HOMB | Home Bancshares | | Banks | 24.62 | 93 | 0.86% | -2.80% |
| SYBT | Stock Yards | | Regional Banks | 46.97 | 93 | 0.73% | -8.78% |
| WASH | Washington Trust | | Regional Banks | 26.54 | 93 | 0.61% | -18.04% |
| For chart view version of above stock list: Chart View ➞ 0 - 25 , 25 - 50 , 50 - 75 , 75 - 100 , 100 - 125 , 125 - 150 , 150 - 175 , 175 - 200 , 200 - 225 , 225 - 250 , 250 - 275 , 275 - 300 , 300 - 325 , 325 - 350 , 350 - 375 , 375 - 400 , 400 - 425 , 425 - 450 , 450 - 475 , 475 - 500 , 500 - 525 , 525 - 550 , 550 - 575 , 575 - 600 , 600 - 625 , 625 - 650 , 650 - 675 , 675 - 700 , 700 - 725 , 725 - 750 , 750 - 775 , 775 - 800 , 800 - 825 , 825 - 850 , 850 - 875 , 875 - 900 , 900 - 925 , 925 - 950 , 950 - 975 , 975 - 1000 , 1000 - 1025 , 1025 - 1050 , 1050 - 1075 , 1075 - 1100 , 1100 - 1125 , 1125 - 1150 , 1150 - 1175 , 1175 - 1200 , 1200 - 1225 , 1225 - 1250 | ||
 | Click To Change The Sort Order: By Market Cap or Company Size Performance: Year-to-date, Week and Day |  |
|
Get the most comprehensive stock market coverage daily at 12Stocks.com ➞ Best Stocks Today ➞ Best Stocks Weekly ➞ Best Stocks Year-to-Date ➞ Best Stocks Trends ➞  Best Stocks Today 12Stocks.com Best Nasdaq Stocks ➞ Best S&P 500 Stocks ➞ Best Tech Stocks ➞ Best Biotech Stocks ➞ |
| Detailed Overview of Financial Stocks |
| Financial Technical Overview, Leaders & Laggards, Top Financial ETF Funds & Detailed Financial Stocks List, Charts, Trends & More |
| Financial Sector: Technical Analysis, Trends & YTD Performance | |
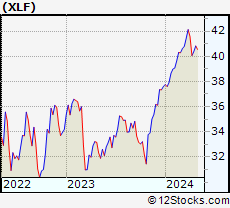
| Financial sector is composed of stocks
from banks, brokers, insurance, REITs
and services subsectors. Financial sector, as represented by XLF, an exchange-traded fund [ETF] that holds basket of Financial stocks (e.g, Bank of America, Goldman Sachs) is up by 7.85% and is currently outperforming the overall market by 0.97% year-to-date. Below is a quick view of Technical charts and trends: |
|
 XLF Weekly Chart |
|
| Long Term Trend: Good | |
| Medium Term Trend: Good | |
 XLF Daily Chart |
|
| Short Term Trend: Very Good | |
| Overall Trend Score: 53 | |
| YTD Performance: 7.85% | |
| **Trend Scores & Views Are Only For Educational Purposes And Not For Investing | |
| 12Stocks.com: Top Performing Financial Sector Stocks | ||||||||||||||||||||||||||||||||||||||||||||||||
 The top performing Financial sector stocks year to date are
Now, more recently, over last week, the top performing Financial sector stocks on the move are


|
||||||||||||||||||||||||||||||||||||||||||||||||
| 12Stocks.com: Investing in Financial Sector using Exchange Traded Funds | |
|
The following table shows list of key exchange traded funds (ETF) that
help investors track Financial Index. For detailed view, check out our ETF Funds section of our website. Quick View: Move mouse or cursor over ETF symbol (ticker) to view short-term Technical chart and over ETF name to view long term chart. Click on ticker or stock name for detailed view. Click on to add stock symbol to your watchlist and to view watchlist. |
12Stocks.com List of ETFs that track Financial Index
| Ticker | ETF Name | Watchlist | Recent Price | Smart Investing & Trading Score | Change % | Week % | Year-to-date % |
| XLF | Financial | | 40.55 | 53 | 0.22 | -0.66 | 7.85% |
| IAI | Broker-Dealers & Secs | | 114.27 | 95 | 0.98 | 1.11 | 5.29% |
| IYF | Financials | | 92.47 | 78 | 0.38 | 0.33 | 8.27% |
| IYG | Financial Services | | 64.09 | 60 | 0.31 | -0.8 | 7.29% |
| KRE | Regional Banking | | 49.65 | 100 | 1.29 | 3.03 | -5.3% |
| IXG | Global Financials | | 84.84 | 85 | 0.87 | 0.77 | 7.97% |
| VFH | Financials | | 98.70 | 73 | 0.34 | -0.23 | 6.98% |
| KBE | Bank | | 46.39 | 100 | 1.16 | 2.34 | 0.8% |
| FAS | Financial Bull 3X | | 98.83 | 60 | 0.95 | -1.79 | 19.58% |
| FAZ | Financial Bear 3X | | 11.08 | 17 | -0.89 | 2.03 | -18.95% |
| UYG | Financials | | 62.79 | 60 | 0.56 | -1.35 | 13.75% |
| IAT | Regional Banks | | 42.29 | 100 | 0.93 | 1.37 | 1.08% |
| KIE | Insurance | | 49.48 | 60 | 0.39 | 1.96 | 9.42% |
| PSCF | SmallCap Financials | | 47.28 | 100 | 0.77 | 1.98 | -3.86% |
| EUFN | Europe Financials | | 22.65 | 85 | 0.24 | 0.82 | 8.04% |
| PGF | Financial Preferred | | 14.85 | 64 | 1.43 | 1.92 | 1.85% |
| 12Stocks.com: Charts, Trends, Fundamental Data and Performances of Financial Stocks | |
|
We now take in-depth look at all Financial stocks including charts, multi-period performances and overall trends (as measured by Smart Investing & Trading Score). One can sort Financial stocks (click link to choose) by Daily, Weekly and by Year-to-Date performances. Also, one can sort by size of the company or by market capitalization. |
| Select Your Default Chart Type: | |||||
| |||||
| Click on stock symbol or name for detailed view. Click on to add stock symbol to your watchlist and to view watchlist. Quick View: Move mouse or cursor over "Daily" to quickly view daily Technical stock chart and over "Weekly" to view weekly Technical stock chart. | |||||

 | CAC Camden National Corporation |
| Sector: Financials | |
| SubSector: Regional - Northeast Banks | |
| MarketCap: 550.999 Millions | |
| Recent Price: 32.03 Smart Investing & Trading Score: 95 | |
| Day Percent Change: -0.31% Day Change: -0.10 | |
| Week Change: 5.02% Year-to-date Change: -14.9% | |
| CAC Links: Profile News Message Board | |
| Charts:- Daily , Weekly | |
| Add CAC to Watchlist: View: Get Complete CAC Trend Analysis ➞ | |
 | EQBK Equity Bancshares, Inc. |
| Sector: Financials | |
| SubSector: Regional - Midwest Banks | |
| MarketCap: 272.87 Millions | |
| Recent Price: 34.04 Smart Investing & Trading Score: 95 | |
| Day Percent Change: -0.29% Day Change: -0.10 | |
| Week Change: 2.19% Year-to-date Change: 0.4% | |
| EQBK Links: Profile News Message Board | |
| Charts:- Daily , Weekly | |
| Add EQBK to Watchlist: View: Get Complete EQBK Trend Analysis ➞ | |
 | BRT BRT Apartments Corp. |
| Sector: Financials | |
| SubSector: Mortgage Investment | |
| MarketCap: 163.239 Millions | |
| Recent Price: 18.48 Smart Investing & Trading Score: 95 | |
| Day Percent Change: -0.22% Day Change: -0.04 | |
| Week Change: 5.42% Year-to-date Change: -0.6% | |
| BRT Links: Profile News Message Board | |
| Charts:- Daily , Weekly | |
| Add BRT to Watchlist: View: Get Complete BRT Trend Analysis ➞ | |
 | ORI Old Republic International Corporation |
| Sector: Financials | |
| SubSector: Property & Casualty Insurance | |
| MarketCap: 4420.92 Millions | |
| Recent Price: 30.62 Smart Investing & Trading Score: 95 | |
| Day Percent Change: -0.07% Day Change: -0.02 | |
| Week Change: 1.63% Year-to-date Change: 4.2% | |
| ORI Links: Profile News Message Board | |
| Charts:- Daily , Weekly | |
| Add ORI to Watchlist: View: Get Complete ORI Trend Analysis ➞ | |
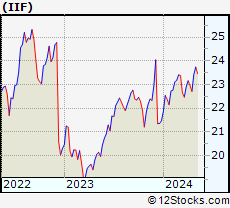 | IIF Morgan Stanley India Investment Fund, Inc. |
| Sector: Financials | |
| SubSector: Closed-End Fund - Foreign | |
| MarketCap: 166.247 Millions | |
| Recent Price: 23.74 Smart Investing & Trading Score: 95 | |
| Day Percent Change: -0.04% Day Change: -0.01 | |
| Week Change: 1.37% Year-to-date Change: 10.6% | |
| IIF Links: Profile News Message Board | |
| Charts:- Daily , Weekly | |
| Add IIF to Watchlist: View: Get Complete IIF Trend Analysis ➞ | |
 | SASR Sandy Spring Bancorp, Inc. |
| Sector: Financials | |
| SubSector: Regional - Mid-Atlantic Banks | |
| MarketCap: 764.659 Millions | |
| Recent Price: 22.24 Smart Investing & Trading Score: 93 | |
| Day Percent Change: 2.39% Day Change: 0.52 | |
| Week Change: 3.49% Year-to-date Change: -18.4% | |
| SASR Links: Profile News Message Board | |
| Charts:- Daily , Weekly | |
| Add SASR to Watchlist: View: Get Complete SASR Trend Analysis ➞ | |
 | PFS Provident Financial Services, Inc. |
| Sector: Financials | |
| SubSector: Savings & Loans | |
| MarketCap: 829.73 Millions | |
| Recent Price: 15.57 Smart Investing & Trading Score: 93 | |
| Day Percent Change: 2.30% Day Change: 0.35 | |
| Week Change: 3.18% Year-to-date Change: -13.6% | |
| PFS Links: Profile News Message Board | |
| Charts:- Daily , Weekly | |
| Add PFS to Watchlist: View: Get Complete PFS Trend Analysis ➞ | |
 | BANR Banner Corporation |
| Sector: Financials | |
| SubSector: Regional - Mid-Atlantic Banks | |
| MarketCap: 1187.09 Millions | |
| Recent Price: 46.24 Smart Investing & Trading Score: 93 | |
| Day Percent Change: 2.14% Day Change: 0.97 | |
| Week Change: 1.94% Year-to-date Change: -13.7% | |
| BANR Links: Profile News Message Board | |
| Charts:- Daily , Weekly | |
| Add BANR to Watchlist: View: Get Complete BANR Trend Analysis ➞ | |
 | NTST NetSTREIT Corp. |
| Sector: Financials | |
| SubSector: REIT Retail | |
| MarketCap: 51267 Millions | |
| Recent Price: 17.36 Smart Investing & Trading Score: 93 | |
| Day Percent Change: 1.58% Day Change: 0.27 | |
| Week Change: 2.12% Year-to-date Change: -2.8% | |
| NTST Links: Profile News Message Board | |
| Charts:- Daily , Weekly | |
| Add NTST to Watchlist: View: Get Complete NTST Trend Analysis ➞ | |
 | MPB Mid Penn Bancorp, Inc. |
| Sector: Financials | |
| SubSector: Regional - Northeast Banks | |
| MarketCap: 187.699 Millions | |
| Recent Price: 21.32 Smart Investing & Trading Score: 93 | |
| Day Percent Change: 1.57% Day Change: 0.33 | |
| Week Change: 2.21% Year-to-date Change: -12.2% | |
| MPB Links: Profile News Message Board | |
| Charts:- Daily , Weekly | |
| Add MPB to Watchlist: View: Get Complete MPB Trend Analysis ➞ | |
 | CASH Meta Financial Group, Inc. |
| Sector: Financials | |
| SubSector: Savings & Loans | |
| MarketCap: 849.33 Millions | |
| Recent Price: 52.93 Smart Investing & Trading Score: 93 | |
| Day Percent Change: 1.52% Day Change: 0.79 | |
| Week Change: 1.52% Year-to-date Change: 0.0% | |
| CASH Links: Profile News Message Board | |
| Charts:- Daily , Weekly | |
| Add CASH to Watchlist: View: Get Complete CASH Trend Analysis ➞ | |
 | WAFD Washington Federal, Inc. |
| Sector: Financials | |
| SubSector: Savings & Loans | |
| MarketCap: 2219.2 Millions | |
| Recent Price: 28.45 Smart Investing & Trading Score: 93 | |
| Day Percent Change: 1.46% Day Change: 0.41 | |
| Week Change: 1.93% Year-to-date Change: -13.7% | |
| WAFD Links: Profile News Message Board | |
| Charts:- Daily , Weekly | |
| Add WAFD to Watchlist: View: Get Complete WAFD Trend Analysis ➞ | |
 | NTRS Northern Trust Corporation |
| Sector: Financials | |
| SubSector: Asset Management | |
| MarketCap: 15316.8 Millions | |
| Recent Price: 84.62 Smart Investing & Trading Score: 93 | |
| Day Percent Change: 1.34% Day Change: 1.12 | |
| Week Change: 1.49% Year-to-date Change: 0.3% | |
| NTRS Links: Profile News Message Board | |
| Charts:- Daily , Weekly | |
| Add NTRS to Watchlist: View: Get Complete NTRS Trend Analysis ➞ | |
 | TFC Truist Financial Corporation |
| Sector: Financials | |
| SubSector: Regional - Southeast Banks | |
| MarketCap: 44928.5 Millions | |
| Recent Price: 38.85 Smart Investing & Trading Score: 93 | |
| Day Percent Change: 1.30% Day Change: 0.50 | |
| Week Change: 1.78% Year-to-date Change: 5.2% | |
| TFC Links: Profile News Message Board | |
| Charts:- Daily , Weekly | |
| Add TFC to Watchlist: View: Get Complete TFC Trend Analysis ➞ | |
 | TRST TrustCo Bank Corp NY |
| Sector: Financials | |
| SubSector: Regional - Northeast Banks | |
| MarketCap: 543.999 Millions | |
| Recent Price: 27.93 Smart Investing & Trading Score: 93 | |
| Day Percent Change: 1.16% Day Change: 0.32 | |
| Week Change: 3.14% Year-to-date Change: -10.1% | |
| TRST Links: Profile News Message Board | |
| Charts:- Daily , Weekly | |
| Add TRST to Watchlist: View: Get Complete TRST Trend Analysis ➞ | |
 | MS Morgan Stanley |
| Sector: Financials | |
| SubSector: Investment Brokerage - National | |
| MarketCap: 55876.7 Millions | |
| Recent Price: 93.64 Smart Investing & Trading Score: 93 | |
| Day Percent Change: 1.07% Day Change: 0.99 | |
| Week Change: 0.87% Year-to-date Change: 0.4% | |
| MS Links: Profile News Message Board | |
| Charts:- Daily , Weekly | |
| Add MS to Watchlist: View: Get Complete MS Trend Analysis ➞ | |
 | NBHC National Bank Holdings Corporation |
| Sector: Financials | |
| SubSector: Regional - Midwest Banks | |
| MarketCap: 766.87 Millions | |
| Recent Price: 34.76 Smart Investing & Trading Score: 93 | |
| Day Percent Change: 1.05% Day Change: 0.36 | |
| Week Change: 3.76% Year-to-date Change: -6.5% | |
| NBHC Links: Profile News Message Board | |
| Charts:- Daily , Weekly | |
| Add NBHC to Watchlist: View: Get Complete NBHC Trend Analysis ➞ | |
 | TOWN TowneBank |
| Sector: Financials | |
| SubSector: Regional - Mid-Atlantic Banks | |
| MarketCap: 1344.09 Millions | |
| Recent Price: 27.30 Smart Investing & Trading Score: 93 | |
| Day Percent Change: 1.00% Day Change: 0.27 | |
| Week Change: 1.41% Year-to-date Change: -8.3% | |
| TOWN Links: Profile News Message Board | |
| Charts:- Daily , Weekly | |
| Add TOWN to Watchlist: View: Get Complete TOWN Trend Analysis ➞ | |
 | UNTY Unity Bancorp, Inc. |
| Sector: Financials | |
| SubSector: Money Center Banks | |
| MarketCap: 149.099 Millions | |
| Recent Price: 27.70 Smart Investing & Trading Score: 93 | |
| Day Percent Change: 0.95% Day Change: 0.26 | |
| Week Change: 0.29% Year-to-date Change: -6.4% | |
| UNTY Links: Profile News Message Board | |
| Charts:- Daily , Weekly | |
| Add UNTY to Watchlist: View: Get Complete UNTY Trend Analysis ➞ | |
 | CADE Cadence Bancorporation |
| Sector: Financials | |
| SubSector: Regional - Southeast Banks | |
| MarketCap: 756.335 Millions | |
| Recent Price: 29.00 Smart Investing & Trading Score: 93 | |
| Day Percent Change: 0.94% Day Change: 0.27 | |
| Week Change: -0.07% Year-to-date Change: -2.0% | |
| CADE Links: Profile News Message Board | |
| Charts:- Daily , Weekly | |
| Add CADE to Watchlist: View: Get Complete CADE Trend Analysis ➞ | |
 | VOYA Voya Financial, Inc. |
| Sector: Financials | |
| SubSector: Asset Management | |
| MarketCap: 4771.23 Millions | |
| Recent Price: 70.75 Smart Investing & Trading Score: 93 | |
| Day Percent Change: 0.93% Day Change: 0.65 | |
| Week Change: 3.51% Year-to-date Change: -3.0% | |
| VOYA Links: Profile News Message Board | |
| Charts:- Daily , Weekly | |
| Add VOYA to Watchlist: View: Get Complete VOYA Trend Analysis ➞ | |
 | FRME First Merchants Corporation |
| Sector: Financials | |
| SubSector: Regional - Midwest Banks | |
| MarketCap: 1490.4 Millions | |
| Recent Price: 34.69 Smart Investing & Trading Score: 93 | |
| Day Percent Change: 0.87% Day Change: 0.30 | |
| Week Change: 1.64% Year-to-date Change: -6.5% | |
| FRME Links: Profile News Message Board | |
| Charts:- Daily , Weekly | |
| Add FRME to Watchlist: View: Get Complete FRME Trend Analysis ➞ | |
 | HOMB Home Bancshares, Inc. (Conway, AR) |
| Sector: Financials | |
| SubSector: Money Center Banks | |
| MarketCap: 2090.49 Millions | |
| Recent Price: 24.62 Smart Investing & Trading Score: 93 | |
| Day Percent Change: 0.86% Day Change: 0.21 | |
| Week Change: 0.82% Year-to-date Change: -2.8% | |
| HOMB Links: Profile News Message Board | |
| Charts:- Daily , Weekly | |
| Add HOMB to Watchlist: View: Get Complete HOMB Trend Analysis ➞ | |
 | SYBT Stock Yards Bancorp, Inc. |
| Sector: Financials | |
| SubSector: Regional - Southeast Banks | |
| MarketCap: 629.235 Millions | |
| Recent Price: 46.97 Smart Investing & Trading Score: 93 | |
| Day Percent Change: 0.73% Day Change: 0.34 | |
| Week Change: 1.78% Year-to-date Change: -8.8% | |
| SYBT Links: Profile News Message Board | |
| Charts:- Daily , Weekly | |
| Add SYBT to Watchlist: View: Get Complete SYBT Trend Analysis ➞ | |
 | WASH Washington Trust Bancorp, Inc. |
| Sector: Financials | |
| SubSector: Regional - Northeast Banks | |
| MarketCap: 590.099 Millions | |
| Recent Price: 26.54 Smart Investing & Trading Score: 93 | |
| Day Percent Change: 0.61% Day Change: 0.16 | |
| Week Change: 1.53% Year-to-date Change: -18.0% | |
| WASH Links: Profile News Message Board | |
| Charts:- Daily , Weekly | |
| Add WASH to Watchlist: View: Get Complete WASH Trend Analysis ➞ | |
| For tabular summary view of above stock list: Summary View ➞ 0 - 25 , 25 - 50 , 50 - 75 , 75 - 100 , 100 - 125 , 125 - 150 , 150 - 175 , 175 - 200 , 200 - 225 , 225 - 250 , 250 - 275 , 275 - 300 , 300 - 325 , 325 - 350 , 350 - 375 , 375 - 400 , 400 - 425 , 425 - 450 , 450 - 475 , 475 - 500 , 500 - 525 , 525 - 550 , 550 - 575 , 575 - 600 , 600 - 625 , 625 - 650 , 650 - 675 , 675 - 700 , 700 - 725 , 725 - 750 , 750 - 775 , 775 - 800 , 800 - 825 , 825 - 850 , 850 - 875 , 875 - 900 , 900 - 925 , 925 - 950 , 950 - 975 , 975 - 1000 , 1000 - 1025 , 1025 - 1050 , 1050 - 1075 , 1075 - 1100 , 1100 - 1125 , 1125 - 1150 , 1150 - 1175 , 1175 - 1200 , 1200 - 1225 , 1225 - 1250 | ||
| Click To Change The Sort Order: By Market Cap or Company Size Performance: Year-to-date, Week and Day | |
| Select Chart Type: | ||
|
Best Stocks Today 12Stocks.com |
© 2024 12Stocks.com Terms & Conditions Privacy Contact Us
All Information Provided Only For Education And Not To Be Used For Investing or Trading. See Terms & Conditions


One More Thing ... Get Best Stocks Delivered Daily!
Never Ever Miss A Move With Our Top Ten Stocks Lists
Find Best Stocks In Any Market - Bull or Bear Market
Take A Peek At Our Top Ten Stocks Lists: Daily, Weekly, Year-to-Date & Top Trends
Find Best Stocks In Any Market - Bull or Bear Market
Take A Peek At Our Top Ten Stocks Lists: Daily, Weekly, Year-to-Date & Top Trends
Financial Stocks With Best Up Trends [0-bearish to 100-bullish]: Siebert [100], Office Properties[100], Banco BBVA[100], AG Mortgage[100], Grupo Financiero[100], Banco Macro[100], Global X[100], Grupo Supervielle[100], Reinsurance [100], Camden Property[100], Noah [100]
Best Financial Stocks Year-to-Date:
Root [436.68%], Banco Macro[109.83%], Hippo [103.4%], Gladstone Capital[100.28%], Grupo Financiero[98.78%], Banco BBVA[92.83%], EverQuote [77.7%], Grupo Supervielle[69.21%], Yiren Digital[66.99%], LendingTree [62.96%], Lufax Holding[53.09%] Best Financial Stocks This Week:
Office Properties[42.79%], LendingTree [30.37%], SelectQuote [26.71%], Heartland [23.01%], Industrial Logistics[20.39%], New York[18.86%], KE [17.8%], Banco Macro[17.21%], Douglas Elliman[16.39%], Siebert [14.85%], eXp World[14.82%] Best Financial Stocks Daily:
Siebert [17.17%], SelectQuote [13.33%], Office Properties[12.11%], Banco BBVA[9.27%], Oportun [9.01%], AG Mortgage[8.85%], Diversified Healthcare[8.26%], RE/MAX [7.68%], Grupo Financiero[7.62%], Banco Macro[7.32%], Xenia Hotels[7.01%]