
 Login Sign Up


| |||||
 |  | ||||

| 12Stocks.com Market Intelligence |
Best Financial Stocks
| In a hurry? Financial Stocks Lists: Performance Trends Table, Stock Charts
Sort Financial stocks: Daily, Weekly, Year-to-Date, Market Cap & Trends. Filter Financial stocks list by size:All Financial Large Mid-Range Small & MicroCap |
| 12Stocks.com Financial Stocks Performances & Trends Daily | |||||||||
|
|  The overall Smart Investing & Trading Score is 21 (0-bearish to 100-bullish) which puts Financial sector in short term bearish to neutral trend. The Smart Investing & Trading Score from previous trading session is 39 and hence a deterioration of trend.
| ||||||||
Here are the Smart Investing & Trading Scores of the most requested Financial stocks at 12Stocks.com (click stock name for detailed review):
|


| 12Stocks.com: Investing in Financial sector with Stocks | |
|
The following table helps investors and traders sort through current performance and trends (as measured by Smart Investing & Trading Score) of various
stocks in the Financial sector. Quick View: Move mouse or cursor over stock symbol (ticker) to view short-term Technical chart and over stock name to view long term chart. Click on  to add stock symbol to your watchlist and to add stock symbol to your watchlist and  to view watchlist. Click on any ticker or stock name for detailed market intelligence report for that stock. to view watchlist. Click on any ticker or stock name for detailed market intelligence report for that stock. |
12Stocks.com Performance of Stocks in Financial Sector
| Ticker | Stock Name | Watchlist | Category | Recent Price | Trend Score | Change % | YTD Change% |
| THQ | Tekla Healthcare |   | Closed-End Fund - Equity | 19.73 | 87 | 0.71% | 8.95% |
| DCOM | Dime Community | | S&L | 18.96 | 86 | 4.18% | -29.60% |
| WASH | Washington Trust | | Regional Banks | 26.20 | 86 | 2.91% | -19.09% |
| WABC | Westamerica Ban | | Regional Banks | 47.67 | 86 | 2.41% | -15.49% |
| FRME | First Merchants | | Regional Banks | 34.19 | 86 | 2.30% | -7.79% |
| CBH | AllianzGI Convertible | | Asset Mgmt | 8.90 | 86 | 0.11% | 2.06% |
| HAFC | Hanmi | | Regional Banks | 15.70 | 85 | 2.61% | -19.07% |
| RGA | Reinsurance | | Life Insurance | 190.92 | 85 | 2.10% | 18.01% |
| ATLO | Ames National | | Regional Banks | 19.59 | 85 | 1.77% | -8.20% |
| PRU | Prudential | | Life Insurance | 112.30 | 85 | 1.65% | 8.28% |
| OFG | OFG Bancorp | | Banks | 36.70 | 85 | 1.63% | -2.08% |
| GLAD | Gladstone Capital | | Closed-End Fund - Debt | 21.77 | 85 | 1.63% | 103.46% |
| ONB | Old National | | Regional Banks | 16.77 | 85 | 1.39% | -0.71% |
| MET | MetLife | | Life Insurance | 71.88 | 85 | 1.13% | 8.69% |
| CLM | Cornerstone Strategic | | Asset Mgmt | 7.44 | 85 | 0.95% | 3.48% |
| ALL | Allstate | | Insurance | 171.56 | 85 | 0.88% | 22.56% |
| MSOS | AdvisorShares Pure | | Exchange Traded Fund | 9.57 | 85 | -15.01% | 36.71% |
| L | Loews | | Insurance | 76.28 | 83 | 1.50% | 9.61% |
| FOF | Cohen & Steers Closed-End Opportunity Fund | | Closed-End Fund - Equity | 11.45 | 83 | 0.88% | 2.23% |
| AFG | American | | Insurance | 128.74 | 83 | 0.77% | 8.28% |
| PRA | ProAssurance | | Insurance | 13.38 | 83 | 0.15% | -2.97% |
| VEL | Velocity | | Mortgage Finance | 17.15 | 83 | 0.00% | 3.19% |
| HIW | Highwoods Properties | | REIT - Office | 25.89 | 83 | -1.18% | 12.76% |
| BEKE | KE | | Real Estate Services | 14.95 | 83 | -1.12% | -7.77% |
| UMH | UMH Properties | | REIT - | 15.80 | 83 | -0.75% | 3.13% |
| For chart view version of above stock list: Chart View ➞ 0 - 25 , 25 - 50 , 50 - 75 , 75 - 100 , 100 - 125 , 125 - 150 , 150 - 175 , 175 - 200 , 200 - 225 , 225 - 250 , 250 - 275 , 275 - 300 , 300 - 325 , 325 - 350 , 350 - 375 , 375 - 400 , 400 - 425 , 425 - 450 , 450 - 475 , 475 - 500 , 500 - 525 , 525 - 550 , 550 - 575 , 575 - 600 , 600 - 625 , 625 - 650 , 650 - 675 , 675 - 700 , 700 - 725 , 725 - 750 , 750 - 775 , 775 - 800 , 800 - 825 , 825 - 850 , 850 - 875 , 875 - 900 , 900 - 925 , 925 - 950 , 950 - 975 , 975 - 1000 , 1000 - 1025 , 1025 - 1050 , 1050 - 1075 , 1075 - 1100 , 1100 - 1125 , 1125 - 1150 , 1150 - 1175 , 1175 - 1200 , 1200 - 1225 , 1225 - 1250 | ||
 | Click To Change The Sort Order: By Market Cap or Company Size Performance: Year-to-date, Week and Day |  |
|
Get the most comprehensive stock market coverage daily at 12Stocks.com ➞ Best Stocks Today ➞ Best Stocks Weekly ➞ Best Stocks Year-to-Date ➞ Best Stocks Trends ➞  Best Stocks Today 12Stocks.com Best Nasdaq Stocks ➞ Best S&P 500 Stocks ➞ Best Tech Stocks ➞ Best Biotech Stocks ➞ |
| Detailed Overview of Financial Stocks |
| Financial Technical Overview, Leaders & Laggards, Top Financial ETF Funds & Detailed Financial Stocks List, Charts, Trends & More |
| Financial Sector: Technical Analysis, Trends & YTD Performance | |
| Financial sector is composed of stocks
from banks, brokers, insurance, REITs
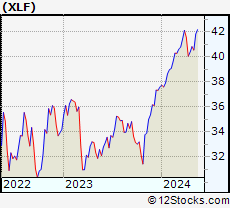
and services subsectors. Financial sector, as represented by XLF, an exchange-traded fund [ETF] that holds basket of Financial stocks (e.g, Bank of America, Goldman Sachs) is up by 7.34% and is currently outperforming the overall market by 2.8% year-to-date. Below is a quick view of Technical charts and trends: |
|
 XLF Weekly Chart |
|
| Long Term Trend: Good | |
| Medium Term Trend: Good | |
 XLF Daily Chart |
|
| Short Term Trend: Not Good | |
| Overall Trend Score: 21 | |
| YTD Performance: 7.34% | |
| **Trend Scores & Views Are Only For Educational Purposes And Not For Investing | |
| 12Stocks.com: Top Performing Financial Sector Stocks | ||||||||||||||||||||||||||||||||||||||||||||||||
 The top performing Financial sector stocks year to date are
Now, more recently, over last week, the top performing Financial sector stocks on the move are


|
||||||||||||||||||||||||||||||||||||||||||||||||
| 12Stocks.com: Investing in Financial Sector using Exchange Traded Funds | |
|
The following table shows list of key exchange traded funds (ETF) that
help investors track Financial Index. For detailed view, check out our ETF Funds section of our website. Quick View: Move mouse or cursor over ETF symbol (ticker) to view short-term Technical chart and over ETF name to view long term chart. Click on ticker or stock name for detailed view. Click on to add stock symbol to your watchlist and to view watchlist. |
12Stocks.com List of ETFs that track Financial Index
| Ticker | ETF Name | Watchlist | Recent Price | Smart Investing & Trading Score | Change % | Week % | Year-to-date % |
| XLF | Financial | | 40.36 | 21 | 0.00 | -1.13 | 7.34% |
| IAI | Broker-Dealers & Secs | | 112.07 | 65 | 0.63 | -0.83 | 3.26% |
| IYF | Financials | | 91.67 | 43 | 0.57 | -0.54 | 7.33% |
| IYG | Financial Services | | 63.54 | 21 | 0.08 | -1.66 | 6.37% |
| KRE | Regional Banking | | 48.23 | 73 | 2.57 | 0.08 | -8.01% |
| IXG | Global Financials | | 83.60 | 49 | -0.24 | -0.7 | 6.39% |
| VFH | Financials | | 97.76 | 21 | 0.10 | -1.18 | 5.96% |
| KBE | Bank | | 45.27 | 88 | 2.14 | -0.13 | -1.63% |
| FAS | Financial Bull 3X | | 97.30 | 15 | -0.12 | -3.31 | 17.73% |
| FAZ | Financial Bear 3X | | 11.26 | 49 | 0.09 | 3.68 | -17.63% |
| UYG | Financials | | 62.15 | 28 | -0.10 | -2.36 | 12.59% |
| IAT | Regional Banks | | 41.50 | 71 | 1.49 | -0.53 | -0.81% |
| KIE | Insurance | | 49.15 | 54 | 1.17 | 1.28 | 8.69% |
| PSCF | SmallCap Financials | | 46.24 | 63 | 0.99 | -0.25 | -5.97% |
| EUFN | Europe Financials | | 22.23 | 41 | -0.09 | -1.02 | 6.06% |
| PGF | Financial Preferred | | 14.60 | 25 | 0.76 | 0.21 | 0.14% |
| 12Stocks.com: Charts, Trends, Fundamental Data and Performances of Financial Stocks | |
|
We now take in-depth look at all Financial stocks including charts, multi-period performances and overall trends (as measured by Smart Investing & Trading Score). One can sort Financial stocks (click link to choose) by Daily, Weekly and by Year-to-Date performances. Also, one can sort by size of the company or by market capitalization. |
| Select Your Default Chart Type: | |||||
| |||||
| Click on stock symbol or name for detailed view. Click on to add stock symbol to your watchlist and to view watchlist. Quick View: Move mouse or cursor over "Daily" to quickly view daily Technical stock chart and over "Weekly" to view weekly Technical stock chart. | |||||

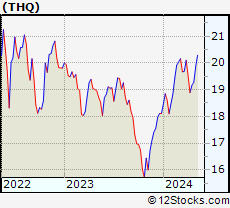 | THQ Tekla Healthcare Opportunities Fund |
| Sector: Financials | |
| SubSector: Closed-End Fund - Equity | |
| MarketCap: 518.247 Millions | |
| Recent Price: 19.73 Smart Investing & Trading Score: 87 | |
| Day Percent Change: 0.71% Day Change: 0.14 | |
| Week Change: 2.33% Year-to-date Change: 9.0% | |
| THQ Links: Profile News Message Board | |
| Charts:- Daily , Weekly | |
| Add THQ to Watchlist: View: Get Complete THQ Trend Analysis ➞ | |
 | DCOM Dime Community Bancshares, Inc. |
| Sector: Financials | |
| SubSector: Savings & Loans | |
| MarketCap: 477.83 Millions | |
| Recent Price: 18.96 Smart Investing & Trading Score: 86 | |
| Day Percent Change: 4.18% Day Change: 0.76 | |
| Week Change: -0.63% Year-to-date Change: -29.6% | |
| DCOM Links: Profile News Message Board | |
| Charts:- Daily , Weekly | |
| Add DCOM to Watchlist: View: Get Complete DCOM Trend Analysis ➞ | |
 | WASH Washington Trust Bancorp, Inc. |
| Sector: Financials | |
| SubSector: Regional - Northeast Banks | |
| MarketCap: 590.099 Millions | |
| Recent Price: 26.20 Smart Investing & Trading Score: 86 | |
| Day Percent Change: 2.91% Day Change: 0.74 | |
| Week Change: 0.23% Year-to-date Change: -19.1% | |
| WASH Links: Profile News Message Board | |
| Charts:- Daily , Weekly | |
| Add WASH to Watchlist: View: Get Complete WASH Trend Analysis ➞ | |
 | WABC Westamerica Bancorporation |
| Sector: Financials | |
| SubSector: Regional - Pacific Banks | |
| MarketCap: 1557.69 Millions | |
| Recent Price: 47.67 Smart Investing & Trading Score: 86 | |
| Day Percent Change: 2.41% Day Change: 1.12 | |
| Week Change: 0.48% Year-to-date Change: -15.5% | |
| WABC Links: Profile News Message Board | |
| Charts:- Daily , Weekly | |
| Add WABC to Watchlist: View: Get Complete WABC Trend Analysis ➞ | |
 | FRME First Merchants Corporation |
| Sector: Financials | |
| SubSector: Regional - Midwest Banks | |
| MarketCap: 1490.4 Millions | |
| Recent Price: 34.19 Smart Investing & Trading Score: 86 | |
| Day Percent Change: 2.30% Day Change: 0.77 | |
| Week Change: 0.18% Year-to-date Change: -7.8% | |
| FRME Links: Profile News Message Board | |
| Charts:- Daily , Weekly | |
| Add FRME to Watchlist: View: Get Complete FRME Trend Analysis ➞ | |
 | CBH AllianzGI Convertible & Income 2024 Target Term Fund |
| Sector: Financials | |
| SubSector: Asset Management | |
| MarketCap: 131.403 Millions | |
| Recent Price: 8.90 Smart Investing & Trading Score: 86 | |
| Day Percent Change: 0.11% Day Change: 0.01 | |
| Week Change: -0.34% Year-to-date Change: 2.1% | |
| CBH Links: Profile News Message Board | |
| Charts:- Daily , Weekly | |
| Add CBH to Watchlist: View: Get Complete CBH Trend Analysis ➞ | |
 | HAFC Hanmi Financial Corporation |
| Sector: Financials | |
| SubSector: Regional - Pacific Banks | |
| MarketCap: 319.929 Millions | |
| Recent Price: 15.70 Smart Investing & Trading Score: 85 | |
| Day Percent Change: 2.61% Day Change: 0.40 | |
| Week Change: -0.76% Year-to-date Change: -19.1% | |
| HAFC Links: Profile News Message Board | |
| Charts:- Daily , Weekly | |
| Add HAFC to Watchlist: View: Get Complete HAFC Trend Analysis ➞ | |
 | RGA Reinsurance Group of America, Incorporated |
| Sector: Financials | |
| SubSector: Life Insurance | |
| MarketCap: 4423.36 Millions | |
| Recent Price: 190.92 Smart Investing & Trading Score: 85 | |
| Day Percent Change: 2.10% Day Change: 3.93 | |
| Week Change: 1.13% Year-to-date Change: 18.0% | |
| RGA Links: Profile News Message Board | |
| Charts:- Daily , Weekly | |
| Add RGA to Watchlist: View: Get Complete RGA Trend Analysis ➞ | |
 | ATLO Ames National Corporation |
| Sector: Financials | |
| SubSector: Regional - Northeast Banks | |
| MarketCap: 195.999 Millions | |
| Recent Price: 19.59 Smart Investing & Trading Score: 85 | |
| Day Percent Change: 1.77% Day Change: 0.34 | |
| Week Change: -0.76% Year-to-date Change: -8.2% | |
| ATLO Links: Profile News Message Board | |
| Charts:- Daily , Weekly | |
| Add ATLO to Watchlist: View: Get Complete ATLO Trend Analysis ➞ | |
 | PRU Prudential Financial, Inc. |
| Sector: Financials | |
| SubSector: Life Insurance | |
| MarketCap: 21001.6 Millions | |
| Recent Price: 112.30 Smart Investing & Trading Score: 85 | |
| Day Percent Change: 1.65% Day Change: 1.82 | |
| Week Change: 1.63% Year-to-date Change: 8.3% | |
| PRU Links: Profile News Message Board | |
| Charts:- Daily , Weekly | |
| Add PRU to Watchlist: View: Get Complete PRU Trend Analysis ➞ | |
 | OFG OFG Bancorp |
| Sector: Financials | |
| SubSector: Money Center Banks | |
| MarketCap: 537.599 Millions | |
| Recent Price: 36.70 Smart Investing & Trading Score: 85 | |
| Day Percent Change: 1.63% Day Change: 0.59 | |
| Week Change: 1.1% Year-to-date Change: -2.1% | |
| OFG Links: Profile News Message Board | |
| Charts:- Daily , Weekly | |
| Add OFG to Watchlist: View: Get Complete OFG Trend Analysis ➞ | |
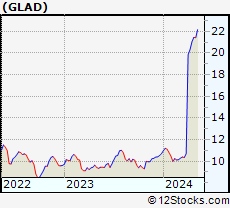 | GLAD Gladstone Capital Corporation |
| Sector: Financials | |
| SubSector: Closed-End Fund - Debt | |
| MarketCap: 174.807 Millions | |
| Recent Price: 21.77 Smart Investing & Trading Score: 85 | |
| Day Percent Change: 1.63% Day Change: 0.35 | |
| Week Change: 1.49% Year-to-date Change: 103.5% | |
| GLAD Links: Profile News Message Board | |
| Charts:- Daily , Weekly | |
| Add GLAD to Watchlist: View: Get Complete GLAD Trend Analysis ➞ | |
 | ONB Old National Bancorp |
| Sector: Financials | |
| SubSector: Regional - Midwest Banks | |
| MarketCap: 2340.8 Millions | |
| Recent Price: 16.77 Smart Investing & Trading Score: 85 | |
| Day Percent Change: 1.39% Day Change: 0.23 | |
| Week Change: 1.21% Year-to-date Change: -0.7% | |
| ONB Links: Profile News Message Board | |
| Charts:- Daily , Weekly | |
| Add ONB to Watchlist: View: Get Complete ONB Trend Analysis ➞ | |
 | MET MetLife, Inc. |
| Sector: Financials | |
| SubSector: Life Insurance | |
| MarketCap: 26272.9 Millions | |
| Recent Price: 71.88 Smart Investing & Trading Score: 85 | |
| Day Percent Change: 1.13% Day Change: 0.80 | |
| Week Change: 2.07% Year-to-date Change: 8.7% | |
| MET Links: Profile News Message Board | |
| Charts:- Daily , Weekly | |
| Add MET to Watchlist: View: Get Complete MET Trend Analysis ➞ | |
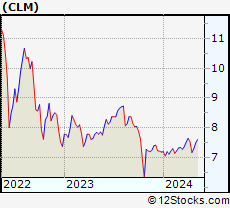 | CLM Cornerstone Strategic Value Fund, Inc. |
| Sector: Financials | |
| SubSector: Asset Management | |
| MarketCap: 512.703 Millions | |
| Recent Price: 7.44 Smart Investing & Trading Score: 85 | |
| Day Percent Change: 0.95% Day Change: 0.07 | |
| Week Change: 1.92% Year-to-date Change: 3.5% | |
| CLM Links: Profile News Message Board | |
| Charts:- Daily , Weekly | |
| Add CLM to Watchlist: View: Get Complete CLM Trend Analysis ➞ | |
 | ALL The Allstate Corporation |
| Sector: Financials | |
| SubSector: Property & Casualty Insurance | |
| MarketCap: 25916.6 Millions | |
| Recent Price: 171.56 Smart Investing & Trading Score: 85 | |
| Day Percent Change: 0.88% Day Change: 1.50 | |
| Week Change: 0.88% Year-to-date Change: 22.6% | |
| ALL Links: Profile News Message Board | |
| Charts:- Daily , Weekly | |
| Add ALL to Watchlist: View: Get Complete ALL Trend Analysis ➞ | |
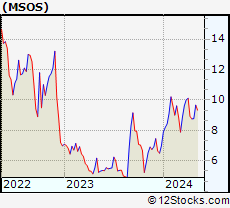 | MSOS AdvisorShares Pure US Cannabis ETF |
| Sector: Financials | |
| SubSector: Exchange Traded Fund | |
| MarketCap: 60157 Millions | |
| Recent Price: 9.57 Smart Investing & Trading Score: 85 | |
| Day Percent Change: -15.01% Day Change: -1.69 | |
| Week Change: 9% Year-to-date Change: 36.7% | |
| MSOS Links: Profile News Message Board | |
| Charts:- Daily , Weekly | |
| Add MSOS to Watchlist: View: Get Complete MSOS Trend Analysis ➞ | |
 | L Loews Corporation |
| Sector: Financials | |
| SubSector: Property & Casualty Insurance | |
| MarketCap: 10768.2 Millions | |
| Recent Price: 76.28 Smart Investing & Trading Score: 83 | |
| Day Percent Change: 1.50% Day Change: 1.13 | |
| Week Change: 1.09% Year-to-date Change: 9.6% | |
| L Links: Profile News Message Board | |
| Charts:- Daily , Weekly | |
| Add L to Watchlist: View: Get Complete L Trend Analysis ➞ | |
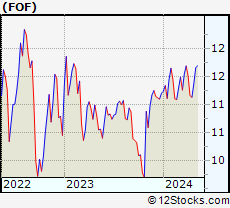 | FOF Cohen & Steers Closed-End Opportunity Fund, Inc. |
| Sector: Financials | |
| SubSector: Closed-End Fund - Equity | |
| MarketCap: 199.747 Millions | |
| Recent Price: 11.45 Smart Investing & Trading Score: 83 | |
| Day Percent Change: 0.88% Day Change: 0.10 | |
| Week Change: 0.7% Year-to-date Change: 2.2% | |
| FOF Links: Profile News Message Board | |
| Charts:- Daily , Weekly | |
| Add FOF to Watchlist: View: Get Complete FOF Trend Analysis ➞ | |
 | AFG American Financial Group, Inc. |
| Sector: Financials | |
| SubSector: Property & Casualty Insurance | |
| MarketCap: 5353.82 Millions | |
| Recent Price: 128.74 Smart Investing & Trading Score: 83 | |
| Day Percent Change: 0.77% Day Change: 0.99 | |
| Week Change: 1.1% Year-to-date Change: 8.3% | |
| AFG Links: Profile News Message Board | |
| Charts:- Daily , Weekly | |
| Add AFG to Watchlist: View: Get Complete AFG Trend Analysis ➞ | |
 | PRA ProAssurance Corporation |
| Sector: Financials | |
| SubSector: Accident & Health Insurance | |
| MarketCap: 1434.6 Millions | |
| Recent Price: 13.38 Smart Investing & Trading Score: 83 | |
| Day Percent Change: 0.15% Day Change: 0.02 | |
| Week Change: 1.59% Year-to-date Change: -3.0% | |
| PRA Links: Profile News Message Board | |
| Charts:- Daily , Weekly | |
| Add PRA to Watchlist: View: Get Complete PRA Trend Analysis ➞ | |
 | VEL Velocity Financial, Inc. |
| Sector: Financials | |
| SubSector: Mortgage Finance | |
| MarketCap: 12157 Millions | |
| Recent Price: 17.15 Smart Investing & Trading Score: 83 | |
| Day Percent Change: 0.00% Day Change: 0.00 | |
| Week Change: 0.82% Year-to-date Change: 3.2% | |
| VEL Links: Profile News Message Board | |
| Charts:- Daily , Weekly | |
| Add VEL to Watchlist: View: Get Complete VEL Trend Analysis ➞ | |
 | HIW Highwoods Properties, Inc. |
| Sector: Financials | |
| SubSector: REIT - Office | |
| MarketCap: 3227.46 Millions | |
| Recent Price: 25.89 Smart Investing & Trading Score: 83 | |
| Day Percent Change: -1.18% Day Change: -0.31 | |
| Week Change: 0.82% Year-to-date Change: 12.8% | |
| HIW Links: Profile News Message Board | |
| Charts:- Daily , Weekly | |
| Add HIW to Watchlist: View: Get Complete HIW Trend Analysis ➞ | |
 | BEKE KE Holdings Inc. |
| Sector: Financials | |
| SubSector: Real Estate Services | |
| MarketCap: 80167 Millions | |
| Recent Price: 14.95 Smart Investing & Trading Score: 83 | |
| Day Percent Change: -1.12% Day Change: -0.17 | |
| Week Change: 0.81% Year-to-date Change: -7.8% | |
| BEKE Links: Profile News Message Board | |
| Charts:- Daily , Weekly | |
| Add BEKE to Watchlist: View: Get Complete BEKE Trend Analysis ➞ | |
 | UMH UMH Properties, Inc. |
| Sector: Financials | |
| SubSector: REIT - Diversified | |
| MarketCap: 433.353 Millions | |
| Recent Price: 15.80 Smart Investing & Trading Score: 83 | |
| Day Percent Change: -0.75% Day Change: -0.12 | |
| Week Change: 0.89% Year-to-date Change: 3.1% | |
| UMH Links: Profile News Message Board | |
| Charts:- Daily , Weekly | |
| Add UMH to Watchlist: View: Get Complete UMH Trend Analysis ➞ | |
| For tabular summary view of above stock list: Summary View ➞ 0 - 25 , 25 - 50 , 50 - 75 , 75 - 100 , 100 - 125 , 125 - 150 , 150 - 175 , 175 - 200 , 200 - 225 , 225 - 250 , 250 - 275 , 275 - 300 , 300 - 325 , 325 - 350 , 350 - 375 , 375 - 400 , 400 - 425 , 425 - 450 , 450 - 475 , 475 - 500 , 500 - 525 , 525 - 550 , 550 - 575 , 575 - 600 , 600 - 625 , 625 - 650 , 650 - 675 , 675 - 700 , 700 - 725 , 725 - 750 , 750 - 775 , 775 - 800 , 800 - 825 , 825 - 850 , 850 - 875 , 875 - 900 , 900 - 925 , 925 - 950 , 950 - 975 , 975 - 1000 , 1000 - 1025 , 1025 - 1050 , 1050 - 1075 , 1075 - 1100 , 1100 - 1125 , 1125 - 1150 , 1150 - 1175 , 1175 - 1200 , 1200 - 1225 , 1225 - 1250 | ||
| Click To Change The Sort Order: By Market Cap or Company Size Performance: Year-to-date, Week and Day | |
| Select Chart Type: | ||
|
Best Stocks Today 12Stocks.com |
© 2024 12Stocks.com Terms & Conditions Privacy Contact Us
All Information Provided Only For Education And Not To Be Used For Investing or Trading. See Terms & Conditions


One More Thing ... Get Best Stocks Delivered Daily!
Never Ever Miss A Move With Our Top Ten Stocks Lists
Find Best Stocks In Any Market - Bull or Bear Market
Take A Peek At Our Top Ten Stocks Lists: Daily, Weekly, Year-to-Date & Top Trends
Find Best Stocks In Any Market - Bull or Bear Market
Take A Peek At Our Top Ten Stocks Lists: Daily, Weekly, Year-to-Date & Top Trends
Financial Stocks With Best Up Trends [0-bearish to 100-bullish]: LendingClub [100], TPG RE[100], Redwood Trust[100], Axos [100], Horizon Bancorp[100], Peoples Bancorp[100], Univest [100], USCB [100], Equitable [100], Columbia Banking[100], BankUnited [100]
Best Financial Stocks Year-to-Date:
Root [567.72%], Hippo [141.16%], Gladstone Capital[103.46%], Banco Macro[90.49%], Grupo Financiero[87.49%], Banco BBVA[77.94%], EverQuote [66.91%], Yiren Digital[66.67%], Grupo Supervielle[58.37%], LendingTree [57.95%], Heritage Insurance[57.82%] Best Financial Stocks This Week:
LendingTree [26.36%], Heartland [17.81%], New York[14.48%], Douglas Elliman[13.45%], Industrial Logistics[11.57%], LendingClub [11.11%], TPG RE[9.8%], AdvisorShares Pure[9%], USCB [8.95%], AltC Acquisition[8.82%], Root [8.56%] Best Financial Stocks Daily:
New York[28.30%], LendingClub [19.68%], Industrial Logistics[15.06%], TPG RE[13.10%], Redwood Trust[11.75%], Axos [9.66%], GoHealth [9.24%], Capitol Federal[6.92%], Huize Holding[6.76%], SelectQuote [6.62%], Citizens & Northern[6.51%]