
 Login Sign Up


| |||||
 |  | ||||

| 12Stocks.com Market Intelligence |
Best Financial Stocks
| In a hurry? Financial Stocks Lists: Performance Trends Table, Stock Charts
Sort Financial stocks: Daily, Weekly, Year-to-Date, Market Cap & Trends. Filter Financial stocks list by size:All Financial Large Mid-Range Small & MicroCap |
| 12Stocks.com Financial Stocks Performances & Trends Daily | |||||||||
|
|  The overall Smart Investing & Trading Score is 85 (0-bearish to 100-bullish) which puts Financial sector in short term bullish trend. The Smart Investing & Trading Score from previous trading session is 53 and hence an improvement of trend.
| ||||||||
Here are the Smart Investing & Trading Scores of the most requested Financial stocks at 12Stocks.com (click stock name for detailed review):
|


| 12Stocks.com: Investing in Financial sector with Stocks | |
|
The following table helps investors and traders sort through current performance and trends (as measured by Smart Investing & Trading Score) of various
stocks in the Financial sector. Quick View: Move mouse or cursor over stock symbol (ticker) to view short-term Technical chart and over stock name to view long term chart. Click on  to add stock symbol to your watchlist and to add stock symbol to your watchlist and  to view watchlist. Click on any ticker or stock name for detailed market intelligence report for that stock. to view watchlist. Click on any ticker or stock name for detailed market intelligence report for that stock. |
12Stocks.com Performance of Stocks in Financial Sector
| Ticker | Stock Name | Watchlist | Category | Recent Price | Trend Score | Change % | YTD Change% |
| VBTX | Veritex |   | Regional - Southwest Banks | 20.50 | 93 | 0.05% | -11.90% |
| WASH | Washington Trust | | Regional Banks | 26.55 | 93 | 0.04% | -18.00% |
| AMTB | Amerant Bancorp | | Regional Banks | 22.62 | 93 | 0.04% | -7.94% |
| LC | LendingClub | | Credit Services | 9.15 | 93 | -1.40% | 4.69% |
| BUSE | First Busey | | Regional Banks | 23.49 | 93 | -0.97% | -5.36% |
| TCBK | TriCo Bancshares | | Regional Banks | 37.15 | 93 | -0.85% | -13.54% |
| PAXS | PIMCO Access | | Closed-End Fund - Debt | 16.01 | 93 | -0.45% | 10.95% |
| SYBT | Stock Yards | | Regional Banks | 46.77 | 93 | -0.43% | -9.17% |
| FBP | First Ban | | Foreign Banks | 18.04 | 93 | -0.22% | 9.67% |
| WTM | White Mountains | | Insurance | 1855.24 | 93 | 2.92% | 23.27% |
| CGBD | TCG BDC | | Asset Mgmt | 17.57 | 93 | 2.24% | 17.41% |
| PRLH | Pearl | | SPAC | 10.96 | 93 | 1.29% | 2.72% |
| FSK | FS KKR | | Asset Mgmt | 19.42 | 93 | 1.04% | -2.75% |
| MGF | MFS Government | | Closed-End Fund - Debt | 3.18 | 93 | 0.95% | 0.00% |
| MBINM | Merchants Bancorp | | Banks - Regional | 26.03 | 93 | 0.42% | 5.43% |
| DTF | DTF Tax-Free | | Closed-End Fund - Debt | 10.92 | 93 | 0.09% | 1.58% |
| PAI | Western Asset | | Closed-End Fund - Debt | 12.09 | 93 | -0.90% | 0.42% |
| OSBC | Old Second | | Regional Banks | 14.25 | 93 | -0.77% | -7.71% |
| PMX | PIMCO Municipal | | Closed-End Fund - Debt | 7.50 | 93 | -0.27% | 1.49% |
| VIST | Vista Oil | | Asset Mgmt | 45.68 | 90 | 5.74% | 54.79% |
| ARES | Ares Management | | Asset Mgmt | 136.17 | 90 | 3.23% | 14.51% |
| VEL | Velocity | | Mortgage Finance | 17.88 | 90 | 3.19% | 7.59% |
| FG | F&G Annuities | | Insurance - Life | 41.38 | 90 | 2.94% | -10.25% |
| FOR | Forestar | | Real Estatet | 34.51 | 90 | 2.80% | 4.35% |
| DB | Deutsche Bank | | Foreign Banks | 16.90 | 90 | 2.61% | 24.72% |
| For chart view version of above stock list: Chart View ➞ 0 - 25 , 25 - 50 , 50 - 75 , 75 - 100 , 100 - 125 , 125 - 150 , 150 - 175 , 175 - 200 , 200 - 225 , 225 - 250 , 250 - 275 , 275 - 300 , 300 - 325 , 325 - 350 , 350 - 375 , 375 - 400 , 400 - 425 , 425 - 450 , 450 - 475 , 475 - 500 , 500 - 525 , 525 - 550 , 550 - 575 , 575 - 600 , 600 - 625 , 625 - 650 , 650 - 675 , 675 - 700 , 700 - 725 , 725 - 750 , 750 - 775 , 775 - 800 , 800 - 825 , 825 - 850 , 850 - 875 , 875 - 900 , 900 - 925 , 925 - 950 , 950 - 975 , 975 - 1000 , 1000 - 1025 , 1025 - 1050 , 1050 - 1075 , 1075 - 1100 , 1100 - 1125 , 1125 - 1150 , 1150 - 1175 , 1175 - 1200 , 1200 - 1225 | ||
 | Click To Change The Sort Order: By Market Cap or Company Size Performance: Year-to-date, Week and Day |  |
|
Get the most comprehensive stock market coverage daily at 12Stocks.com ➞ Best Stocks Today ➞ Best Stocks Weekly ➞ Best Stocks Year-to-Date ➞ Best Stocks Trends ➞  Best Stocks Today 12Stocks.com Best Nasdaq Stocks ➞ Best S&P 500 Stocks ➞ Best Tech Stocks ➞ Best Biotech Stocks ➞ |
| Detailed Overview of Financial Stocks |
| Financial Technical Overview, Leaders & Laggards, Top Financial ETF Funds & Detailed Financial Stocks List, Charts, Trends & More |
| Financial Sector: Technical Analysis, Trends & YTD Performance | |
| Financial sector is composed of stocks
from banks, brokers, insurance, REITs
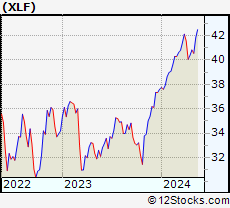
and services subsectors. Financial sector, as represented by XLF, an exchange-traded fund [ETF] that holds basket of Financial stocks (e.g, Bank of America, Goldman Sachs) is up by 9.23% and is currently outperforming the overall market by 1.21% year-to-date. Below is a quick view of Technical charts and trends: |
|
 XLF Weekly Chart |
|
| Long Term Trend: Good | |
| Medium Term Trend: Good | |
 XLF Daily Chart |
|
| Short Term Trend: Very Good | |
| Overall Trend Score: 85 | |
| YTD Performance: 9.23% | |
| **Trend Scores & Views Are Only For Educational Purposes And Not For Investing | |
| 12Stocks.com: Top Performing Financial Sector Stocks | ||||||||||||||||||||||||||||||||||||||||||||||||
 The top performing Financial sector stocks year to date are
Now, more recently, over last week, the top performing Financial sector stocks on the move are


|
||||||||||||||||||||||||||||||||||||||||||||||||
| 12Stocks.com: Investing in Financial Sector using Exchange Traded Funds | |
|
The following table shows list of key exchange traded funds (ETF) that
help investors track Financial Index. For detailed view, check out our ETF Funds section of our website. Quick View: Move mouse or cursor over ETF symbol (ticker) to view short-term Technical chart and over ETF name to view long term chart. Click on ticker or stock name for detailed view. Click on to add stock symbol to your watchlist and to view watchlist. |
12Stocks.com List of ETFs that track Financial Index
| Ticker | ETF Name | Watchlist | Recent Price | Smart Investing & Trading Score | Change % | Week % | Year-to-date % |
| XLF | Financial | | 41.07 | 85 | 1.28 | 1.28 | 9.23% |
| IAI | Broker-Dealers & Secs | | 115.74 | 100 | 1.29 | 1.29 | 6.64% |
| IYF | Financials | | 93.61 | 60 | 1.23 | 1.23 | 9.6% |
| IYG | Financial Services | | 64.83 | 47 | 1.15 | 1.15 | 8.53% |
| KRE | Regional Banking | | 50.04 | 65 | 0.79 | 0.79 | -4.56% |
| IXG | Global Financials | | 85.45 | 85 | 0.72 | 0.72 | 8.74% |
| VFH | Financials | | 99.85 | 50 | 1.17 | 1.17 | 8.23% |
| KBE | Bank | | 46.89 | 100 | 1.08 | 1.08 | 1.89% |
| FAS | Financial Bull 3X | | 102.22 | 85 | 3.43 | 3.43 | 23.68% |
| FAZ | Financial Bear 3X | | 10.71 | 10 | -3.34 | -3.34 | -21.65% |
| UYG | Financials | | 64.26 | 85 | 2.34 | 2.34 | 16.41% |
| IAT | Regional Banks | | 42.67 | 65 | 0.90 | 0.9 | 1.98% |
| KIE | Insurance | | 50.38 | 90 | 1.82 | 1.82 | 11.41% |
| PSCF | SmallCap Financials | | 47.62 | 100 | 0.72 | 0.72 | -3.17% |
| EUFN | Europe Financials | | 22.99 | 70 | 1.52 | 1.52 | 9.69% |
| PGF | Financial Preferred | | 14.86 | 34 | 0.07 | 0.07 | 1.92% |
| 12Stocks.com: Charts, Trends, Fundamental Data and Performances of Financial Stocks | |
|
We now take in-depth look at all Financial stocks including charts, multi-period performances and overall trends (as measured by Smart Investing & Trading Score). One can sort Financial stocks (click link to choose) by Daily, Weekly and by Year-to-Date performances. Also, one can sort by size of the company or by market capitalization. |
| Select Your Default Chart Type: | |||||
| |||||
| Click on stock symbol or name for detailed view. Click on to add stock symbol to your watchlist and to view watchlist. Quick View: Move mouse or cursor over "Daily" to quickly view daily Technical stock chart and over "Weekly" to view weekly Technical stock chart. | |||||

 | VBTX Veritex Holdings, Inc. |
| Sector: Financials | |
| SubSector: Regional - Southwest Banks | |
| MarketCap: 625.165 Millions | |
| Recent Price: 20.50 Smart Investing & Trading Score: 93 | |
| Day Percent Change: 0.05% Day Change: 0.01 | |
| Week Change: 0.05% Year-to-date Change: -11.9% | |
| VBTX Links: Profile News Message Board | |
| Charts:- Daily , Weekly | |
| Add VBTX to Watchlist: View: Get Complete VBTX Trend Analysis ➞ | |
 | WASH Washington Trust Bancorp, Inc. |
| Sector: Financials | |
| SubSector: Regional - Northeast Banks | |
| MarketCap: 590.099 Millions | |
| Recent Price: 26.55 Smart Investing & Trading Score: 93 | |
| Day Percent Change: 0.04% Day Change: 0.01 | |
| Week Change: 0.04% Year-to-date Change: -18.0% | |
| WASH Links: Profile News Message Board | |
| Charts:- Daily , Weekly | |
| Add WASH to Watchlist: View: Get Complete WASH Trend Analysis ➞ | |
 | AMTB Amerant Bancorp Inc. |
| Sector: Financials | |
| SubSector: Regional - Midwest Banks | |
| MarketCap: 653.87 Millions | |
| Recent Price: 22.62 Smart Investing & Trading Score: 93 | |
| Day Percent Change: 0.04% Day Change: 0.01 | |
| Week Change: 0.04% Year-to-date Change: -7.9% | |
| AMTB Links: Profile News Message Board | |
| Charts:- Daily , Weekly | |
| Add AMTB to Watchlist: View: Get Complete AMTB Trend Analysis ➞ | |
 | LC LendingClub Corporation |
| Sector: Financials | |
| SubSector: Credit Services | |
| MarketCap: 852.308 Millions | |
| Recent Price: 9.15 Smart Investing & Trading Score: 93 | |
| Day Percent Change: -1.40% Day Change: -0.13 | |
| Week Change: -1.4% Year-to-date Change: 4.7% | |
| LC Links: Profile News Message Board | |
| Charts:- Daily , Weekly | |
| Add LC to Watchlist: View: Get Complete LC Trend Analysis ➞ | |
 | BUSE First Busey Corporation |
| Sector: Financials | |
| SubSector: Regional - Midwest Banks | |
| MarketCap: 876.97 Millions | |
| Recent Price: 23.49 Smart Investing & Trading Score: 93 | |
| Day Percent Change: -0.97% Day Change: -0.23 | |
| Week Change: -0.97% Year-to-date Change: -5.4% | |
| BUSE Links: Profile News Message Board | |
| Charts:- Daily , Weekly | |
| Add BUSE to Watchlist: View: Get Complete BUSE Trend Analysis ➞ | |
 | TCBK TriCo Bancshares |
| Sector: Financials | |
| SubSector: Regional - Pacific Banks | |
| MarketCap: 875.129 Millions | |
| Recent Price: 37.15 Smart Investing & Trading Score: 93 | |
| Day Percent Change: -0.85% Day Change: -0.32 | |
| Week Change: -0.85% Year-to-date Change: -13.5% | |
| TCBK Links: Profile News Message Board | |
| Charts:- Daily , Weekly | |
| Add TCBK to Watchlist: View: Get Complete TCBK Trend Analysis ➞ | |
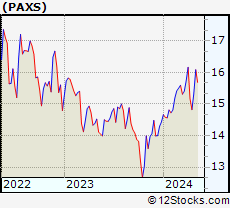 | PAXS PIMCO Access Income Fund |
| Sector: Financials | |
| SubSector: Closed-End Fund - Debt | |
| MarketCap: 649 Millions | |
| Recent Price: 16.01 Smart Investing & Trading Score: 93 | |
| Day Percent Change: -0.45% Day Change: -0.07 | |
| Week Change: -0.45% Year-to-date Change: 11.0% | |
| PAXS Links: Profile News Message Board | |
| Charts:- Daily , Weekly | |
| Add PAXS to Watchlist: View: Get Complete PAXS Trend Analysis ➞ | |
 | SYBT Stock Yards Bancorp, Inc. |
| Sector: Financials | |
| SubSector: Regional - Southeast Banks | |
| MarketCap: 629.235 Millions | |
| Recent Price: 46.77 Smart Investing & Trading Score: 93 | |
| Day Percent Change: -0.43% Day Change: -0.20 | |
| Week Change: -0.43% Year-to-date Change: -9.2% | |
| SYBT Links: Profile News Message Board | |
| Charts:- Daily , Weekly | |
| Add SYBT to Watchlist: View: Get Complete SYBT Trend Analysis ➞ | |
 | FBP First BanCorp. |
| Sector: Financials | |
| SubSector: Foreign Regional Banks | |
| MarketCap: 913.079 Millions | |
| Recent Price: 18.04 Smart Investing & Trading Score: 93 | |
| Day Percent Change: -0.22% Day Change: -0.04 | |
| Week Change: -0.22% Year-to-date Change: 9.7% | |
| FBP Links: Profile News Message Board | |
| Charts:- Daily , Weekly | |
| Add FBP to Watchlist: View: Get Complete FBP Trend Analysis ➞ | |
 | WTM White Mountains Insurance Group, Ltd. |
| Sector: Financials | |
| SubSector: Property & Casualty Insurance | |
| MarketCap: 2502.62 Millions | |
| Recent Price: 1855.24 Smart Investing & Trading Score: 93 | |
| Day Percent Change: 2.92% Day Change: 52.67 | |
| Week Change: 2.92% Year-to-date Change: 23.3% | |
| WTM Links: Profile News Message Board | |
| Charts:- Daily , Weekly | |
| Add WTM to Watchlist: View: Get Complete WTM Trend Analysis ➞ | |
 | CGBD TCG BDC, Inc. |
| Sector: Financials | |
| SubSector: Asset Management | |
| MarketCap: 379.003 Millions | |
| Recent Price: 17.57 Smart Investing & Trading Score: 93 | |
| Day Percent Change: 2.24% Day Change: 0.39 | |
| Week Change: 2.24% Year-to-date Change: 17.4% | |
| CGBD Links: Profile News Message Board | |
| Charts:- Daily , Weekly | |
| Add CGBD to Watchlist: View: Get Complete CGBD Trend Analysis ➞ | |
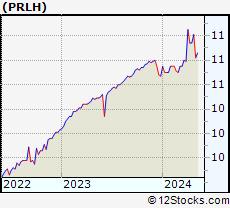 | PRLH Pearl Holdings Acquisition Corp |
| Sector: Financials | |
| SubSector: SPAC | |
| MarketCap: 264 Millions | |
| Recent Price: 10.96 Smart Investing & Trading Score: 93 | |
| Day Percent Change: 1.29% Day Change: 0.14 | |
| Week Change: 1.29% Year-to-date Change: 2.7% | |
| PRLH Links: Profile News Message Board | |
| Charts:- Daily , Weekly | |
| Add PRLH to Watchlist: View: Get Complete PRLH Trend Analysis ➞ | |
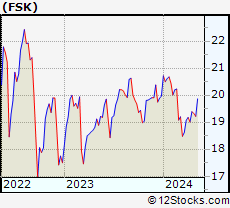 | FSK FS KKR Capital Corp. |
| Sector: Financials | |
| SubSector: Asset Management | |
| MarketCap: 1262.33 Millions | |
| Recent Price: 19.42 Smart Investing & Trading Score: 93 | |
| Day Percent Change: 1.04% Day Change: 0.20 | |
| Week Change: 1.04% Year-to-date Change: -2.8% | |
| FSK Links: Profile News Message Board | |
| Charts:- Daily , Weekly | |
| Add FSK to Watchlist: View: Get Complete FSK Trend Analysis ➞ | |
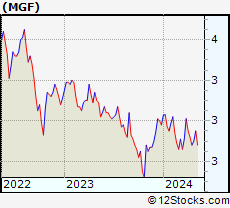 | MGF MFS Government Markets Income Trust |
| Sector: Financials | |
| SubSector: Closed-End Fund - Debt | |
| MarketCap: 141.807 Millions | |
| Recent Price: 3.18 Smart Investing & Trading Score: 93 | |
| Day Percent Change: 0.95% Day Change: 0.03 | |
| Week Change: 0.95% Year-to-date Change: 0.0% | |
| MGF Links: Profile News Message Board | |
| Charts:- Daily , Weekly | |
| Add MGF to Watchlist: View: Get Complete MGF Trend Analysis ➞ | |
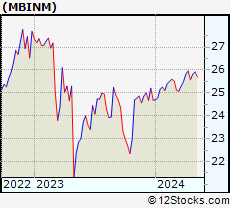 | MBINM Merchants Bancorp |
| Sector: Financials | |
| SubSector: Banks - Regional | |
| MarketCap: 1110 Millions | |
| Recent Price: 26.03 Smart Investing & Trading Score: 93 | |
| Day Percent Change: 0.42% Day Change: 0.11 | |
| Week Change: 0.42% Year-to-date Change: 5.4% | |
| MBINM Links: Profile News Message Board | |
| Charts:- Daily , Weekly | |
| Add MBINM to Watchlist: View: Get Complete MBINM Trend Analysis ➞ | |
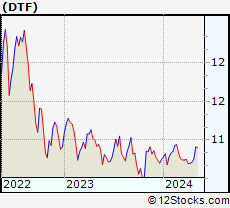 | DTF DTF Tax-Free Income Inc. |
| Sector: Financials | |
| SubSector: Closed-End Fund - Debt | |
| MarketCap: 106.407 Millions | |
| Recent Price: 10.92 Smart Investing & Trading Score: 93 | |
| Day Percent Change: 0.09% Day Change: 0.01 | |
| Week Change: 0.09% Year-to-date Change: 1.6% | |
| DTF Links: Profile News Message Board | |
| Charts:- Daily , Weekly | |
| Add DTF to Watchlist: View: Get Complete DTF Trend Analysis ➞ | |
 | PAI Western Asset Investment Grade Income Fund Inc. |
| Sector: Financials | |
| SubSector: Closed-End Fund - Debt | |
| MarketCap: 109.607 Millions | |
| Recent Price: 12.09 Smart Investing & Trading Score: 93 | |
| Day Percent Change: -0.90% Day Change: -0.11 | |
| Week Change: -0.9% Year-to-date Change: 0.4% | |
| PAI Links: Profile News Message Board | |
| Charts:- Daily , Weekly | |
| Add PAI to Watchlist: View: Get Complete PAI Trend Analysis ➞ | |
 | OSBC Old Second Bancorp, Inc. |
| Sector: Financials | |
| SubSector: Regional - Midwest Banks | |
| MarketCap: 237.17 Millions | |
| Recent Price: 14.25 Smart Investing & Trading Score: 93 | |
| Day Percent Change: -0.77% Day Change: -0.11 | |
| Week Change: -0.77% Year-to-date Change: -7.7% | |
| OSBC Links: Profile News Message Board | |
| Charts:- Daily , Weekly | |
| Add OSBC to Watchlist: View: Get Complete OSBC Trend Analysis ➞ | |
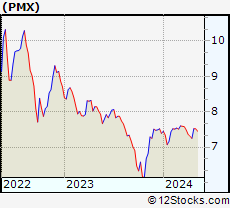 | PMX PIMCO Municipal Income Fund III |
| Sector: Financials | |
| SubSector: Closed-End Fund - Debt | |
| MarketCap: 309.807 Millions | |
| Recent Price: 7.50 Smart Investing & Trading Score: 93 | |
| Day Percent Change: -0.27% Day Change: -0.02 | |
| Week Change: -0.27% Year-to-date Change: 1.5% | |
| PMX Links: Profile News Message Board | |
| Charts:- Daily , Weekly | |
| Add PMX to Watchlist: View: Get Complete PMX Trend Analysis ➞ | |
 | VIST Vista Oil & Gas, S.A.B. de C.V. |
| Sector: Financials | |
| SubSector: Asset Management | |
| MarketCap: 201.603 Millions | |
| Recent Price: 45.68 Smart Investing & Trading Score: 90 | |
| Day Percent Change: 5.74% Day Change: 2.48 | |
| Week Change: 5.74% Year-to-date Change: 54.8% | |
| VIST Links: Profile News Message Board | |
| Charts:- Daily , Weekly | |
| Add VIST to Watchlist: View: Get Complete VIST Trend Analysis ➞ | |
 | ARES Ares Management Corporation |
| Sector: Financials | |
| SubSector: Asset Management | |
| MarketCap: 5826.23 Millions | |
| Recent Price: 136.17 Smart Investing & Trading Score: 90 | |
| Day Percent Change: 3.23% Day Change: 4.26 | |
| Week Change: 3.23% Year-to-date Change: 14.5% | |
| ARES Links: Profile News Message Board | |
| Charts:- Daily , Weekly | |
| Add ARES to Watchlist: View: Get Complete ARES Trend Analysis ➞ | |
 | VEL Velocity Financial, Inc. |
| Sector: Financials | |
| SubSector: Mortgage Finance | |
| MarketCap: 12157 Millions | |
| Recent Price: 17.88 Smart Investing & Trading Score: 90 | |
| Day Percent Change: 3.19% Day Change: 0.55 | |
| Week Change: 3.19% Year-to-date Change: 7.6% | |
| VEL Links: Profile News Message Board | |
| Charts:- Daily , Weekly | |
| Add VEL to Watchlist: View: Get Complete VEL Trend Analysis ➞ | |
 | FG F&G Annuities & Life, Inc. |
| Sector: Financials | |
| SubSector: Insurance - Life | |
| MarketCap: 2960 Millions | |
| Recent Price: 41.38 Smart Investing & Trading Score: 90 | |
| Day Percent Change: 2.94% Day Change: 1.18 | |
| Week Change: 2.94% Year-to-date Change: -10.3% | |
| FG Links: Profile News Message Board | |
| Charts:- Daily , Weekly | |
| Add FG to Watchlist: View: Get Complete FG Trend Analysis ➞ | |
 | FOR Forestar Group Inc. |
| Sector: Financials | |
| SubSector: Real Estate Development | |
| MarketCap: 661.019 Millions | |
| Recent Price: 34.51 Smart Investing & Trading Score: 90 | |
| Day Percent Change: 2.80% Day Change: 0.94 | |
| Week Change: 2.8% Year-to-date Change: 4.4% | |
| FOR Links: Profile News Message Board | |
| Charts:- Daily , Weekly | |
| Add FOR to Watchlist: View: Get Complete FOR Trend Analysis ➞ | |
 | DB Deutsche Bank Aktiengesellschaft |
| Sector: Financials | |
| SubSector: Foreign Regional Banks | |
| MarketCap: 14500.5 Millions | |
| Recent Price: 16.90 Smart Investing & Trading Score: 90 | |
| Day Percent Change: 2.61% Day Change: 0.43 | |
| Week Change: 2.61% Year-to-date Change: 24.7% | |
| DB Links: Profile News Message Board | |
| Charts:- Daily , Weekly | |
| Add DB to Watchlist: View: Get Complete DB Trend Analysis ➞ | |
| For tabular summary view of above stock list: Summary View ➞ 0 - 25 , 25 - 50 , 50 - 75 , 75 - 100 , 100 - 125 , 125 - 150 , 150 - 175 , 175 - 200 , 200 - 225 , 225 - 250 , 250 - 275 , 275 - 300 , 300 - 325 , 325 - 350 , 350 - 375 , 375 - 400 , 400 - 425 , 425 - 450 , 450 - 475 , 475 - 500 , 500 - 525 , 525 - 550 , 550 - 575 , 575 - 600 , 600 - 625 , 625 - 650 , 650 - 675 , 675 - 700 , 700 - 725 , 725 - 750 , 750 - 775 , 775 - 800 , 800 - 825 , 825 - 850 , 850 - 875 , 875 - 900 , 900 - 925 , 925 - 950 , 950 - 975 , 975 - 1000 , 1000 - 1025 , 1025 - 1050 , 1050 - 1075 , 1075 - 1100 , 1100 - 1125 , 1125 - 1150 , 1150 - 1175 , 1175 - 1200 , 1200 - 1225 | ||
| Click To Change The Sort Order: By Market Cap or Company Size Performance: Year-to-date, Week and Day | |
| Select Chart Type: | ||
|
Best Stocks Today 12Stocks.com |
© 2024 12Stocks.com Terms & Conditions Privacy Contact Us
All Information Provided Only For Education And Not To Be Used For Investing or Trading. See Terms & Conditions


One More Thing ... Get Best Stocks Delivered Daily!
Never Ever Miss A Move With Our Top Ten Stocks Lists
Find Best Stocks In Any Market - Bull or Bear Market
Take A Peek At Our Top Ten Stocks Lists: Daily, Weekly, Year-to-Date & Top Trends
Find Best Stocks In Any Market - Bull or Bear Market
Take A Peek At Our Top Ten Stocks Lists: Daily, Weekly, Year-to-Date & Top Trends
Financial Stocks With Best Up Trends [0-bearish to 100-bullish]: Screaming Eagle[100], AltC Acquisition[100], Grupo Supervielle[100], Banco BBVA[100], IRSA Inversiones[100], AG Mortgage[100], Regional Management[100], Grupo Financiero[100], Banco Macro[100], New York[100], BlackRock Muni[100]
Best Financial Stocks Year-to-Date:
Root [447.09%], Banco Macro[123.69%], Grupo Financiero[113.15%], Banco BBVA[109.01%], Hippo [103.84%], Gladstone Capital[102.9%], Grupo Supervielle[83.99%], EverQuote [74.51%], Yiren Digital[71.79%], SelectQuote [67.15%], LendingTree [65.5%] Best Financial Stocks This Week:
Trupanion [13.4%], Screaming Eagle[12.4%], SelectQuote [12.25%], Iris Energy[11.23%], Citizens [9.48%], AltC Acquisition[9.4%], Grupo Supervielle[8.73%], Banco BBVA[8.39%], MicroSectors Gold[8.06%], Alexander s[7.86%], Upstart [7.53%] Best Financial Stocks Daily:
Trupanion [13.40%], Screaming Eagle[12.40%], SelectQuote [12.25%], Iris Energy[11.23%], Citizens [9.48%], AltC Acquisition[9.40%], Grupo Supervielle[8.73%], Banco BBVA[8.39%], MicroSectors Gold[8.06%], Alexander s[7.86%], Upstart [7.53%]