
 Login Sign Up


| |||||
 |  | ||||

| 12Stocks.com Market Intelligence |
Best Financial Stocks
| In a hurry? Financial Stocks Lists: Performance Trends Table, Stock Charts
Sort Financial stocks: Daily, Weekly, Year-to-Date, Market Cap & Trends. Filter Financial stocks list by size:All Financial Large Mid-Range Small & MicroCap |
| 12Stocks.com Financial Stocks Performances & Trends Daily | |||||||||
|
|  The overall Smart Investing & Trading Score is 68 (0-bearish to 100-bullish) which puts Financial sector in short term neutral to bullish trend. The Smart Investing & Trading Score from previous trading session is 75 and hence a deterioration of trend.
| ||||||||
Here are the Smart Investing & Trading Scores of the most requested Financial stocks at 12Stocks.com (click stock name for detailed review):
|


| 12Stocks.com: Investing in Financial sector with Stocks | |
|
The following table helps investors and traders sort through current performance and trends (as measured by Smart Investing & Trading Score) of various
stocks in the Financial sector. Quick View: Move mouse or cursor over stock symbol (ticker) to view short-term Technical chart and over stock name to view long term chart. Click on  to add stock symbol to your watchlist and to add stock symbol to your watchlist and  to view watchlist. Click on any ticker or stock name for detailed market intelligence report for that stock. to view watchlist. Click on any ticker or stock name for detailed market intelligence report for that stock. |
12Stocks.com Performance of Stocks in Financial Sector
| Ticker | Stock Name | Watchlist | Category | Recent Price | Trend Score | Change % | YTD Change% |
| BDN | Brandywine Realty |   | REIT - | 4.51 | 74 | -1.53% | -16.48% |
| ROIC | Retail Opportunity | | REIT - Retail | 12.40 | 74 | -1.04% | -11.62% |
| EFC | Ellington | | Mortgage | 11.55 | 74 | -1.03% | -9.13% |
| WAFD | Washington Federal | | S&L | 28.39 | 74 | -0.70% | -13.87% |
| ITIC | Investors Title | | Insurance | 163.63 | 74 | -0.50% | 0.92% |
| TOWN | TowneBank | | Regional Banks | 27.75 | 74 | -0.25% | -6.75% |
| DCOM | Dime Community | | S&L | 19.39 | 74 | -0.21% | -28.00% |
| GTY | Getty Realty | | REIT - Retail | 27.38 | 74 | -0.18% | -6.30% |
| LBAI | Lakeland Bancorp | | Regional Banks | 12.84 | 74 | -0.08% | -13.18% |
| TCBI | Texas Capital | | Regional - Southwest Banks | 60.12 | 74 | -0.07% | -6.98% |
| HFWA | Heritage | | Regional Banks | 18.62 | 74 | -0.05% | -12.95% |
| YRD | Yiren Digital | | Credit Services | 5.08 | 73 | 1.20% | 62.82% |
| DRH | DiamondRock Hospitality | | REIT | 9.22 | 73 | 0.77% | -1.81% |
| KSM | DWS Strategic | | Closed-End Fund - Debt | 9.59 | 73 | 0.52% | 10.87% |
| GGAL | Grupo Financiero | | Foreign Banks | 29.07 | 73 | -4.78% | 68.38% |
| BSIG | BrightSphere | | Asset Mgmt | 23.08 | 73 | -1.83% | 20.46% |
| HLI | Houlihan Lokey | | Brokerage | 128.00 | 73 | -1.33% | 6.75% |
| VCTR | Victory Capital | | Asset Mgmt | 50.02 | 73 | -1.22% | 45.24% |
| INSI | Insight Select | | Asset Mgmt | 16.20 | 73 | -0.67% | 1.44% |
| ORI | Old Republic | | Insurance | 30.30 | 73 | -0.03% | 3.06% |
| CMA | Comerica | | Banks | 52.95 | 73 | 0.59% | -5.12% |
| WABC | Westamerica Ban | | Regional Banks | 47.86 | 73 | 0.21% | -15.16% |
| LND | BrasilAgro - | | Property Mgmt | 4.99 | 73 | 0.00% | -5.49% |
| JHS | John Hancock | | Closed-End Fund - Debt | 10.99 | 73 | -0.36% | 1.01% |
| MRCC | Monroe Capital | | Mortgage | 7.28 | 72 | 0.97% | 3.04% |
| For chart view version of above stock list: Chart View ➞ 0 - 25 , 25 - 50 , 50 - 75 , 75 - 100 , 100 - 125 , 125 - 150 , 150 - 175 , 175 - 200 , 200 - 225 , 225 - 250 , 250 - 275 , 275 - 300 , 300 - 325 , 325 - 350 , 350 - 375 , 375 - 400 , 400 - 425 , 425 - 450 , 450 - 475 , 475 - 500 , 500 - 525 , 525 - 550 , 550 - 575 , 575 - 600 , 600 - 625 , 625 - 650 , 650 - 675 , 675 - 700 , 700 - 725 , 725 - 750 , 750 - 775 , 775 - 800 , 800 - 825 , 825 - 850 , 850 - 875 , 875 - 900 , 900 - 925 , 925 - 950 , 950 - 975 , 975 - 1000 , 1000 - 1025 , 1025 - 1050 , 1050 - 1075 , 1075 - 1100 , 1100 - 1125 , 1125 - 1150 , 1150 - 1175 , 1175 - 1200 , 1200 - 1225 , 1225 - 1250 | ||
 | Click To Change The Sort Order: By Market Cap or Company Size Performance: Year-to-date, Week and Day |  |
|
Get the most comprehensive stock market coverage daily at 12Stocks.com ➞ Best Stocks Today ➞ Best Stocks Weekly ➞ Best Stocks Year-to-Date ➞ Best Stocks Trends ➞  Best Stocks Today 12Stocks.com Best Nasdaq Stocks ➞ Best S&P 500 Stocks ➞ Best Tech Stocks ➞ Best Biotech Stocks ➞ |
| Detailed Overview of Financial Stocks |
| Financial Technical Overview, Leaders & Laggards, Top Financial ETF Funds & Detailed Financial Stocks List, Charts, Trends & More |
| Financial Sector: Technical Analysis, Trends & YTD Performance | |
| Financial sector is composed of stocks
from banks, brokers, insurance, REITs
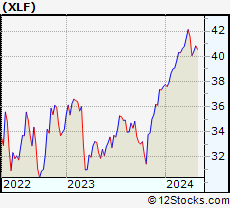
and services subsectors. Financial sector, as represented by XLF, an exchange-traded fund [ETF] that holds basket of Financial stocks (e.g, Bank of America, Goldman Sachs) is up by 9.36% and is currently outperforming the overall market by 3.7% year-to-date. Below is a quick view of Technical charts and trends: |
|
 XLF Weekly Chart |
|
| Long Term Trend: Very Good | |
| Medium Term Trend: Not Good | |
 XLF Daily Chart |
|
| Short Term Trend: Very Good | |
| Overall Trend Score: 68 | |
| YTD Performance: 9.36% | |
| **Trend Scores & Views Are Only For Educational Purposes And Not For Investing | |
| 12Stocks.com: Top Performing Financial Sector Stocks | ||||||||||||||||||||||||||||||||||||||||||||||||
 The top performing Financial sector stocks year to date are
Now, more recently, over last week, the top performing Financial sector stocks on the move are


|
||||||||||||||||||||||||||||||||||||||||||||||||
| 12Stocks.com: Investing in Financial Sector using Exchange Traded Funds | |
|
The following table shows list of key exchange traded funds (ETF) that
help investors track Financial Index. For detailed view, check out our ETF Funds section of our website. Quick View: Move mouse or cursor over ETF symbol (ticker) to view short-term Technical chart and over ETF name to view long term chart. Click on ticker or stock name for detailed view. Click on to add stock symbol to your watchlist and to view watchlist. |
12Stocks.com List of ETFs that track Financial Index
| Ticker | ETF Name | Watchlist | Recent Price | Smart Investing & Trading Score | Change % | Week % | Year-to-date % |
| XLF | Financial | | 41.12 | 68 | -0.02 | 1.83 | 9.36% |
| IAI | Broker-Dealers & Secs | | 112.90 | 75 | -0.18 | 1.68 | 4.03% |
| IYF | Financials | | 92.96 | 68 | -0.20 | 1.82 | 8.84% |
| IYG | Financial Services | | 64.91 | 83 | 0.05 | 2.35 | 8.66% |
| KRE | Regional Banking | | 49.01 | 74 | 0.57 | 3.57 | -6.52% |
| IXG | Global Financials | | 84.46 | 53 | -0.22 | 1.93 | 7.49% |
| VFH | Financials | | 99.72 | 75 | -0.10 | 2.02 | 8.09% |
| KBE | Bank | | 45.96 | 100 | 0.70 | 3.49 | -0.13% |
| FAS | Financial Bull 3X | | 103.20 | 68 | -0.35 | 5.38 | 24.86% |
| FAZ | Financial Bear 3X | | 10.61 | 32 | 0.28 | -5.27 | -22.38% |
| UYG | Financials | | 64.74 | 68 | 0.00 | 3.68 | 17.28% |
| IAT | Regional Banks | | 42.21 | 100 | 0.76 | 3.61 | 0.88% |
| KIE | Insurance | | 49.67 | 58 | -0.16 | 1.2 | 9.84% |
| PSCF | SmallCap Financials | | 47.04 | 58 | 0.19 | 3.45 | -4.35% |
| EUFN | Europe Financials | | 22.42 | 68 | -1.10 | 2.14 | 6.97% |
| PGF | Financial Preferred | | 14.73 | 44 | 0.07 | 1.38 | 1.03% |
| 12Stocks.com: Charts, Trends, Fundamental Data and Performances of Financial Stocks | |
|
We now take in-depth look at all Financial stocks including charts, multi-period performances and overall trends (as measured by Smart Investing & Trading Score). One can sort Financial stocks (click link to choose) by Daily, Weekly and by Year-to-Date performances. Also, one can sort by size of the company or by market capitalization. |
| Select Your Default Chart Type: | |||||
| |||||
| Click on stock symbol or name for detailed view. Click on to add stock symbol to your watchlist and to view watchlist. Quick View: Move mouse or cursor over "Daily" to quickly view daily Technical stock chart and over "Weekly" to view weekly Technical stock chart. | |||||

 | BDN Brandywine Realty Trust |
| Sector: Financials | |
| SubSector: REIT - Diversified | |
| MarketCap: 1688.13 Millions | |
| Recent Price: 4.51 Smart Investing & Trading Score: 74 | |
| Day Percent Change: -1.53% Day Change: -0.07 | |
| Week Change: 2.97% Year-to-date Change: -16.5% | |
| BDN Links: Profile News Message Board | |
| Charts:- Daily , Weekly | |
| Add BDN to Watchlist: View: Get Complete BDN Trend Analysis ➞ | |
 | ROIC Retail Opportunity Investments Corp. |
| Sector: Financials | |
| SubSector: REIT - Retail | |
| MarketCap: 943.414 Millions | |
| Recent Price: 12.40 Smart Investing & Trading Score: 74 | |
| Day Percent Change: -1.04% Day Change: -0.13 | |
| Week Change: 0.98% Year-to-date Change: -11.6% | |
| ROIC Links: Profile News Message Board | |
| Charts:- Daily , Weekly | |
| Add ROIC to Watchlist: View: Get Complete ROIC Trend Analysis ➞ | |
 | EFC Ellington Financial Inc. |
| Sector: Financials | |
| SubSector: Mortgage Investment | |
| MarketCap: 380.239 Millions | |
| Recent Price: 11.55 Smart Investing & Trading Score: 74 | |
| Day Percent Change: -1.03% Day Change: -0.12 | |
| Week Change: 1.14% Year-to-date Change: -9.1% | |
| EFC Links: Profile News Message Board | |
| Charts:- Daily , Weekly | |
| Add EFC to Watchlist: View: Get Complete EFC Trend Analysis ➞ | |
 | WAFD Washington Federal, Inc. |
| Sector: Financials | |
| SubSector: Savings & Loans | |
| MarketCap: 2219.2 Millions | |
| Recent Price: 28.39 Smart Investing & Trading Score: 74 | |
| Day Percent Change: -0.70% Day Change: -0.20 | |
| Week Change: 1.76% Year-to-date Change: -13.9% | |
| WAFD Links: Profile News Message Board | |
| Charts:- Daily , Weekly | |
| Add WAFD to Watchlist: View: Get Complete WAFD Trend Analysis ➞ | |
 | ITIC Investors Title Company |
| Sector: Financials | |
| SubSector: Surety & Title Insurance | |
| MarketCap: 219.518 Millions | |
| Recent Price: 163.63 Smart Investing & Trading Score: 74 | |
| Day Percent Change: -0.50% Day Change: -0.83 | |
| Week Change: 1.2% Year-to-date Change: 0.9% | |
| ITIC Links: Profile News Message Board | |
| Charts:- Daily , Weekly | |
| Add ITIC to Watchlist: View: Get Complete ITIC Trend Analysis ➞ | |
 | TOWN TowneBank |
| Sector: Financials | |
| SubSector: Regional - Mid-Atlantic Banks | |
| MarketCap: 1344.09 Millions | |
| Recent Price: 27.75 Smart Investing & Trading Score: 74 | |
| Day Percent Change: -0.25% Day Change: -0.07 | |
| Week Change: 2.78% Year-to-date Change: -6.8% | |
| TOWN Links: Profile News Message Board | |
| Charts:- Daily , Weekly | |
| Add TOWN to Watchlist: View: Get Complete TOWN Trend Analysis ➞ | |
 | DCOM Dime Community Bancshares, Inc. |
| Sector: Financials | |
| SubSector: Savings & Loans | |
| MarketCap: 477.83 Millions | |
| Recent Price: 19.39 Smart Investing & Trading Score: 74 | |
| Day Percent Change: -0.21% Day Change: -0.04 | |
| Week Change: 3.8% Year-to-date Change: -28.0% | |
| DCOM Links: Profile News Message Board | |
| Charts:- Daily , Weekly | |
| Add DCOM to Watchlist: View: Get Complete DCOM Trend Analysis ➞ | |
 | GTY Getty Realty Corp. |
| Sector: Financials | |
| SubSector: REIT - Retail | |
| MarketCap: 926.114 Millions | |
| Recent Price: 27.38 Smart Investing & Trading Score: 74 | |
| Day Percent Change: -0.18% Day Change: -0.05 | |
| Week Change: 1.44% Year-to-date Change: -6.3% | |
| GTY Links: Profile News Message Board | |
| Charts:- Daily , Weekly | |
| Add GTY to Watchlist: View: Get Complete GTY Trend Analysis ➞ | |
 | LBAI Lakeland Bancorp, Inc. |
| Sector: Financials | |
| SubSector: Regional - Northeast Banks | |
| MarketCap: 534.599 Millions | |
| Recent Price: 12.84 Smart Investing & Trading Score: 74 | |
| Day Percent Change: -0.08% Day Change: -0.01 | |
| Week Change: 7.45% Year-to-date Change: -13.2% | |
| LBAI Links: Profile News Message Board | |
| Charts:- Daily , Weekly | |
| Add LBAI to Watchlist: View: Get Complete LBAI Trend Analysis ➞ | |
 | TCBI Texas Capital Bancshares, Inc. |
| Sector: Financials | |
| SubSector: Regional - Southwest Banks | |
| MarketCap: 1202.75 Millions | |
| Recent Price: 60.12 Smart Investing & Trading Score: 74 | |
| Day Percent Change: -0.07% Day Change: -0.04 | |
| Week Change: 2.45% Year-to-date Change: -7.0% | |
| TCBI Links: Profile News Message Board | |
| Charts:- Daily , Weekly | |
| Add TCBI to Watchlist: View: Get Complete TCBI Trend Analysis ➞ | |
 | HFWA Heritage Financial Corporation |
| Sector: Financials | |
| SubSector: Regional - Pacific Banks | |
| MarketCap: 752.829 Millions | |
| Recent Price: 18.62 Smart Investing & Trading Score: 74 | |
| Day Percent Change: -0.05% Day Change: -0.01 | |
| Week Change: 2.48% Year-to-date Change: -13.0% | |
| HFWA Links: Profile News Message Board | |
| Charts:- Daily , Weekly | |
| Add HFWA to Watchlist: View: Get Complete HFWA Trend Analysis ➞ | |
 | YRD Yiren Digital Ltd. |
| Sector: Financials | |
| SubSector: Credit Services | |
| MarketCap: 330.208 Millions | |
| Recent Price: 5.08 Smart Investing & Trading Score: 73 | |
| Day Percent Change: 1.20% Day Change: 0.06 | |
| Week Change: 5.18% Year-to-date Change: 62.8% | |
| YRD Links: Profile News Message Board | |
| Charts:- Daily , Weekly | |
| Add YRD to Watchlist: View: Get Complete YRD Trend Analysis ➞ | |
 | DRH DiamondRock Hospitality Company |
| Sector: Financials | |
| SubSector: REIT - Hotel/Motel | |
| MarketCap: 964 Millions | |
| Recent Price: 9.22 Smart Investing & Trading Score: 73 | |
| Day Percent Change: 0.77% Day Change: 0.07 | |
| Week Change: 4.42% Year-to-date Change: -1.8% | |
| DRH Links: Profile News Message Board | |
| Charts:- Daily , Weekly | |
| Add DRH to Watchlist: View: Get Complete DRH Trend Analysis ➞ | |
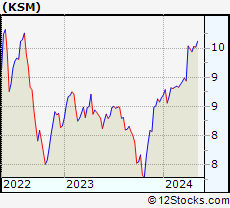 | KSM DWS Strategic Municipal Income Trust |
| Sector: Financials | |
| SubSector: Closed-End Fund - Debt | |
| MarketCap: 103.607 Millions | |
| Recent Price: 9.59 Smart Investing & Trading Score: 73 | |
| Day Percent Change: 0.52% Day Change: 0.05 | |
| Week Change: 1.59% Year-to-date Change: 10.9% | |
| KSM Links: Profile News Message Board | |
| Charts:- Daily , Weekly | |
| Add KSM to Watchlist: View: Get Complete KSM Trend Analysis ➞ | |
 | GGAL Grupo Financiero Galicia S.A. |
| Sector: Financials | |
| SubSector: Foreign Regional Banks | |
| MarketCap: 1274.69 Millions | |
| Recent Price: 29.07 Smart Investing & Trading Score: 73 | |
| Day Percent Change: -4.78% Day Change: -1.46 | |
| Week Change: 2.14% Year-to-date Change: 68.4% | |
| GGAL Links: Profile News Message Board | |
| Charts:- Daily , Weekly | |
| Add GGAL to Watchlist: View: Get Complete GGAL Trend Analysis ➞ | |
 | BSIG BrightSphere Investment Group Inc. |
| Sector: Financials | |
| SubSector: Asset Management | |
| MarketCap: 430.103 Millions | |
| Recent Price: 23.08 Smart Investing & Trading Score: 73 | |
| Day Percent Change: -1.83% Day Change: -0.43 | |
| Week Change: 0.35% Year-to-date Change: 20.5% | |
| BSIG Links: Profile News Message Board | |
| Charts:- Daily , Weekly | |
| Add BSIG to Watchlist: View: Get Complete BSIG Trend Analysis ➞ | |
 | HLI Houlihan Lokey, Inc. |
| Sector: Financials | |
| SubSector: Investment Brokerage - National | |
| MarketCap: 3352.65 Millions | |
| Recent Price: 128.00 Smart Investing & Trading Score: 73 | |
| Day Percent Change: -1.33% Day Change: -1.72 | |
| Week Change: 3.42% Year-to-date Change: 6.8% | |
| HLI Links: Profile News Message Board | |
| Charts:- Daily , Weekly | |
| Add HLI to Watchlist: View: Get Complete HLI Trend Analysis ➞ | |
 | VCTR Victory Capital Holdings, Inc. |
| Sector: Financials | |
| SubSector: Asset Management | |
| MarketCap: 1148.33 Millions | |
| Recent Price: 50.02 Smart Investing & Trading Score: 73 | |
| Day Percent Change: -1.22% Day Change: -0.62 | |
| Week Change: 5.31% Year-to-date Change: 45.2% | |
| VCTR Links: Profile News Message Board | |
| Charts:- Daily , Weekly | |
| Add VCTR to Watchlist: View: Get Complete VCTR Trend Analysis ➞ | |
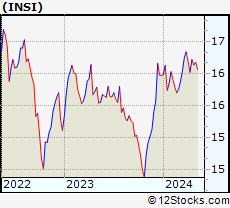 | INSI Insight Select Income Fund |
| Sector: Financials | |
| SubSector: Asset Management | |
| MarketCap: 174.003 Millions | |
| Recent Price: 16.20 Smart Investing & Trading Score: 73 | |
| Day Percent Change: -0.67% Day Change: -0.11 | |
| Week Change: -0.12% Year-to-date Change: 1.4% | |
| INSI Links: Profile News Message Board | |
| Charts:- Daily , Weekly | |
| Add INSI to Watchlist: View: Get Complete INSI Trend Analysis ➞ | |
 | ORI Old Republic International Corporation |
| Sector: Financials | |
| SubSector: Property & Casualty Insurance | |
| MarketCap: 4420.92 Millions | |
| Recent Price: 30.30 Smart Investing & Trading Score: 73 | |
| Day Percent Change: -0.03% Day Change: -0.01 | |
| Week Change: 1.81% Year-to-date Change: 3.1% | |
| ORI Links: Profile News Message Board | |
| Charts:- Daily , Weekly | |
| Add ORI to Watchlist: View: Get Complete ORI Trend Analysis ➞ | |
 | CMA Comerica Incorporated |
| Sector: Financials | |
| SubSector: Money Center Banks | |
| MarketCap: 4449.49 Millions | |
| Recent Price: 52.95 Smart Investing & Trading Score: 73 | |
| Day Percent Change: 0.59% Day Change: 0.31 | |
| Week Change: 2.7% Year-to-date Change: -5.1% | |
| CMA Links: Profile News Message Board | |
| Charts:- Daily , Weekly | |
| Add CMA to Watchlist: View: Get Complete CMA Trend Analysis ➞ | |
 | WABC Westamerica Bancorporation |
| Sector: Financials | |
| SubSector: Regional - Pacific Banks | |
| MarketCap: 1557.69 Millions | |
| Recent Price: 47.86 Smart Investing & Trading Score: 73 | |
| Day Percent Change: 0.21% Day Change: 0.10 | |
| Week Change: 2.31% Year-to-date Change: -15.2% | |
| WABC Links: Profile News Message Board | |
| Charts:- Daily , Weekly | |
| Add WABC to Watchlist: View: Get Complete WABC Trend Analysis ➞ | |
 | LND BrasilAgro - Companhia Brasileira de Propriedades Agricolas |
| Sector: Financials | |
| SubSector: Property Management | |
| MarketCap: 157.842 Millions | |
| Recent Price: 4.99 Smart Investing & Trading Score: 73 | |
| Day Percent Change: 0.00% Day Change: 0.00 | |
| Week Change: -0.4% Year-to-date Change: -5.5% | |
| LND Links: Profile News Message Board | |
| Charts:- Daily , Weekly | |
| Add LND to Watchlist: View: Get Complete LND Trend Analysis ➞ | |
 | JHS John Hancock Income Securities Trust |
| Sector: Financials | |
| SubSector: Closed-End Fund - Debt | |
| MarketCap: 137.107 Millions | |
| Recent Price: 10.99 Smart Investing & Trading Score: 73 | |
| Day Percent Change: -0.36% Day Change: -0.04 | |
| Week Change: 0.27% Year-to-date Change: 1.0% | |
| JHS Links: Profile News Message Board | |
| Charts:- Daily , Weekly | |
| Add JHS to Watchlist: View: Get Complete JHS Trend Analysis ➞ | |
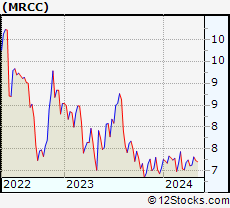 | MRCC Monroe Capital Corporation |
| Sector: Financials | |
| SubSector: Mortgage Investment | |
| MarketCap: 139.439 Millions | |
| Recent Price: 7.28 Smart Investing & Trading Score: 72 | |
| Day Percent Change: 0.97% Day Change: 0.07 | |
| Week Change: 2.03% Year-to-date Change: 3.0% | |
| MRCC Links: Profile News Message Board | |
| Charts:- Daily , Weekly | |
| Add MRCC to Watchlist: View: Get Complete MRCC Trend Analysis ➞ | |
| For tabular summary view of above stock list: Summary View ➞ 0 - 25 , 25 - 50 , 50 - 75 , 75 - 100 , 100 - 125 , 125 - 150 , 150 - 175 , 175 - 200 , 200 - 225 , 225 - 250 , 250 - 275 , 275 - 300 , 300 - 325 , 325 - 350 , 350 - 375 , 375 - 400 , 400 - 425 , 425 - 450 , 450 - 475 , 475 - 500 , 500 - 525 , 525 - 550 , 550 - 575 , 575 - 600 , 600 - 625 , 625 - 650 , 650 - 675 , 675 - 700 , 700 - 725 , 725 - 750 , 750 - 775 , 775 - 800 , 800 - 825 , 825 - 850 , 850 - 875 , 875 - 900 , 900 - 925 , 925 - 950 , 950 - 975 , 975 - 1000 , 1000 - 1025 , 1025 - 1050 , 1050 - 1075 , 1075 - 1100 , 1100 - 1125 , 1125 - 1150 , 1150 - 1175 , 1175 - 1200 , 1200 - 1225 , 1225 - 1250 | ||
| Click To Change The Sort Order: By Market Cap or Company Size Performance: Year-to-date, Week and Day | |
| Select Chart Type: | ||
|
Best Stocks Today 12Stocks.com |
© 2024 12Stocks.com Terms & Conditions Privacy Contact Us
All Information Provided Only For Education And Not To Be Used For Investing or Trading. See Terms & Conditions


One More Thing ... Get Best Stocks Delivered Daily!
Never Ever Miss A Move With Our Top Ten Stocks Lists
Find Best Stocks In Any Market - Bull or Bear Market
Take A Peek At Our Top Ten Stocks Lists: Daily, Weekly, Year-to-Date & Top Trends
Find Best Stocks In Any Market - Bull or Bear Market
Take A Peek At Our Top Ten Stocks Lists: Daily, Weekly, Year-to-Date & Top Trends
Financial Stocks With Best Up Trends [0-bearish to 100-bullish]: B. Riley[100], Trustmark [100], Synchrony [100], MBIA [100], Prosperity Bancshares[100], First Ban[100], Virtu [100], East West[100], Equity Residential[100], Essex Property[100], BOK [100]
Best Financial Stocks Year-to-Date:
Root [473.26%], Hippo [130.79%], Gladstone Capital[98.5%], Banco Macro[70.66%], Grupo Financiero[68.38%], Yiren Digital[62.82%], Banco BBVA[62.68%], Heritage Insurance[61.04%], EverQuote [59.4%], Fidelis Insurance[55.01%], First [52.08%] Best Financial Stocks This Week:
B. Riley[48.82%], Oportun [39.66%], Cipher Mining[22.14%], Globe Life[17.77%], Root [16%], Sierra Bancorp[11.47%], Provident Bancorp[10.91%], TOP [10.64%], Trustmark [9.84%], LendingTree [9.84%], Coinbase Global[9.74%] Best Financial Stocks Daily:
B. Riley[36.97%], CoStar [8.66%], Offerpad [7.14%], Pegasus Digital[6.93%], Trustmark [6.57%], Provident Bancorp[6.54%], Waterstone [6.41%], EverQuote [5.46%], Stock Yards[5.30%], Trupanion [5.10%], Bank of N.T. Butterfield & Son[5.09%]