
 Login Sign Up


| |||||
 |  | ||||

| 12Stocks.com Market Intelligence |
Best Financial Stocks
| In a hurry? Financial Stocks Lists: Performance Trends Table, Stock Charts
Sort Financial stocks: Daily, Weekly, Year-to-Date, Market Cap & Trends. Filter Financial stocks list by size:All Financial Large Mid-Range Small & MicroCap |
| 12Stocks.com Financial Stocks Performances & Trends Daily | |||||||||
|
|  The overall Smart Investing & Trading Score is 63 (0-bearish to 100-bullish) which puts Financial sector in short term neutral to bullish trend. The Smart Investing & Trading Score from previous trading session is 56 and hence an improvement of trend.
| ||||||||
Here are the Smart Investing & Trading Scores of the most requested Financial stocks at 12Stocks.com (click stock name for detailed review):
|


| 12Stocks.com: Investing in Financial sector with Stocks | |
|
The following table helps investors and traders sort through current performance and trends (as measured by Smart Investing & Trading Score) of various
stocks in the Financial sector. Quick View: Move mouse or cursor over stock symbol (ticker) to view short-term Technical chart and over stock name to view long term chart. Click on  to add stock symbol to your watchlist and to add stock symbol to your watchlist and  to view watchlist. Click on any ticker or stock name for detailed market intelligence report for that stock. to view watchlist. Click on any ticker or stock name for detailed market intelligence report for that stock. |
12Stocks.com Performance of Stocks in Financial Sector
| Ticker | Stock Name | Watchlist | Category | Recent Price | Trend Score | Change % | YTD Change% |
| HMST | HomeStreet |   | S&L | 12.68 | 42 | 3.76% | 23.11% |
| ORRF | Orrstown | | Regional Banks | 25.96 | 42 | 3.72% | -12.00% |
| INBK | First Internet | | Regional Banks | 32.18 | 42 | 3.71% | 33.03% |
| FCBC | First Community | | Regional Banks | 33.10 | 42 | 3.70% | -10.78% |
| FMNB | Farmers National | | Regional Banks | 12.41 | 42 | 3.59% | -14.12% |
| BOH | Bank of Hawaii | | Regional Banks | 58.40 | 42 | 3.58% | -19.40% |
| TCBX | Third Coast | | Banks - Regional | 19.14 | 42 | 3.57% | -4.35% |
| NBHC | National Bank | | Regional Banks | 33.99 | 42 | 3.56% | -8.60% |
| FBNC | First Bancorp | | Regional Banks | 32.31 | 42 | 3.36% | -12.70% |
| IBCP | Independent Bank | | Regional Banks | 24.36 | 42 | 3.31% | -6.38% |
| PWOD | Penns Woods | | Regional Banks | 17.96 | 42 | 3.28% | -20.21% |
| HTH | Hilltop | | Mortgage | 29.99 | 42 | 3.24% | -14.83% |
| PKST | Peakstone Realty | | REIT - | 12.88 | 42 | 3.21% | -37.23% |
| CNOB | ConnectOne Bancorp | | Regional Banks | 18.64 | 42 | 2.98% | -18.64% |
| PFIS | Peoples | | Regional Banks | 38.09 | 42 | 2.97% | -21.79% |
| NRIM | Northrim BanCorp | | Regional Banks | 46.39 | 42 | 2.93% | -18.91% |
| FBIZ | First Business | | Regional Banks | 34.30 | 42 | 2.91% | -14.46% |
| AFL | Aflac | | Insurance | 83.23 | 42 | 2.78% | 0.88% |
| FG | F&G Annuities | | Insurance - Life | 36.52 | 42 | 2.61% | -20.79% |
| KIM | Kimco Realty | | REIT - Retail | 18.20 | 42 | 2.59% | -14.59% |
| BFS | Saul Centers | | REIT - Retail | 36.36 | 42 | 2.57% | -7.41% |
| CZNC | Citizens & Northern | | Regional Banks | 17.73 | 42 | 2.54% | -20.95% |
| ASB | Associated Banc-Corp | | Regional Banks | 20.55 | 42 | 2.54% | -3.93% |
| TBNK | Territorial Bancorp | | Regional Banks | 7.20 | 42 | 2.42% | -35.43% |
| LAND | Gladstone Land | | REIT - | 12.69 | 42 | 2.42% | -12.18% |
| For chart view version of above stock list: Chart View ➞ 0 - 25 , 25 - 50 , 50 - 75 , 75 - 100 , 100 - 125 , 125 - 150 , 150 - 175 , 175 - 200 , 200 - 225 , 225 - 250 , 250 - 275 , 275 - 300 , 300 - 325 , 325 - 350 , 350 - 375 , 375 - 400 , 400 - 425 , 425 - 450 , 450 - 475 , 475 - 500 , 500 - 525 , 525 - 550 , 550 - 575 , 575 - 600 , 600 - 625 , 625 - 650 , 650 - 675 , 675 - 700 , 700 - 725 , 725 - 750 , 750 - 775 , 775 - 800 , 800 - 825 , 825 - 850 , 850 - 875 , 875 - 900 , 900 - 925 , 925 - 950 , 950 - 975 , 975 - 1000 , 1000 - 1025 , 1025 - 1050 , 1050 - 1075 , 1075 - 1100 , 1100 - 1125 , 1125 - 1150 , 1150 - 1175 , 1175 - 1200 , 1200 - 1225 , 1225 - 1250 | ||
 | Click To Change The Sort Order: By Market Cap or Company Size Performance: Year-to-date, Week and Day |  |
|
Get the most comprehensive stock market coverage daily at 12Stocks.com ➞ Best Stocks Today ➞ Best Stocks Weekly ➞ Best Stocks Year-to-Date ➞ Best Stocks Trends ➞  Best Stocks Today 12Stocks.com Best Nasdaq Stocks ➞ Best S&P 500 Stocks ➞ Best Tech Stocks ➞ Best Biotech Stocks ➞ |
| Detailed Overview of Financial Stocks |
| Financial Technical Overview, Leaders & Laggards, Top Financial ETF Funds & Detailed Financial Stocks List, Charts, Trends & More |
| Financial Sector: Technical Analysis, Trends & YTD Performance | |
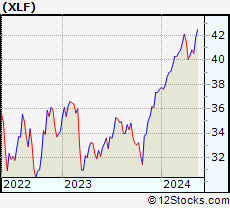
| Financial sector is composed of stocks
from banks, brokers, insurance, REITs
and services subsectors. Financial sector, as represented by XLF, an exchange-traded fund [ETF] that holds basket of Financial stocks (e.g, Bank of America, Goldman Sachs) is up by 7.39% and is currently outperforming the overall market by 4.01% year-to-date. Below is a quick view of Technical charts and trends: |
|
 XLF Weekly Chart |
|
| Long Term Trend: Very Good | |
| Medium Term Trend: Not Good | |
 XLF Daily Chart |
|
| Short Term Trend: Very Good | |
| Overall Trend Score: 63 | |
| YTD Performance: 7.39% | |
| **Trend Scores & Views Are Only For Educational Purposes And Not For Investing | |
| 12Stocks.com: Top Performing Financial Sector Stocks | ||||||||||||||||||||||||||||||||||||||||||||||||
 The top performing Financial sector stocks year to date are
Now, more recently, over last week, the top performing Financial sector stocks on the move are


|
||||||||||||||||||||||||||||||||||||||||||||||||
| 12Stocks.com: Investing in Financial Sector using Exchange Traded Funds | |
|
The following table shows list of key exchange traded funds (ETF) that
help investors track Financial Index. For detailed view, check out our ETF Funds section of our website. Quick View: Move mouse or cursor over ETF symbol (ticker) to view short-term Technical chart and over ETF name to view long term chart. Click on ticker or stock name for detailed view. Click on to add stock symbol to your watchlist and to view watchlist. |
12Stocks.com List of ETFs that track Financial Index
| Ticker | ETF Name | Watchlist | Recent Price | Smart Investing & Trading Score | Change % | Week % | Year-to-date % |
| XLF | Financial | | 40.38 | 63 | 1.38 | 0.8 | 7.39% |
| IAI | Broker-Dealers & Secs | | 111.03 | 63 | 0.47 | 0.18 | 2.3% |
| IYF | Financials | | 91.30 | 63 | 1.40 | 0.83 | 6.9% |
| IYG | Financial Services | | 63.42 | 63 | 1.19 | 0.33 | 6.16% |
| KRE | Regional Banking | | 47.32 | 42 | 2.62 | 1.72 | -9.75% |
| IXG | Global Financials | | 82.86 | 63 | 0.64 | 0.24 | 5.45% |
| VFH | Financials | | 97.75 | 63 | 1.40 | 0.59 | 5.95% |
| KBE | Bank | | 44.41 | 42 | 2.33 | 1.42 | -3.5% |
| FAS | Financial Bull 3X | | 97.93 | 63 | 4.03 | 1.78 | 18.49% |
| FAZ | Financial Bear 3X | | 11.20 | 32 | -3.95 | -1.84 | -18.07% |
| UYG | Financials | | 62.44 | 63 | 2.78 | 1.58 | 13.12% |
| IAT | Regional Banks | | 40.74 | 55 | 2.52 | 0.74 | -2.63% |
| KIE | Insurance | | 49.08 | 58 | 1.66 | 1.57 | 8.54% |
| PSCF | SmallCap Financials | | 45.47 | 42 | 1.59 | 0.13 | -7.54% |
| EUFN | Europe Financials | | 21.95 | 63 | 0.37 | 0.27 | 4.72% |
| PGF | Financial Preferred | | 14.53 | 25 | 0.55 | -1.02 | -0.34% |
| 12Stocks.com: Charts, Trends, Fundamental Data and Performances of Financial Stocks | |
|
We now take in-depth look at all Financial stocks including charts, multi-period performances and overall trends (as measured by Smart Investing & Trading Score). One can sort Financial stocks (click link to choose) by Daily, Weekly and by Year-to-Date performances. Also, one can sort by size of the company or by market capitalization. |
| Select Your Default Chart Type: | |||||
| |||||
| Click on stock symbol or name for detailed view. Click on to add stock symbol to your watchlist and to view watchlist. Quick View: Move mouse or cursor over "Daily" to quickly view daily Technical stock chart and over "Weekly" to view weekly Technical stock chart. | |||||

 | HMST HomeStreet, Inc. |
| Sector: Financials | |
| SubSector: Savings & Loans | |
| MarketCap: 535.33 Millions | |
| Recent Price: 12.68 Smart Investing & Trading Score: 42 | |
| Day Percent Change: 3.76% Day Change: 0.46 | |
| Week Change: -1.48% Year-to-date Change: 23.1% | |
| HMST Links: Profile News Message Board | |
| Charts:- Daily , Weekly | |
| Add HMST to Watchlist: View: Get Complete HMST Trend Analysis ➞ | |
 | ORRF Orrstown Financial Services, Inc. |
| Sector: Financials | |
| SubSector: Regional - Northeast Banks | |
| MarketCap: 159.999 Millions | |
| Recent Price: 25.96 Smart Investing & Trading Score: 42 | |
| Day Percent Change: 3.72% Day Change: 0.93 | |
| Week Change: 3.92% Year-to-date Change: -12.0% | |
| ORRF Links: Profile News Message Board | |
| Charts:- Daily , Weekly | |
| Add ORRF to Watchlist: View: Get Complete ORRF Trend Analysis ➞ | |
 | INBK First Internet Bancorp |
| Sector: Financials | |
| SubSector: Regional - Midwest Banks | |
| MarketCap: 149.07 Millions | |
| Recent Price: 32.18 Smart Investing & Trading Score: 42 | |
| Day Percent Change: 3.71% Day Change: 1.15 | |
| Week Change: 2.35% Year-to-date Change: 33.0% | |
| INBK Links: Profile News Message Board | |
| Charts:- Daily , Weekly | |
| Add INBK to Watchlist: View: Get Complete INBK Trend Analysis ➞ | |
 | FCBC First Community Bankshares, Inc. |
| Sector: Financials | |
| SubSector: Regional - Mid-Atlantic Banks | |
| MarketCap: 393.459 Millions | |
| Recent Price: 33.10 Smart Investing & Trading Score: 42 | |
| Day Percent Change: 3.70% Day Change: 1.18 | |
| Week Change: 3.02% Year-to-date Change: -10.8% | |
| FCBC Links: Profile News Message Board | |
| Charts:- Daily , Weekly | |
| Add FCBC to Watchlist: View: Get Complete FCBC Trend Analysis ➞ | |
 | FMNB Farmers National Banc Corp. |
| Sector: Financials | |
| SubSector: Regional - Midwest Banks | |
| MarketCap: 366.57 Millions | |
| Recent Price: 12.41 Smart Investing & Trading Score: 42 | |
| Day Percent Change: 3.59% Day Change: 0.43 | |
| Week Change: 2.39% Year-to-date Change: -14.1% | |
| FMNB Links: Profile News Message Board | |
| Charts:- Daily , Weekly | |
| Add FMNB to Watchlist: View: Get Complete FMNB Trend Analysis ➞ | |
 | BOH Bank of Hawaii Corporation |
| Sector: Financials | |
| SubSector: Regional - Pacific Banks | |
| MarketCap: 2305.19 Millions | |
| Recent Price: 58.40 Smart Investing & Trading Score: 42 | |
| Day Percent Change: 3.58% Day Change: 2.02 | |
| Week Change: 0.21% Year-to-date Change: -19.4% | |
| BOH Links: Profile News Message Board | |
| Charts:- Daily , Weekly | |
| Add BOH to Watchlist: View: Get Complete BOH Trend Analysis ➞ | |
 | TCBX Third Coast Bancshares, Inc. |
| Sector: Financials | |
| SubSector: Banks - Regional | |
| MarketCap: 212 Millions | |
| Recent Price: 19.14 Smart Investing & Trading Score: 42 | |
| Day Percent Change: 3.57% Day Change: 0.66 | |
| Week Change: 3.46% Year-to-date Change: -4.4% | |
| TCBX Links: Profile News Message Board | |
| Charts:- Daily , Weekly | |
| Add TCBX to Watchlist: View: Get Complete TCBX Trend Analysis ➞ | |
 | NBHC National Bank Holdings Corporation |
| Sector: Financials | |
| SubSector: Regional - Midwest Banks | |
| MarketCap: 766.87 Millions | |
| Recent Price: 33.99 Smart Investing & Trading Score: 42 | |
| Day Percent Change: 3.56% Day Change: 1.17 | |
| Week Change: 2.41% Year-to-date Change: -8.6% | |
| NBHC Links: Profile News Message Board | |
| Charts:- Daily , Weekly | |
| Add NBHC to Watchlist: View: Get Complete NBHC Trend Analysis ➞ | |
 | FBNC First Bancorp |
| Sector: Financials | |
| SubSector: Regional - Mid-Atlantic Banks | |
| MarketCap: 664.959 Millions | |
| Recent Price: 32.31 Smart Investing & Trading Score: 42 | |
| Day Percent Change: 3.36% Day Change: 1.05 | |
| Week Change: -1.13% Year-to-date Change: -12.7% | |
| FBNC Links: Profile News Message Board | |
| Charts:- Daily , Weekly | |
| Add FBNC to Watchlist: View: Get Complete FBNC Trend Analysis ➞ | |
 | IBCP Independent Bank Corporation |
| Sector: Financials | |
| SubSector: Regional - Midwest Banks | |
| MarketCap: 273.67 Millions | |
| Recent Price: 24.36 Smart Investing & Trading Score: 42 | |
| Day Percent Change: 3.31% Day Change: 0.78 | |
| Week Change: 4.64% Year-to-date Change: -6.4% | |
| IBCP Links: Profile News Message Board | |
| Charts:- Daily , Weekly | |
| Add IBCP to Watchlist: View: Get Complete IBCP Trend Analysis ➞ | |
 | PWOD Penns Woods Bancorp, Inc. |
| Sector: Financials | |
| SubSector: Regional - Mid-Atlantic Banks | |
| MarketCap: 152.559 Millions | |
| Recent Price: 17.96 Smart Investing & Trading Score: 42 | |
| Day Percent Change: 3.28% Day Change: 0.57 | |
| Week Change: 0.62% Year-to-date Change: -20.2% | |
| PWOD Links: Profile News Message Board | |
| Charts:- Daily , Weekly | |
| Add PWOD to Watchlist: View: Get Complete PWOD Trend Analysis ➞ | |
 | HTH Hilltop Holdings Inc. |
| Sector: Financials | |
| SubSector: Mortgage Investment | |
| MarketCap: 1317.89 Millions | |
| Recent Price: 29.99 Smart Investing & Trading Score: 42 | |
| Day Percent Change: 3.24% Day Change: 0.94 | |
| Week Change: 1.59% Year-to-date Change: -14.8% | |
| HTH Links: Profile News Message Board | |
| Charts:- Daily , Weekly | |
| Add HTH to Watchlist: View: Get Complete HTH Trend Analysis ➞ | |
 | PKST Peakstone Realty Trust |
| Sector: Financials | |
| SubSector: REIT - Diversified | |
| MarketCap: 1050 Millions | |
| Recent Price: 12.88 Smart Investing & Trading Score: 42 | |
| Day Percent Change: 3.21% Day Change: 0.40 | |
| Week Change: -6.46% Year-to-date Change: -37.2% | |
| PKST Links: Profile News Message Board | |
| Charts:- Daily , Weekly | |
| Add PKST to Watchlist: View: Get Complete PKST Trend Analysis ➞ | |
 | CNOB ConnectOne Bancorp, Inc. |
| Sector: Financials | |
| SubSector: Regional - Northeast Banks | |
| MarketCap: 491.899 Millions | |
| Recent Price: 18.64 Smart Investing & Trading Score: 42 | |
| Day Percent Change: 2.98% Day Change: 0.54 | |
| Week Change: 4.37% Year-to-date Change: -18.6% | |
| CNOB Links: Profile News Message Board | |
| Charts:- Daily , Weekly | |
| Add CNOB to Watchlist: View: Get Complete CNOB Trend Analysis ➞ | |
 | PFIS Peoples Financial Services Corp. |
| Sector: Financials | |
| SubSector: Regional - Northeast Banks | |
| MarketCap: 305.499 Millions | |
| Recent Price: 38.09 Smart Investing & Trading Score: 42 | |
| Day Percent Change: 2.97% Day Change: 1.10 | |
| Week Change: 1.87% Year-to-date Change: -21.8% | |
| PFIS Links: Profile News Message Board | |
| Charts:- Daily , Weekly | |
| Add PFIS to Watchlist: View: Get Complete PFIS Trend Analysis ➞ | |
 | NRIM Northrim BanCorp, Inc. |
| Sector: Financials | |
| SubSector: Regional - Pacific Banks | |
| MarketCap: 147.629 Millions | |
| Recent Price: 46.39 Smart Investing & Trading Score: 42 | |
| Day Percent Change: 2.93% Day Change: 1.32 | |
| Week Change: 2.41% Year-to-date Change: -18.9% | |
| NRIM Links: Profile News Message Board | |
| Charts:- Daily , Weekly | |
| Add NRIM to Watchlist: View: Get Complete NRIM Trend Analysis ➞ | |
 | FBIZ First Business Financial Services, Inc. |
| Sector: Financials | |
| SubSector: Regional - Midwest Banks | |
| MarketCap: 144.97 Millions | |
| Recent Price: 34.30 Smart Investing & Trading Score: 42 | |
| Day Percent Change: 2.91% Day Change: 0.97 | |
| Week Change: 0.15% Year-to-date Change: -14.5% | |
| FBIZ Links: Profile News Message Board | |
| Charts:- Daily , Weekly | |
| Add FBIZ to Watchlist: View: Get Complete FBIZ Trend Analysis ➞ | |
 | AFL Aflac Incorporated |
| Sector: Financials | |
| SubSector: Accident & Health Insurance | |
| MarketCap: 22706 Millions | |
| Recent Price: 83.23 Smart Investing & Trading Score: 42 | |
| Day Percent Change: 2.78% Day Change: 2.25 | |
| Week Change: 3.67% Year-to-date Change: 0.9% | |
| AFL Links: Profile News Message Board | |
| Charts:- Daily , Weekly | |
| Add AFL to Watchlist: View: Get Complete AFL Trend Analysis ➞ | |
 | FG F&G Annuities & Life, Inc. |
| Sector: Financials | |
| SubSector: Insurance - Life | |
| MarketCap: 2960 Millions | |
| Recent Price: 36.52 Smart Investing & Trading Score: 42 | |
| Day Percent Change: 2.61% Day Change: 0.93 | |
| Week Change: -0.52% Year-to-date Change: -20.8% | |
| FG Links: Profile News Message Board | |
| Charts:- Daily , Weekly | |
| Add FG to Watchlist: View: Get Complete FG Trend Analysis ➞ | |
 | KIM Kimco Realty Corporation |
| Sector: Financials | |
| SubSector: REIT - Retail | |
| MarketCap: 5358.64 Millions | |
| Recent Price: 18.20 Smart Investing & Trading Score: 42 | |
| Day Percent Change: 2.59% Day Change: 0.46 | |
| Week Change: 0.55% Year-to-date Change: -14.6% | |
| KIM Links: Profile News Message Board | |
| Charts:- Daily , Weekly | |
| Add KIM to Watchlist: View: Get Complete KIM Trend Analysis ➞ | |
 | BFS Saul Centers, Inc. |
| Sector: Financials | |
| SubSector: REIT - Retail | |
| MarketCap: 689.914 Millions | |
| Recent Price: 36.36 Smart Investing & Trading Score: 42 | |
| Day Percent Change: 2.57% Day Change: 0.91 | |
| Week Change: 0.33% Year-to-date Change: -7.4% | |
| BFS Links: Profile News Message Board | |
| Charts:- Daily , Weekly | |
| Add BFS to Watchlist: View: Get Complete BFS Trend Analysis ➞ | |
 | CZNC Citizens & Northern Corporation |
| Sector: Financials | |
| SubSector: Regional - Mid-Atlantic Banks | |
| MarketCap: 274.459 Millions | |
| Recent Price: 17.73 Smart Investing & Trading Score: 42 | |
| Day Percent Change: 2.54% Day Change: 0.44 | |
| Week Change: 4.05% Year-to-date Change: -21.0% | |
| CZNC Links: Profile News Message Board | |
| Charts:- Daily , Weekly | |
| Add CZNC to Watchlist: View: Get Complete CZNC Trend Analysis ➞ | |
 | ASB Associated Banc-Corp |
| Sector: Financials | |
| SubSector: Regional - Midwest Banks | |
| MarketCap: 1904.8 Millions | |
| Recent Price: 20.55 Smart Investing & Trading Score: 42 | |
| Day Percent Change: 2.54% Day Change: 0.51 | |
| Week Change: 1.13% Year-to-date Change: -3.9% | |
| ASB Links: Profile News Message Board | |
| Charts:- Daily , Weekly | |
| Add ASB to Watchlist: View: Get Complete ASB Trend Analysis ➞ | |
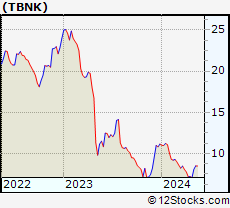 | TBNK Territorial Bancorp Inc. |
| Sector: Financials | |
| SubSector: Regional - Pacific Banks | |
| MarketCap: 220.029 Millions | |
| Recent Price: 7.20 Smart Investing & Trading Score: 42 | |
| Day Percent Change: 2.42% Day Change: 0.17 | |
| Week Change: 0.28% Year-to-date Change: -35.4% | |
| TBNK Links: Profile News Message Board | |
| Charts:- Daily , Weekly | |
| Add TBNK to Watchlist: View: Get Complete TBNK Trend Analysis ➞ | |
 | LAND Gladstone Land Corporation |
| Sector: Financials | |
| SubSector: REIT - Diversified | |
| MarketCap: 252.653 Millions | |
| Recent Price: 12.69 Smart Investing & Trading Score: 42 | |
| Day Percent Change: 2.42% Day Change: 0.30 | |
| Week Change: -1.55% Year-to-date Change: -12.2% | |
| LAND Links: Profile News Message Board | |
| Charts:- Daily , Weekly | |
| Add LAND to Watchlist: View: Get Complete LAND Trend Analysis ➞ | |
| For tabular summary view of above stock list: Summary View ➞ 0 - 25 , 25 - 50 , 50 - 75 , 75 - 100 , 100 - 125 , 125 - 150 , 150 - 175 , 175 - 200 , 200 - 225 , 225 - 250 , 250 - 275 , 275 - 300 , 300 - 325 , 325 - 350 , 350 - 375 , 375 - 400 , 400 - 425 , 425 - 450 , 450 - 475 , 475 - 500 , 500 - 525 , 525 - 550 , 550 - 575 , 575 - 600 , 600 - 625 , 625 - 650 , 650 - 675 , 675 - 700 , 700 - 725 , 725 - 750 , 750 - 775 , 775 - 800 , 800 - 825 , 825 - 850 , 850 - 875 , 875 - 900 , 900 - 925 , 925 - 950 , 950 - 975 , 975 - 1000 , 1000 - 1025 , 1025 - 1050 , 1050 - 1075 , 1075 - 1100 , 1100 - 1125 , 1125 - 1150 , 1150 - 1175 , 1175 - 1200 , 1200 - 1225 , 1225 - 1250 | ||
| Click To Change The Sort Order: By Market Cap or Company Size Performance: Year-to-date, Week and Day | |
| Select Chart Type: | ||
|
Best Stocks Today 12Stocks.com |
© 2024 12Stocks.com Terms & Conditions Privacy Contact Us
All Information Provided Only For Education And Not To Be Used For Investing or Trading. See Terms & Conditions


One More Thing ... Get Best Stocks Delivered Daily!
Never Ever Miss A Move With Our Top Ten Stocks Lists
Find Best Stocks In Any Market - Bull or Bear Market
Take A Peek At Our Top Ten Stocks Lists: Daily, Weekly, Year-to-Date & Top Trends
Find Best Stocks In Any Market - Bull or Bear Market
Take A Peek At Our Top Ten Stocks Lists: Daily, Weekly, Year-to-Date & Top Trends
Financial Stocks With Best Up Trends [0-bearish to 100-bullish]: BancFirst [100], Old Second[100], Angel Oak[100], Tejon Ranch[100], United Fire[100], Victory Capital[100], Wells Fargo[100], Macatawa Bank[100], Amerisafe [100], ASA Gold[100], Stellus Capital[100]
Best Financial Stocks Year-to-Date:
Root [394.17%], Hippo [119.76%], Gladstone Capital[96.64%], Banco Macro[73.59%], Grupo Financiero[64.84%], Banco BBVA[57.54%], Yiren Digital[54.81%], First [51.04%], Fidelis Insurance[51.01%], EverQuote [50.25%], Heritage Insurance[46.93%] Best Financial Stocks This Week:
Macatawa Bank[47.34%], Metropolitan Bank[13.32%], Globe Life[12.95%], Medical Properties[10.78%], Victory Capital[10.59%], James River[10.4%], Chemung [10.1%], Southern First[9.19%], Summit [8.28%], BancFirst [7.85%], Bancorp [7.81%] Best Financial Stocks Daily:
Metropolitan Bank[18.01%], Chemung [10.29%], Cohen & Steers[9.50%], Clipper Realty[9.49%], BancFirst [8.86%], Summit [8.45%], Home Bancorp[7.41%], Bar Harbor[6.79%], Southern First[6.38%], American Express[6.23%], Banco BBVA[6.20%]