
 Login Sign Up


| |||||
 |  | ||||

| 12Stocks.com Market Intelligence |
Best Financial Stocks
| In a hurry? Financial Stocks Lists: Performance Trends Table, Stock Charts
Sort Financial stocks: Daily, Weekly, Year-to-Date, Market Cap & Trends. Filter Financial stocks list by size:All Financial Large Mid-Range Small & MicroCap |
| 12Stocks.com Financial Stocks Performances & Trends Daily | |||||||||
|
|  The overall Smart Investing & Trading Score is 58 (0-bearish to 100-bullish) which puts Financial sector in short term neutral trend. The Smart Investing & Trading Score from previous trading session is 63 and hence a deterioration of trend.
| ||||||||
Here are the Smart Investing & Trading Scores of the most requested Financial stocks at 12Stocks.com (click stock name for detailed review):
|


| 12Stocks.com: Investing in Financial sector with Stocks | |
|
The following table helps investors and traders sort through current performance and trends (as measured by Smart Investing & Trading Score) of various
stocks in the Financial sector. Quick View: Move mouse or cursor over stock symbol (ticker) to view short-term Technical chart and over stock name to view long term chart. Click on  to add stock symbol to your watchlist and to add stock symbol to your watchlist and  to view watchlist. Click on any ticker or stock name for detailed market intelligence report for that stock. to view watchlist. Click on any ticker or stock name for detailed market intelligence report for that stock. |
12Stocks.com Performance of Stocks in Financial Sector
| Ticker | Stock Name | Watchlist | Category | Recent Price | Smart Investing & Trading Score | Change % | YTD Change% |
| CM | Canadian Imperial |   | Banks | 47.40 | 56 | -0.88 | -1.54% |
| USA | Liberty All-Star | | Closed-End Fund - Equity | 6.71 | 51 | -0.89 | 5.17% |
| FRME | First Merchants | | Regional Banks | 33.82 | 73 | -0.91 | -8.79% |
| NYMT | New York | | Mortgage | 6.97 | 32 | -0.92 | -18.23% |
| SKT | Tanger Factory | | REIT - Retail | 28.61 | 71 | -0.93 | 3.21% |
| SHBI | Shore Bancshares | | Regional Banks | 10.43 | 47 | -0.95 | -26.81% |
| AGNC | AGNC | | Mortgage | 9.24 | 30 | -0.96 | -5.81% |
| BOKF | BOK | | Regional - Southwest Banks | 89.95 | 58 | -0.97 | 5.02% |
| SNV | Synovus | | Regional Banks | 36.49 | 15 | -0.98 | -3.08% |
| V | Visa | | Credit Services | 271.84 | 20 | -0.98 | 4.41% |
| WAL | Western Alliance | | Regional Banks | 58.10 | 60 | -0.99 | -11.69% |
| SCM | Stellus Capital | | Asset Mgmt | 14.00 | 63 | -0.99 | 8.95% |
| OHI | Omega Healthcare | | REIT | 30.78 | 66 | -1.00 | 0.39% |
| DX | Dynex Capital | | Mortgage | 11.80 | 74 | -1.01 | -5.75% |
| LKFN | Lakeland | | Regional Banks | 59.16 | 35 | -1.02 | -9.21% |
| HBNC | Horizon Bancorp | | Regional Banks | 11.54 | 42 | -1.03 | -19.36% |
| GHLD | Guild | | Mortgage Finance | 13.49 | 18 | -1.03 | -6.42% |
| LBAI | Lakeland Bancorp | | Regional Banks | 12.39 | 42 | -1.04 | -16.23% |
| BBU | Brookfield Business | | Real Estatet | 18.95 | 0 | -1.04 | -7.92% |
| ZION | Zions Ban | | Regional Banks | 41.32 | 49 | -1.05 | -5.81% |
| BUSE | First Busey | | Regional Banks | 22.56 | 42 | -1.05 | -9.11% |
| BLX | Banco Latinoamericano | | Foreign Banks | 29.27 | 53 | -1.05 | 18.31% |
| NAVI | Navient | | Credit Services | 15.55 | 0 | -1.08 | -16.49% |
| BRP | BRP | | Real Estatet | 26.41 | 60 | -1.09 | 9.95% |
| ORI | Old Republic | | Insurance | 29.80 | 48 | -1.10 | 1.36% |
| For chart view version of above stock list: Chart View ➞ 0 - 25 , 25 - 50 , 50 - 75 , 75 - 100 , 100 - 125 , 125 - 150 , 150 - 175 , 175 - 200 , 200 - 225 , 225 - 250 , 250 - 275 , 275 - 300 , 300 - 325 , 325 - 350 , 350 - 375 , 375 - 400 , 400 - 425 , 425 - 450 , 450 - 475 , 475 - 500 , 500 - 525 , 525 - 550 , 550 - 575 , 575 - 600 , 600 - 625 , 625 - 650 , 650 - 675 , 675 - 700 , 700 - 725 , 725 - 750 , 750 - 775 , 775 - 800 , 800 - 825 , 825 - 850 , 850 - 875 , 875 - 900 , 900 - 925 , 925 - 950 , 950 - 975 , 975 - 1000 , 1000 - 1025 , 1025 - 1050 , 1050 - 1075 , 1075 - 1100 , 1100 - 1125 , 1125 - 1150 , 1150 - 1175 , 1175 - 1200 , 1200 - 1225 , 1225 - 1250 | ||
 | Click To Change The Sort Order: By Market Cap or Company Size Performance: Year-to-date, Week and Day |  |
|
Get the most comprehensive stock market coverage daily at 12Stocks.com ➞ Best Stocks Today ➞ Best Stocks Weekly ➞ Best Stocks Year-to-Date ➞ Best Stocks Trends ➞  Best Stocks Today 12Stocks.com Best Nasdaq Stocks ➞ Best S&P 500 Stocks ➞ Best Tech Stocks ➞ Best Biotech Stocks ➞ |
| Detailed Overview of Financial Stocks |
| Financial Technical Overview, Leaders & Laggards, Top Financial ETF Funds & Detailed Financial Stocks List, Charts, Trends & More |
| Financial Sector: Technical Analysis, Trends & YTD Performance | |
| Financial sector is composed of stocks
from banks, brokers, insurance, REITs
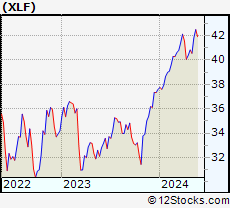
and services subsectors. Financial sector, as represented by XLF, an exchange-traded fund [ETF] that holds basket of Financial stocks (e.g, Bank of America, Goldman Sachs) is up by 8.4% and is currently outperforming the overall market by 1.84% year-to-date. Below is a quick view of Technical charts and trends: |
|
 XLF Weekly Chart |
|
| Long Term Trend: Very Good | |
| Medium Term Trend: Good | |
 XLF Daily Chart |
|
| Short Term Trend: Deteriorating | |
| Overall Trend Score: 58 | |
| YTD Performance: 8.4% | |
| **Trend Scores & Views Are Only For Educational Purposes And Not For Investing | |
| 12Stocks.com: Top Performing Financial Sector Stocks | ||||||||||||||||||||||||||||||||||||||||||||||||
 The top performing Financial sector stocks year to date are
Now, more recently, over last week, the top performing Financial sector stocks on the move are


|
||||||||||||||||||||||||||||||||||||||||||||||||
| 12Stocks.com: Investing in Financial Sector using Exchange Traded Funds | |
|
The following table shows list of key exchange traded funds (ETF) that
help investors track Financial Index. For detailed view, check out our ETF Funds section of our website. Quick View: Move mouse or cursor over ETF symbol (ticker) to view short-term Technical chart and over ETF name to view long term chart. Click on ticker or stock name for detailed view. Click on to add stock symbol to your watchlist and to view watchlist. |
12Stocks.com List of ETFs that track Financial Index
| Ticker | ETF Name | Watchlist | Recent Price | Smart Investing & Trading Score | Change % | Week % | Year-to-date % |
| XLF | Financial | | 40.76 | 58 | -0.15 | -0.15 | 8.4% |
| IAI | Broker-Dealers & Secs | | 112.90 | 75 | -0.10 | -0.1 | 4.03% |
| IYF | Financials | | 92.16 | 76 | -0.01 | -0.01 | 7.9% |
| IYG | Financial Services | | 64.34 | 76 | -0.42 | -0.42 | 7.71% |
| KRE | Regional Banking | | 47.77 | 47 | -0.87 | -0.87 | -8.89% |
| IXG | Global Financials | | 84.35 | 83 | 0.19 | 0.19 | 7.34% |
| VFH | Financials | | 98.74 | 76 | -0.19 | -0.19 | 7.02% |
| KBE | Bank | | 45.10 | 55 | -0.51 | -0.51 | -2% |
| FAS | Financial Bull 3X | | 100.33 | 58 | -0.30 | -0.3 | 21.39% |
| FAZ | Financial Bear 3X | | 10.93 | 42 | 0.64 | 0.64 | -20.04% |
| UYG | Financials | | 63.42 | 53 | -0.36 | -0.36 | 14.89% |
| IAT | Regional Banks | | 41.57 | 73 | -0.36 | -0.36 | -0.65% |
| KIE | Insurance | | 48.79 | 58 | 0.54 | 0.54 | 7.89% |
| PSCF | SmallCap Financials | | 46.33 | 47 | -0.06 | -0.06 | -5.79% |
| EUFN | Europe Financials | | 22.50 | 83 | 0.18 | 0.18 | 7.35% |
| PGF | Financial Preferred | | 14.64 | 39 | 0.48 | 0.48 | 0.41% |
| 12Stocks.com: Charts, Trends, Fundamental Data and Performances of Financial Stocks | |
|
We now take in-depth look at all Financial stocks including charts, multi-period performances and overall trends (as measured by Smart Investing & Trading Score). One can sort Financial stocks (click link to choose) by Daily, Weekly and by Year-to-Date performances. Also, one can sort by size of the company or by market capitalization. |
| Select Your Default Chart Type: | |||||
| |||||
| Click on stock symbol or name for detailed view. Click on to add stock symbol to your watchlist and to view watchlist. Quick View: Move mouse or cursor over "Daily" to quickly view daily Technical stock chart and over "Weekly" to view weekly Technical stock chart. | |||||

 | CM Canadian Imperial Bank of Commerce |
| Sector: Financials | |
| SubSector: Money Center Banks | |
| MarketCap: 27150.5 Millions | |
| Recent Price: 47.40 Smart Investing & Trading Score: 56 | |
| Day Percent Change: -0.88% Day Change: -0.42 | |
| Week Change: -0.88% Year-to-date Change: -1.5% | |
| CM Links: Profile News Message Board | |
| Charts:- Daily , Weekly | |
| Add CM to Watchlist: View: Get Complete CM Trend Analysis ➞ | |
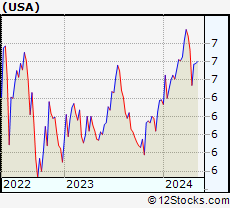 | USA Liberty All-Star Equity Fund |
| Sector: Financials | |
| SubSector: Closed-End Fund - Equity | |
| MarketCap: 839.547 Millions | |
| Recent Price: 6.71 Smart Investing & Trading Score: 51 | |
| Day Percent Change: -0.89% Day Change: -0.06 | |
| Week Change: -0.89% Year-to-date Change: 5.2% | |
| USA Links: Profile News Message Board | |
| Charts:- Daily , Weekly | |
| Add USA to Watchlist: View: Get Complete USA Trend Analysis ➞ | |
 | FRME First Merchants Corporation |
| Sector: Financials | |
| SubSector: Regional - Midwest Banks | |
| MarketCap: 1490.4 Millions | |
| Recent Price: 33.82 Smart Investing & Trading Score: 73 | |
| Day Percent Change: -0.91% Day Change: -0.31 | |
| Week Change: -0.91% Year-to-date Change: -8.8% | |
| FRME Links: Profile News Message Board | |
| Charts:- Daily , Weekly | |
| Add FRME to Watchlist: View: Get Complete FRME Trend Analysis ➞ | |
 | NYMT New York Mortgage Trust, Inc. |
| Sector: Financials | |
| SubSector: Mortgage Investment | |
| MarketCap: 1038.39 Millions | |
| Recent Price: 6.97 Smart Investing & Trading Score: 32 | |
| Day Percent Change: -0.92% Day Change: -0.07 | |
| Week Change: -0.92% Year-to-date Change: -18.2% | |
| NYMT Links: Profile News Message Board | |
| Charts:- Daily , Weekly | |
| Add NYMT to Watchlist: View: Get Complete NYMT Trend Analysis ➞ | |
 | SKT Tanger Factory Outlet Centers, Inc. |
| Sector: Financials | |
| SubSector: REIT - Retail | |
| MarketCap: 720.214 Millions | |
| Recent Price: 28.61 Smart Investing & Trading Score: 71 | |
| Day Percent Change: -0.93% Day Change: -0.27 | |
| Week Change: -0.93% Year-to-date Change: 3.2% | |
| SKT Links: Profile News Message Board | |
| Charts:- Daily , Weekly | |
| Add SKT to Watchlist: View: Get Complete SKT Trend Analysis ➞ | |
 | SHBI Shore Bancshares, Inc. |
| Sector: Financials | |
| SubSector: Regional - Mid-Atlantic Banks | |
| MarketCap: 131.359 Millions | |
| Recent Price: 10.43 Smart Investing & Trading Score: 47 | |
| Day Percent Change: -0.95% Day Change: -0.10 | |
| Week Change: -0.95% Year-to-date Change: -26.8% | |
| SHBI Links: Profile News Message Board | |
| Charts:- Daily , Weekly | |
| Add SHBI to Watchlist: View: Get Complete SHBI Trend Analysis ➞ | |
 | AGNC AGNC Investment Corp. |
| Sector: Financials | |
| SubSector: Mortgage Investment | |
| MarketCap: 6622.19 Millions | |
| Recent Price: 9.24 Smart Investing & Trading Score: 30 | |
| Day Percent Change: -0.96% Day Change: -0.09 | |
| Week Change: -0.96% Year-to-date Change: -5.8% | |
| AGNC Links: Profile News Message Board | |
| Charts:- Daily , Weekly | |
| Add AGNC to Watchlist: View: Get Complete AGNC Trend Analysis ➞ | |
 | BOKF BOK Financial Corporation |
| Sector: Financials | |
| SubSector: Regional - Southwest Banks | |
| MarketCap: 2945.35 Millions | |
| Recent Price: 89.95 Smart Investing & Trading Score: 58 | |
| Day Percent Change: -0.97% Day Change: -0.88 | |
| Week Change: -0.97% Year-to-date Change: 5.0% | |
| BOKF Links: Profile News Message Board | |
| Charts:- Daily , Weekly | |
| Add BOKF to Watchlist: View: Get Complete BOKF Trend Analysis ➞ | |
 | SNV Synovus Financial Corp. |
| Sector: Financials | |
| SubSector: Regional - Mid-Atlantic Banks | |
| MarketCap: 2697.29 Millions | |
| Recent Price: 36.49 Smart Investing & Trading Score: 15 | |
| Day Percent Change: -0.98% Day Change: -0.36 | |
| Week Change: -0.98% Year-to-date Change: -3.1% | |
| SNV Links: Profile News Message Board | |
| Charts:- Daily , Weekly | |
| Add SNV to Watchlist: View: Get Complete SNV Trend Analysis ➞ | |
 | V Visa Inc. |
| Sector: Financials | |
| SubSector: Credit Services | |
| MarketCap: 340798 Millions | |
| Recent Price: 271.84 Smart Investing & Trading Score: 20 | |
| Day Percent Change: -0.98% Day Change: -2.68 | |
| Week Change: -0.98% Year-to-date Change: 4.4% | |
| V Links: Profile News Message Board | |
| Charts:- Daily , Weekly | |
| Add V to Watchlist: View: Get Complete V Trend Analysis ➞ | |
 | WAL Western Alliance Bancorporation |
| Sector: Financials | |
| SubSector: Regional - Pacific Banks | |
| MarketCap: 2980.09 Millions | |
| Recent Price: 58.10 Smart Investing & Trading Score: 60 | |
| Day Percent Change: -0.99% Day Change: -0.58 | |
| Week Change: -0.99% Year-to-date Change: -11.7% | |
| WAL Links: Profile News Message Board | |
| Charts:- Daily , Weekly | |
| Add WAL to Watchlist: View: Get Complete WAL Trend Analysis ➞ | |
 | SCM Stellus Capital Investment Corporation |
| Sector: Financials | |
| SubSector: Asset Management | |
| MarketCap: 127.403 Millions | |
| Recent Price: 14.00 Smart Investing & Trading Score: 63 | |
| Day Percent Change: -0.99% Day Change: -0.14 | |
| Week Change: -0.99% Year-to-date Change: 9.0% | |
| SCM Links: Profile News Message Board | |
| Charts:- Daily , Weekly | |
| Add SCM to Watchlist: View: Get Complete SCM Trend Analysis ➞ | |
 | OHI Omega Healthcare Investors, Inc. |
| Sector: Financials | |
| SubSector: REIT - Healthcare Facilities | |
| MarketCap: 6433.84 Millions | |
| Recent Price: 30.78 Smart Investing & Trading Score: 66 | |
| Day Percent Change: -1.00% Day Change: -0.31 | |
| Week Change: -1% Year-to-date Change: 0.4% | |
| OHI Links: Profile News Message Board | |
| Charts:- Daily , Weekly | |
| Add OHI to Watchlist: View: Get Complete OHI Trend Analysis ➞ | |
 | DX Dynex Capital, Inc. |
| Sector: Financials | |
| SubSector: Mortgage Investment | |
| MarketCap: 327.839 Millions | |
| Recent Price: 11.80 Smart Investing & Trading Score: 74 | |
| Day Percent Change: -1.01% Day Change: -0.12 | |
| Week Change: -1.01% Year-to-date Change: -5.8% | |
| DX Links: Profile News Message Board | |
| Charts:- Daily , Weekly | |
| Add DX to Watchlist: View: Get Complete DX Trend Analysis ➞ | |
 | LKFN Lakeland Financial Corporation |
| Sector: Financials | |
| SubSector: Regional - Midwest Banks | |
| MarketCap: 903.27 Millions | |
| Recent Price: 59.16 Smart Investing & Trading Score: 35 | |
| Day Percent Change: -1.02% Day Change: -0.61 | |
| Week Change: -1.02% Year-to-date Change: -9.2% | |
| LKFN Links: Profile News Message Board | |
| Charts:- Daily , Weekly | |
| Add LKFN to Watchlist: View: Get Complete LKFN Trend Analysis ➞ | |
 | HBNC Horizon Bancorp, Inc. |
| Sector: Financials | |
| SubSector: Regional - Northeast Banks | |
| MarketCap: 405.999 Millions | |
| Recent Price: 11.54 Smart Investing & Trading Score: 42 | |
| Day Percent Change: -1.03% Day Change: -0.12 | |
| Week Change: -1.03% Year-to-date Change: -19.4% | |
| HBNC Links: Profile News Message Board | |
| Charts:- Daily , Weekly | |
| Add HBNC to Watchlist: View: Get Complete HBNC Trend Analysis ➞ | |
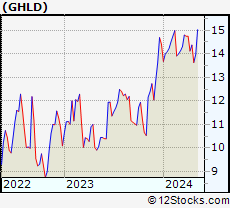 | GHLD Guild Holdings Company |
| Sector: Financials | |
| SubSector: Mortgage Finance | |
| MarketCap: 91157 Millions | |
| Recent Price: 13.49 Smart Investing & Trading Score: 18 | |
| Day Percent Change: -1.03% Day Change: -0.14 | |
| Week Change: -1.03% Year-to-date Change: -6.4% | |
| GHLD Links: Profile News Message Board | |
| Charts:- Daily , Weekly | |
| Add GHLD to Watchlist: View: Get Complete GHLD Trend Analysis ➞ | |
 | LBAI Lakeland Bancorp, Inc. |
| Sector: Financials | |
| SubSector: Regional - Northeast Banks | |
| MarketCap: 534.599 Millions | |
| Recent Price: 12.39 Smart Investing & Trading Score: 42 | |
| Day Percent Change: -1.04% Day Change: -0.13 | |
| Week Change: -1.04% Year-to-date Change: -16.2% | |
| LBAI Links: Profile News Message Board | |
| Charts:- Daily , Weekly | |
| Add LBAI to Watchlist: View: Get Complete LBAI Trend Analysis ➞ | |
 | BBU Brookfield Business Partners L.P. |
| Sector: Financials | |
| SubSector: Real Estate Development | |
| MarketCap: 1612.19 Millions | |
| Recent Price: 18.95 Smart Investing & Trading Score: 0 | |
| Day Percent Change: -1.04% Day Change: -0.20 | |
| Week Change: -1.04% Year-to-date Change: -7.9% | |
| BBU Links: Profile News Message Board | |
| Charts:- Daily , Weekly | |
| Add BBU to Watchlist: View: Get Complete BBU Trend Analysis ➞ | |
 | ZION Zions Bancorporation, National Association |
| Sector: Financials | |
| SubSector: Regional - Pacific Banks | |
| MarketCap: 4577.89 Millions | |
| Recent Price: 41.32 Smart Investing & Trading Score: 49 | |
| Day Percent Change: -1.05% Day Change: -0.44 | |
| Week Change: -1.05% Year-to-date Change: -5.8% | |
| ZION Links: Profile News Message Board | |
| Charts:- Daily , Weekly | |
| Add ZION to Watchlist: View: Get Complete ZION Trend Analysis ➞ | |
 | BUSE First Busey Corporation |
| Sector: Financials | |
| SubSector: Regional - Midwest Banks | |
| MarketCap: 876.97 Millions | |
| Recent Price: 22.56 Smart Investing & Trading Score: 42 | |
| Day Percent Change: -1.05% Day Change: -0.24 | |
| Week Change: -1.05% Year-to-date Change: -9.1% | |
| BUSE Links: Profile News Message Board | |
| Charts:- Daily , Weekly | |
| Add BUSE to Watchlist: View: Get Complete BUSE Trend Analysis ➞ | |
 | BLX Banco Latinoamericano de Comercio Exterior, S.A |
| Sector: Financials | |
| SubSector: Foreign Money Center Banks | |
| MarketCap: 390.471 Millions | |
| Recent Price: 29.27 Smart Investing & Trading Score: 53 | |
| Day Percent Change: -1.05% Day Change: -0.31 | |
| Week Change: -1.05% Year-to-date Change: 18.3% | |
| BLX Links: Profile News Message Board | |
| Charts:- Daily , Weekly | |
| Add BLX to Watchlist: View: Get Complete BLX Trend Analysis ➞ | |
 | NAVI Navient Corporation |
| Sector: Financials | |
| SubSector: Credit Services | |
| MarketCap: 1362.48 Millions | |
| Recent Price: 15.55 Smart Investing & Trading Score: 0 | |
| Day Percent Change: -1.08% Day Change: -0.17 | |
| Week Change: -1.08% Year-to-date Change: -16.5% | |
| NAVI Links: Profile News Message Board | |
| Charts:- Daily , Weekly | |
| Add NAVI to Watchlist: View: Get Complete NAVI Trend Analysis ➞ | |
 | BRP BRP Group, Inc. |
| Sector: Financials | |
| SubSector: Real Estate Development | |
| MarketCap: 741.219 Millions | |
| Recent Price: 26.41 Smart Investing & Trading Score: 60 | |
| Day Percent Change: -1.09% Day Change: -0.29 | |
| Week Change: -1.09% Year-to-date Change: 10.0% | |
| BRP Links: Profile News Message Board | |
| Charts:- Daily , Weekly | |
| Add BRP to Watchlist: View: Get Complete BRP Trend Analysis ➞ | |
 | ORI Old Republic International Corporation |
| Sector: Financials | |
| SubSector: Property & Casualty Insurance | |
| MarketCap: 4420.92 Millions | |
| Recent Price: 29.80 Smart Investing & Trading Score: 48 | |
| Day Percent Change: -1.10% Day Change: -0.33 | |
| Week Change: -1.1% Year-to-date Change: 1.4% | |
| ORI Links: Profile News Message Board | |
| Charts:- Daily , Weekly | |
| Add ORI to Watchlist: View: Get Complete ORI Trend Analysis ➞ | |
| For tabular summary view of above stock list: Summary View ➞ 0 - 25 , 25 - 50 , 50 - 75 , 75 - 100 , 100 - 125 , 125 - 150 , 150 - 175 , 175 - 200 , 200 - 225 , 225 - 250 , 250 - 275 , 275 - 300 , 300 - 325 , 325 - 350 , 350 - 375 , 375 - 400 , 400 - 425 , 425 - 450 , 450 - 475 , 475 - 500 , 500 - 525 , 525 - 550 , 550 - 575 , 575 - 600 , 600 - 625 , 625 - 650 , 650 - 675 , 675 - 700 , 700 - 725 , 725 - 750 , 750 - 775 , 775 - 800 , 800 - 825 , 825 - 850 , 850 - 875 , 875 - 900 , 900 - 925 , 925 - 950 , 950 - 975 , 975 - 1000 , 1000 - 1025 , 1025 - 1050 , 1050 - 1075 , 1075 - 1100 , 1100 - 1125 , 1125 - 1150 , 1150 - 1175 , 1175 - 1200 , 1200 - 1225 , 1225 - 1250 | ||
| Click To Change The Sort Order: By Market Cap or Company Size Performance: Year-to-date, Week and Day | |
| Select Chart Type: | ||
|
Best Stocks Today 12Stocks.com |
© 2024 12Stocks.com Terms & Conditions Privacy Contact Us
All Information Provided Only For Education And Not To Be Used For Investing or Trading. See Terms & Conditions


One More Thing ... Get Best Stocks Delivered Daily!
Never Ever Miss A Move With Our Top Ten Stocks Lists
Find Best Stocks In Any Market - Bull or Bear Market
Take A Peek At Our Top Ten Stocks Lists: Daily, Weekly, Year-to-Date & Top Trends
Find Best Stocks In Any Market - Bull or Bear Market
Take A Peek At Our Top Ten Stocks Lists: Daily, Weekly, Year-to-Date & Top Trends
Financial Stocks With Best Up Trends [0-bearish to 100-bullish]: Heartland [100], Fulton [100], B. Riley[100], ICICI Bank[100], Piedmont Office[100], Douglas Emmett[100], BrasilAgro -[100], LPL [100], Highwoods Properties[100], Stifel [100], iShares ESG[100]
Best Financial Stocks Year-to-Date:
Root [538.11%], Hippo [140.94%], Gladstone Capital[102.15%], Banco Macro[85.19%], B. Riley[83.66%], Grupo Financiero[81.06%], Banco BBVA[72.43%], Yiren Digital[60.9%], EverQuote [59.97%], Fidelis Insurance[58.53%], Heritage Insurance[57.52%] Best Financial Stocks This Week:
Heartland [15.15%], AltC Acquisition[12.57%], Douglas Elliman[10.92%], Fulton [7.55%], NexGen Energy[6.16%], Medical Properties[5.99%], Clipper Realty[5.54%], AlTi Global[4.85%], Citizens [4.81%], B. Riley[4.7%], Peakstone Realty[4.03%] Best Financial Stocks Daily:
Heartland [15.15%], AltC Acquisition[12.57%], Douglas Elliman[10.92%], Fulton [7.55%], NexGen Energy[6.16%], Medical Properties[5.99%], Clipper Realty[5.54%], AlTi Global[4.85%], Citizens [4.81%], B. Riley[4.70%], Peakstone Realty[4.03%]