
 Login Sign Up


| |||||
 |  | ||||

| 12Stocks.com Market Intelligence |
Best Financial Stocks
| In a hurry? Financial Stocks Lists: Performance Trends Table, Stock Charts
Sort Financial stocks: Daily, Weekly, Year-to-Date, Market Cap & Trends. Filter Financial stocks list by size:All Financial Large Mid-Range Small & MicroCap |
| 12Stocks.com Financial Stocks Performances & Trends Daily | |||||||||
|
|  The overall Smart Investing & Trading Score is 63 (0-bearish to 100-bullish) which puts Financial sector in short term neutral to bullish trend. The Smart Investing & Trading Score from previous trading session is 56 and hence an improvement of trend.
| ||||||||
Here are the Smart Investing & Trading Scores of the most requested Financial stocks at 12Stocks.com (click stock name for detailed review):
|


| 12Stocks.com: Investing in Financial sector with Stocks | |
|
The following table helps investors and traders sort through current performance and trends (as measured by Smart Investing & Trading Score) of various
stocks in the Financial sector. Quick View: Move mouse or cursor over stock symbol (ticker) to view short-term Technical chart and over stock name to view long term chart. Click on  to add stock symbol to your watchlist and to add stock symbol to your watchlist and  to view watchlist. Click on any ticker or stock name for detailed market intelligence report for that stock. to view watchlist. Click on any ticker or stock name for detailed market intelligence report for that stock. |
12Stocks.com Performance of Stocks in Financial Sector
| Ticker | Stock Name | Watchlist | Category | Recent Price | Smart Investing & Trading Score | Change % | YTD Change% |
| EQBK | Equity Bancshares |   | Regional Banks | 31.81 | 22 | 2.18 | -6.17% |
| RNST | Renasant | | Banks | 29.39 | 52 | 2.16 | -12.74% |
| COLB | Columbia Banking | | S&L | 18.11 | 52 | 2.11 | -32.10% |
| HFWA | Heritage | | Regional Banks | 17.92 | 52 | 2.11 | -16.22% |
| TFC | Truist | | Regional Banks | 36.47 | 42 | 2.11 | -1.23% |
| ABCB | Ameris Bancorp | | Regional Banks | 45.73 | 42 | 2.10 | -13.80% |
| AUB | Atlantic Union | | Regional Banks | 32.85 | 32 | 2.08 | -10.10% |
| CME | CME | | Brokerage | 214.00 | 76 | 2.07 | 1.61% |
| TYG | Tortoise Energy | | Closed-End Fund - Equity | 31.11 | 88 | 2.07 | 8.13% |
| L | Loews | | Insurance | 75.37 | 58 | 2.07 | 8.31% |
| ORI | Old Republic | | Insurance | 29.72 | 58 | 2.06 | 1.09% |
| MSBI | Midland States | | Regional Banks | 23.28 | 32 | 2.06 | -15.53% |
| FNB | F.N.B | | Regional Banks | 13.02 | 32 | 2.04 | -5.45% |
| MTB | M&T Bank | | Regional Banks | 142.15 | 85 | 2.04 | 3.69% |
| CUBI | Customers Bancorp | | Regional Banks | 47.77 | 32 | 2.02 | -17.09% |
| AROW | Arrow | | Regional Banks | 22.34 | 32 | 2.01 | -20.04% |
| WPC | W. P. | | REIT - | 55.74 | 52 | 2.00 | -13.99% |
| FFIC | Flushing | | S&L | 11.56 | 42 | 1.99 | -29.88% |
| BANR | Banner | | Regional Banks | 44.60 | 42 | 1.99 | -16.73% |
| CADE | Cadence Ban | | Regional Banks | 26.90 | 63 | 1.99 | -9.11% |
| NWBI | Northwest Bancshares | | S&L | 10.99 | 52 | 1.99 | -11.90% |
| CHMI | Cherry Hill | | Mortgage | 3.33 | 42 | 1.99 | -17.70% |
| RGA | Reinsurance | | Life Insurance | 186.09 | 63 | 1.98 | 15.03% |
| SNV | Synovus | | Regional Banks | 34.57 | 0 | 1.98 | -8.18% |
| BMRC | Bank of Marin Bancorp | | Regional Banks | 15.47 | 52 | 1.98 | -29.75% |
| For chart view version of above stock list: Chart View ➞ 0 - 25 , 25 - 50 , 50 - 75 , 75 - 100 , 100 - 125 , 125 - 150 , 150 - 175 , 175 - 200 , 200 - 225 , 225 - 250 , 250 - 275 , 275 - 300 , 300 - 325 , 325 - 350 , 350 - 375 , 375 - 400 , 400 - 425 , 425 - 450 , 450 - 475 , 475 - 500 , 500 - 525 , 525 - 550 , 550 - 575 , 575 - 600 , 600 - 625 , 625 - 650 , 650 - 675 , 675 - 700 , 700 - 725 , 725 - 750 , 750 - 775 , 775 - 800 , 800 - 825 , 825 - 850 , 850 - 875 , 875 - 900 , 900 - 925 , 925 - 950 , 950 - 975 , 975 - 1000 , 1000 - 1025 , 1025 - 1050 , 1050 - 1075 , 1075 - 1100 , 1100 - 1125 , 1125 - 1150 , 1150 - 1175 , 1175 - 1200 , 1200 - 1225 , 1225 - 1250 | ||
 | Click To Change The Sort Order: By Market Cap or Company Size Performance: Year-to-date, Week and Day |  |
|
Get the most comprehensive stock market coverage daily at 12Stocks.com ➞ Best Stocks Today ➞ Best Stocks Weekly ➞ Best Stocks Year-to-Date ➞ Best Stocks Trends ➞  Best Stocks Today 12Stocks.com Best Nasdaq Stocks ➞ Best S&P 500 Stocks ➞ Best Tech Stocks ➞ Best Biotech Stocks ➞ |
| Detailed Overview of Financial Stocks |
| Financial Technical Overview, Leaders & Laggards, Top Financial ETF Funds & Detailed Financial Stocks List, Charts, Trends & More |
| Financial Sector: Technical Analysis, Trends & YTD Performance | |
| Financial sector is composed of stocks
from banks, brokers, insurance, REITs
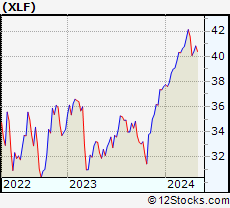
and services subsectors. Financial sector, as represented by XLF, an exchange-traded fund [ETF] that holds basket of Financial stocks (e.g, Bank of America, Goldman Sachs) is up by 7.05% and is currently outperforming the overall market by 3.9% year-to-date. Below is a quick view of Technical charts and trends: |
|
 XLF Weekly Chart |
|
| Long Term Trend: Good | |
| Medium Term Trend: Not Good | |
 XLF Daily Chart |
|
| Short Term Trend: Very Good | |
| Overall Trend Score: 63 | |
| YTD Performance: 7.05% | |
| **Trend Scores & Views Are Only For Educational Purposes And Not For Investing | |
| 12Stocks.com: Top Performing Financial Sector Stocks | ||||||||||||||||||||||||||||||||||||||||||||||||
 The top performing Financial sector stocks year to date are
Now, more recently, over last week, the top performing Financial sector stocks on the move are


|
||||||||||||||||||||||||||||||||||||||||||||||||
| 12Stocks.com: Investing in Financial Sector using Exchange Traded Funds | |
|
The following table shows list of key exchange traded funds (ETF) that
help investors track Financial Index. For detailed view, check out our ETF Funds section of our website. Quick View: Move mouse or cursor over ETF symbol (ticker) to view short-term Technical chart and over ETF name to view long term chart. Click on ticker or stock name for detailed view. Click on to add stock symbol to your watchlist and to view watchlist. |
12Stocks.com List of ETFs that track Financial Index
| Ticker | ETF Name | Watchlist | Recent Price | Smart Investing & Trading Score | Change % | Week % | Year-to-date % |
| XLF | Financial | | 40.25 | 63 | 1.05 | 0.47 | 7.05% |
| IAI | Broker-Dealers & Secs | | 110.77 | 63 | 0.24 | -0.05 | 2.06% |
| IYF | Financials | | 91.04 | 48 | 1.11 | 0.54 | 6.59% |
| IYG | Financial Services | | 63.28 | 48 | 0.97 | 0.11 | 5.93% |
| KRE | Regional Banking | | 46.92 | 27 | 1.77 | 0.87 | -10.5% |
| IXG | Global Financials | | 82.77 | 48 | 0.53 | 0.13 | 5.33% |
| VFH | Financials | | 97.33 | 48 | 0.96 | 0.15 | 5.5% |
| KBE | Bank | | 44.06 | 37 | 1.51 | 0.61 | -4.27% |
| FAS | Financial Bull 3X | | 97.00 | 63 | 3.04 | 0.81 | 17.36% |
| FAZ | Financial Bear 3X | | 11.31 | 32 | -3.00 | -0.88 | -17.26% |
| UYG | Financials | | 62.11 | 63 | 2.24 | 1.04 | 12.52% |
| IAT | Regional Banks | | 40.43 | 27 | 1.74 | -0.02 | -3.37% |
| KIE | Insurance | | 48.93 | 58 | 1.35 | 1.26 | 8.2% |
| PSCF | SmallCap Financials | | 44.76 | 15 | 0.01 | -1.42 | -8.98% |
| EUFN | Europe Financials | | 21.91 | 41 | 0.21 | 0.11 | 4.56% |
| PGF | Financial Preferred | | 14.52 | 17 | 0.48 | -1.09 | -0.41% |
| 12Stocks.com: Charts, Trends, Fundamental Data and Performances of Financial Stocks | |
|
We now take in-depth look at all Financial stocks including charts, multi-period performances and overall trends (as measured by Smart Investing & Trading Score). One can sort Financial stocks (click link to choose) by Daily, Weekly and by Year-to-Date performances. Also, one can sort by size of the company or by market capitalization. |
| Select Your Default Chart Type: | |||||
| |||||
| Click on stock symbol or name for detailed view. Click on to add stock symbol to your watchlist and to view watchlist. Quick View: Move mouse or cursor over "Daily" to quickly view daily Technical stock chart and over "Weekly" to view weekly Technical stock chart. | |||||

 | EQBK Equity Bancshares, Inc. |
| Sector: Financials | |
| SubSector: Regional - Midwest Banks | |
| MarketCap: 272.87 Millions | |
| Recent Price: 31.81 Smart Investing & Trading Score: 22 | |
| Day Percent Change: 2.18% Day Change: 0.68 | |
| Week Change: -1.36% Year-to-date Change: -6.2% | |
| EQBK Links: Profile News Message Board | |
| Charts:- Daily , Weekly | |
| Add EQBK to Watchlist: View: Get Complete EQBK Trend Analysis ➞ | |
 | RNST Renasant Corporation |
| Sector: Financials | |
| SubSector: Money Center Banks | |
| MarketCap: 1279.39 Millions | |
| Recent Price: 29.39 Smart Investing & Trading Score: 52 | |
| Day Percent Change: 2.16% Day Change: 0.62 | |
| Week Change: 2.05% Year-to-date Change: -12.7% | |
| RNST Links: Profile News Message Board | |
| Charts:- Daily , Weekly | |
| Add RNST to Watchlist: View: Get Complete RNST Trend Analysis ➞ | |
 | COLB Columbia Banking System, Inc. |
| Sector: Financials | |
| SubSector: Savings & Loans | |
| MarketCap: 1868.3 Millions | |
| Recent Price: 18.11 Smart Investing & Trading Score: 52 | |
| Day Percent Change: 2.11% Day Change: 0.38 | |
| Week Change: 2.63% Year-to-date Change: -32.1% | |
| COLB Links: Profile News Message Board | |
| Charts:- Daily , Weekly | |
| Add COLB to Watchlist: View: Get Complete COLB Trend Analysis ➞ | |
 | HFWA Heritage Financial Corporation |
| Sector: Financials | |
| SubSector: Regional - Pacific Banks | |
| MarketCap: 752.829 Millions | |
| Recent Price: 17.92 Smart Investing & Trading Score: 52 | |
| Day Percent Change: 2.11% Day Change: 0.37 | |
| Week Change: 3.52% Year-to-date Change: -16.2% | |
| HFWA Links: Profile News Message Board | |
| Charts:- Daily , Weekly | |
| Add HFWA to Watchlist: View: Get Complete HFWA Trend Analysis ➞ | |
 | TFC Truist Financial Corporation |
| Sector: Financials | |
| SubSector: Regional - Southeast Banks | |
| MarketCap: 44928.5 Millions | |
| Recent Price: 36.47 Smart Investing & Trading Score: 42 | |
| Day Percent Change: 2.11% Day Change: 0.76 | |
| Week Change: -0.83% Year-to-date Change: -1.2% | |
| TFC Links: Profile News Message Board | |
| Charts:- Daily , Weekly | |
| Add TFC to Watchlist: View: Get Complete TFC Trend Analysis ➞ | |
 | ABCB Ameris Bancorp |
| Sector: Financials | |
| SubSector: Regional - Mid-Atlantic Banks | |
| MarketCap: 1537.79 Millions | |
| Recent Price: 45.73 Smart Investing & Trading Score: 42 | |
| Day Percent Change: 2.10% Day Change: 0.94 | |
| Week Change: 1.26% Year-to-date Change: -13.8% | |
| ABCB Links: Profile News Message Board | |
| Charts:- Daily , Weekly | |
| Add ABCB to Watchlist: View: Get Complete ABCB Trend Analysis ➞ | |
 | AUB Atlantic Union Bankshares Corporation |
| Sector: Financials | |
| SubSector: Regional - Mid-Atlantic Banks | |
| MarketCap: 1728.79 Millions | |
| Recent Price: 32.85 Smart Investing & Trading Score: 32 | |
| Day Percent Change: 2.08% Day Change: 0.67 | |
| Week Change: 2.46% Year-to-date Change: -10.1% | |
| AUB Links: Profile News Message Board | |
| Charts:- Daily , Weekly | |
| Add AUB to Watchlist: View: Get Complete AUB Trend Analysis ➞ | |
 | CME CME Group Inc. |
| Sector: Financials | |
| SubSector: Investment Brokerage - National | |
| MarketCap: 64145 Millions | |
| Recent Price: 214.00 Smart Investing & Trading Score: 76 | |
| Day Percent Change: 2.07% Day Change: 4.35 | |
| Week Change: 2.15% Year-to-date Change: 1.6% | |
| CME Links: Profile News Message Board | |
| Charts:- Daily , Weekly | |
| Add CME to Watchlist: View: Get Complete CME Trend Analysis ➞ | |
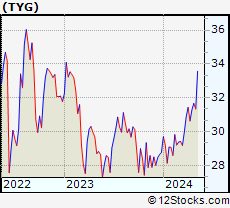 | TYG Tortoise Energy Infrastructure Corporation |
| Sector: Financials | |
| SubSector: Closed-End Fund - Equity | |
| MarketCap: 140.547 Millions | |
| Recent Price: 31.11 Smart Investing & Trading Score: 88 | |
| Day Percent Change: 2.07% Day Change: 0.63 | |
| Week Change: 1.57% Year-to-date Change: 8.1% | |
| TYG Links: Profile News Message Board | |
| Charts:- Daily , Weekly | |
| Add TYG to Watchlist: View: Get Complete TYG Trend Analysis ➞ | |
 | L Loews Corporation |
| Sector: Financials | |
| SubSector: Property & Casualty Insurance | |
| MarketCap: 10768.2 Millions | |
| Recent Price: 75.37 Smart Investing & Trading Score: 58 | |
| Day Percent Change: 2.07% Day Change: 1.53 | |
| Week Change: 1.99% Year-to-date Change: 8.3% | |
| L Links: Profile News Message Board | |
| Charts:- Daily , Weekly | |
| Add L to Watchlist: View: Get Complete L Trend Analysis ➞ | |
 | ORI Old Republic International Corporation |
| Sector: Financials | |
| SubSector: Property & Casualty Insurance | |
| MarketCap: 4420.92 Millions | |
| Recent Price: 29.72 Smart Investing & Trading Score: 58 | |
| Day Percent Change: 2.06% Day Change: 0.60 | |
| Week Change: 1.3% Year-to-date Change: 1.1% | |
| ORI Links: Profile News Message Board | |
| Charts:- Daily , Weekly | |
| Add ORI to Watchlist: View: Get Complete ORI Trend Analysis ➞ | |
 | MSBI Midland States Bancorp, Inc. |
| Sector: Financials | |
| SubSector: Regional - Midwest Banks | |
| MarketCap: 400.27 Millions | |
| Recent Price: 23.28 Smart Investing & Trading Score: 32 | |
| Day Percent Change: 2.06% Day Change: 0.47 | |
| Week Change: -0.6% Year-to-date Change: -15.5% | |
| MSBI Links: Profile News Message Board | |
| Charts:- Daily , Weekly | |
| Add MSBI to Watchlist: View: Get Complete MSBI Trend Analysis ➞ | |
 | FNB F.N.B. Corporation |
| Sector: Financials | |
| SubSector: Regional - Southeast Banks | |
| MarketCap: 2445.55 Millions | |
| Recent Price: 13.02 Smart Investing & Trading Score: 32 | |
| Day Percent Change: 2.04% Day Change: 0.26 | |
| Week Change: -0.23% Year-to-date Change: -5.5% | |
| FNB Links: Profile News Message Board | |
| Charts:- Daily , Weekly | |
| Add FNB to Watchlist: View: Get Complete FNB Trend Analysis ➞ | |
 | MTB M&T Bank Corporation |
| Sector: Financials | |
| SubSector: Regional - Northeast Banks | |
| MarketCap: 13950.9 Millions | |
| Recent Price: 142.15 Smart Investing & Trading Score: 85 | |
| Day Percent Change: 2.04% Day Change: 2.84 | |
| Week Change: 5.64% Year-to-date Change: 3.7% | |
| MTB Links: Profile News Message Board | |
| Charts:- Daily , Weekly | |
| Add MTB to Watchlist: View: Get Complete MTB Trend Analysis ➞ | |
 | CUBI Customers Bancorp, Inc. |
| Sector: Financials | |
| SubSector: Regional - Northeast Banks | |
| MarketCap: 385.399 Millions | |
| Recent Price: 47.77 Smart Investing & Trading Score: 32 | |
| Day Percent Change: 2.02% Day Change: 0.95 | |
| Week Change: -2.54% Year-to-date Change: -17.1% | |
| CUBI Links: Profile News Message Board | |
| Charts:- Daily , Weekly | |
| Add CUBI to Watchlist: View: Get Complete CUBI Trend Analysis ➞ | |
 | AROW Arrow Financial Corporation |
| Sector: Financials | |
| SubSector: Regional - Northeast Banks | |
| MarketCap: 413.999 Millions | |
| Recent Price: 22.34 Smart Investing & Trading Score: 32 | |
| Day Percent Change: 2.01% Day Change: 0.44 | |
| Week Change: 1.87% Year-to-date Change: -20.0% | |
| AROW Links: Profile News Message Board | |
| Charts:- Daily , Weekly | |
| Add AROW to Watchlist: View: Get Complete AROW Trend Analysis ➞ | |
 | WPC W. P. Carey Inc. |
| Sector: Financials | |
| SubSector: REIT - Diversified | |
| MarketCap: 9560.03 Millions | |
| Recent Price: 55.74 Smart Investing & Trading Score: 52 | |
| Day Percent Change: 2.00% Day Change: 1.09 | |
| Week Change: 1.41% Year-to-date Change: -14.0% | |
| WPC Links: Profile News Message Board | |
| Charts:- Daily , Weekly | |
| Add WPC to Watchlist: View: Get Complete WPC Trend Analysis ➞ | |
 | FFIC Flushing Financial Corporation |
| Sector: Financials | |
| SubSector: Savings & Loans | |
| MarketCap: 336.43 Millions | |
| Recent Price: 11.56 Smart Investing & Trading Score: 42 | |
| Day Percent Change: 1.99% Day Change: 0.22 | |
| Week Change: 3.26% Year-to-date Change: -29.9% | |
| FFIC Links: Profile News Message Board | |
| Charts:- Daily , Weekly | |
| Add FFIC to Watchlist: View: Get Complete FFIC Trend Analysis ➞ | |
 | BANR Banner Corporation |
| Sector: Financials | |
| SubSector: Regional - Mid-Atlantic Banks | |
| MarketCap: 1187.09 Millions | |
| Recent Price: 44.60 Smart Investing & Trading Score: 42 | |
| Day Percent Change: 1.99% Day Change: 0.87 | |
| Week Change: 1.55% Year-to-date Change: -16.7% | |
| BANR Links: Profile News Message Board | |
| Charts:- Daily , Weekly | |
| Add BANR to Watchlist: View: Get Complete BANR Trend Analysis ➞ | |
 | CADE Cadence Bancorporation |
| Sector: Financials | |
| SubSector: Regional - Southeast Banks | |
| MarketCap: 756.335 Millions | |
| Recent Price: 26.90 Smart Investing & Trading Score: 63 | |
| Day Percent Change: 1.99% Day Change: 0.52 | |
| Week Change: 0.24% Year-to-date Change: -9.1% | |
| CADE Links: Profile News Message Board | |
| Charts:- Daily , Weekly | |
| Add CADE to Watchlist: View: Get Complete CADE Trend Analysis ➞ | |
 | NWBI Northwest Bancshares, Inc. |
| Sector: Financials | |
| SubSector: Savings & Loans | |
| MarketCap: 1266.3 Millions | |
| Recent Price: 10.99 Smart Investing & Trading Score: 52 | |
| Day Percent Change: 1.99% Day Change: 0.21 | |
| Week Change: 1.62% Year-to-date Change: -11.9% | |
| NWBI Links: Profile News Message Board | |
| Charts:- Daily , Weekly | |
| Add NWBI to Watchlist: View: Get Complete NWBI Trend Analysis ➞ | |
 | CHMI Cherry Hill Mortgage Investment Corporation |
| Sector: Financials | |
| SubSector: Mortgage Investment | |
| MarketCap: 124.839 Millions | |
| Recent Price: 3.33 Smart Investing & Trading Score: 42 | |
| Day Percent Change: 1.99% Day Change: 0.07 | |
| Week Change: -0.45% Year-to-date Change: -17.7% | |
| CHMI Links: Profile News Message Board | |
| Charts:- Daily , Weekly | |
| Add CHMI to Watchlist: View: Get Complete CHMI Trend Analysis ➞ | |
 | RGA Reinsurance Group of America, Incorporated |
| Sector: Financials | |
| SubSector: Life Insurance | |
| MarketCap: 4423.36 Millions | |
| Recent Price: 186.09 Smart Investing & Trading Score: 63 | |
| Day Percent Change: 1.98% Day Change: 3.61 | |
| Week Change: 0.93% Year-to-date Change: 15.0% | |
| RGA Links: Profile News Message Board | |
| Charts:- Daily , Weekly | |
| Add RGA to Watchlist: View: Get Complete RGA Trend Analysis ➞ | |
 | SNV Synovus Financial Corp. |
| Sector: Financials | |
| SubSector: Regional - Mid-Atlantic Banks | |
| MarketCap: 2697.29 Millions | |
| Recent Price: 34.57 Smart Investing & Trading Score: 0 | |
| Day Percent Change: 1.98% Day Change: 0.67 | |
| Week Change: -6.14% Year-to-date Change: -8.2% | |
| SNV Links: Profile News Message Board | |
| Charts:- Daily , Weekly | |
| Add SNV to Watchlist: View: Get Complete SNV Trend Analysis ➞ | |
 | BMRC Bank of Marin Bancorp |
| Sector: Financials | |
| SubSector: Regional - Pacific Banks | |
| MarketCap: 367.929 Millions | |
| Recent Price: 15.47 Smart Investing & Trading Score: 52 | |
| Day Percent Change: 1.98% Day Change: 0.30 | |
| Week Change: 3.2% Year-to-date Change: -29.8% | |
| BMRC Links: Profile News Message Board | |
| Charts:- Daily , Weekly | |
| Add BMRC to Watchlist: View: Get Complete BMRC Trend Analysis ➞ | |
| For tabular summary view of above stock list: Summary View ➞ 0 - 25 , 25 - 50 , 50 - 75 , 75 - 100 , 100 - 125 , 125 - 150 , 150 - 175 , 175 - 200 , 200 - 225 , 225 - 250 , 250 - 275 , 275 - 300 , 300 - 325 , 325 - 350 , 350 - 375 , 375 - 400 , 400 - 425 , 425 - 450 , 450 - 475 , 475 - 500 , 500 - 525 , 525 - 550 , 550 - 575 , 575 - 600 , 600 - 625 , 625 - 650 , 650 - 675 , 675 - 700 , 700 - 725 , 725 - 750 , 750 - 775 , 775 - 800 , 800 - 825 , 825 - 850 , 850 - 875 , 875 - 900 , 900 - 925 , 925 - 950 , 950 - 975 , 975 - 1000 , 1000 - 1025 , 1025 - 1050 , 1050 - 1075 , 1075 - 1100 , 1100 - 1125 , 1125 - 1150 , 1150 - 1175 , 1175 - 1200 , 1200 - 1225 , 1225 - 1250 | ||
| Click To Change The Sort Order: By Market Cap or Company Size Performance: Year-to-date, Week and Day | |
| Select Chart Type: | ||
|
Best Stocks Today 12Stocks.com |
© 2024 12Stocks.com Terms & Conditions Privacy Contact Us
All Information Provided Only For Education And Not To Be Used For Investing or Trading. See Terms & Conditions


One More Thing ... Get Best Stocks Delivered Daily!
Never Ever Miss A Move With Our Top Ten Stocks Lists
Find Best Stocks In Any Market - Bull or Bear Market
Take A Peek At Our Top Ten Stocks Lists: Daily, Weekly, Year-to-Date & Top Trends
Find Best Stocks In Any Market - Bull or Bear Market
Take A Peek At Our Top Ten Stocks Lists: Daily, Weekly, Year-to-Date & Top Trends
Financial Stocks With Best Up Trends [0-bearish to 100-bullish]: Victory Capital[100], Old Second[100], United Fire[100], Wells Fargo[100], Tejon Ranch[100], ASA Gold[100], Stellus Capital[100], Fidus [100], WhiteHorse Finance[100], Goldman Sachs[100], TCG BDC[100]
Best Financial Stocks Year-to-Date:
Root [394.17%], Hippo [119.15%], Gladstone Capital[95.14%], Banco Macro[73.61%], Grupo Financiero[63.97%], Yiren Digital[54.49%], Banco BBVA[52.76%], First [51.11%], Fidelis Insurance[49.98%], EverQuote [48.41%], Heritage Insurance[44.33%] Best Financial Stocks This Week:
Macatawa Bank[45.99%], Metropolitan Bank[13.05%], Medical Properties[12.28%], Globe Life[10.86%], Victory Capital[10.85%], James River[10.28%], Chemung [8.49%], Summit [7.44%], Citizens [7.03%], Iris Energy[6.99%], Bancorp [6.88%] Best Financial Stocks Daily:
Hywin [17.78%], Metropolitan Bank[17.73%], Cohen & Steers[8.81%], Chemung [8.68%], Summit [7.62%], BancFirst [6.91%], Offerpad [6.59%], Iris Energy[6.30%], Home Bancorp[5.57%], Bar Harbor[5.55%], Fifth Third[5.46%]