
 Login Sign Up


| |||||
 |  | ||||

| 12Stocks.com Market Intelligence |
Best Financial Stocks
| In a hurry? Financial Stocks Lists: Performance Trends Table, Stock Charts
Sort Financial stocks: Daily, Weekly, Year-to-Date, Market Cap & Trends. Filter Financial stocks list by size:All Financial Large Mid-Range Small & MicroCap |
| 12Stocks.com Financial Stocks Performances & Trends Daily | |||||||||
|
|  The overall Smart Investing & Trading Score is 46 (0-bearish to 100-bullish) which puts Financial sector in short term neutral trend. The Smart Investing & Trading Score from previous trading session is 68 and hence a deterioration of trend.
| ||||||||
Here are the Smart Investing & Trading Scores of the most requested Financial stocks at 12Stocks.com (click stock name for detailed review):
|


| 12Stocks.com: Investing in Financial sector with Stocks | |
|
The following table helps investors and traders sort through current performance and trends (as measured by Smart Investing & Trading Score) of various
stocks in the Financial sector. Quick View: Move mouse or cursor over stock symbol (ticker) to view short-term Technical chart and over stock name to view long term chart. Click on  to add stock symbol to your watchlist and to add stock symbol to your watchlist and  to view watchlist. Click on any ticker or stock name for detailed market intelligence report for that stock. to view watchlist. Click on any ticker or stock name for detailed market intelligence report for that stock. |
12Stocks.com Performance of Stocks in Financial Sector
| Ticker | Stock Name | Watchlist | Category | Recent Price | Smart Investing & Trading Score | Change % | YTD Change% |
| FHN | First Horizon |   | Regional Banks | 14.76 | 58 | -1.14 | 4.24% |
| CUBE | CubeSmart | | REIT - Industrial | 41.64 | 28 | -1.14 | -10.16% |
| PGR | Progressive | | Insurance | 209.78 | 51 | -1.14 | 31.71% |
| AFL | Aflac | | Insurance | 83.31 | 42 | -1.15 | 0.98% |
| TBLD | Thornburg ome | | Closed-End Fund - Equity | 15.30 | 18 | -1.16 | -1.80% |
| FCNCP | First Citizens | | Banks Regional | 20.95 | 37 | -1.16 | 3.33% |
| STEP | StepStone | | Asset Mgmt | 35.38 | 36 | -1.16 | 11.10% |
| SITC | SITE Centers | | REIT - Retail | 13.60 | 46 | -1.16 | -0.22% |
| EXG | Eaton Vance | | Closed-End Fund - Foreign | 7.84 | 46 | -1.16 | 1.53% |
| HIG | Hartford | | Insurance | 98.70 | 53 | -1.16 | 22.79% |
| ESNT | Essent | | Mortgage | 53.53 | 17 | -1.17 | 1.51% |
| FHB | First Hawaiian | | Regional Banks | 21.95 | 100 | -1.17 | -3.98% |
| ELS | Equity LifeStyle | | REIT | 60.60 | 17 | -1.17 | -14.09% |
| CINF | Cinnati | | Insurance | 118.52 | 43 | -1.17 | 14.56% |
| FRPH | FRP | | Property Mgmt | 30.34 | 25 | -1.17 | -51.75% |
| CBNK | Capital Bancorp | | S&L | 19.27 | 35 | -1.18 | -20.37% |
| TPL | Texas Pacific | | Real Estatet | 582.05 | 42 | -1.18 | -62.98% |
| AXP | American Express | | Credit Services | 236.27 | 88 | -1.19 | 26.12% |
| NIE | AllianzGI Equity | | Asset Mgmt | 21.58 | 56 | -1.19 | 3.20% |
| ISD | PGIM High | | Closed-End Fund - Debt | 12.33 | 32 | -1.20 | 0.08% |
| EFSC | Enterprise | | Regional - Southwest Banks | 38.66 | 17 | -1.20 | -13.42% |
| NNI | Nelnet | | Credit Services | 93.81 | 76 | -1.20 | 6.33% |
| WTFC | Wintrust | | Regional Banks | 98.93 | 86 | -1.20 | 6.66% |
| ROIC | Retail Opportunity | | REIT - Retail | 12.25 | 67 | -1.21 | -12.69% |
| MPA | BlackRock MuniYield | | Closed-End Fund - Debt | 12.25 | 93 | -1.21 | 5.33% |
| For chart view version of above stock list: Chart View ➞ 0 - 25 , 25 - 50 , 50 - 75 , 75 - 100 , 100 - 125 , 125 - 150 , 150 - 175 , 175 - 200 , 200 - 225 , 225 - 250 , 250 - 275 , 275 - 300 , 300 - 325 , 325 - 350 , 350 - 375 , 375 - 400 , 400 - 425 , 425 - 450 , 450 - 475 , 475 - 500 , 500 - 525 , 525 - 550 , 550 - 575 , 575 - 600 , 600 - 625 , 625 - 650 , 650 - 675 , 675 - 700 , 700 - 725 , 725 - 750 , 750 - 775 , 775 - 800 , 800 - 825 , 825 - 850 , 850 - 875 , 875 - 900 , 900 - 925 , 925 - 950 , 950 - 975 , 975 - 1000 , 1000 - 1025 , 1025 - 1050 , 1050 - 1075 , 1075 - 1100 , 1100 - 1125 , 1125 - 1150 , 1150 - 1175 | ||
 | Click To Change The Sort Order: By Market Cap or Company Size Performance: Year-to-date, Week and Day |  |
|
Get the most comprehensive stock market coverage daily at 12Stocks.com ➞ Best Stocks Today ➞ Best Stocks Weekly ➞ Best Stocks Year-to-Date ➞ Best Stocks Trends ➞  Best Stocks Today 12Stocks.com Best Nasdaq Stocks ➞ Best S&P 500 Stocks ➞ Best Tech Stocks ➞ Best Biotech Stocks ➞ |
| Detailed Overview of Financial Stocks |
| Financial Technical Overview, Leaders & Laggards, Top Financial ETF Funds & Detailed Financial Stocks List, Charts, Trends & More |
| Financial Sector: Technical Analysis, Trends & YTD Performance | |
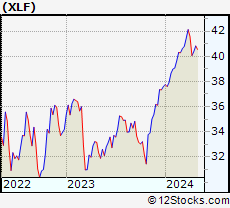
| Financial sector is composed of stocks
from banks, brokers, insurance, REITs
and services subsectors. Financial sector, as represented by XLF, an exchange-traded fund [ETF] that holds basket of Financial stocks (e.g, Bank of America, Goldman Sachs) is up by 8.14% and is currently outperforming the overall market by 3.89% year-to-date. Below is a quick view of Technical charts and trends: |
|
 XLF Weekly Chart |
|
| Long Term Trend: Very Good | |
| Medium Term Trend: Not Good | |
 XLF Daily Chart |
|
| Short Term Trend: Not Good | |
| Overall Trend Score: 46 | |
| YTD Performance: 8.14% | |
| **Trend Scores & Views Are Only For Educational Purposes And Not For Investing | |
| 12Stocks.com: Top Performing Financial Sector Stocks | ||||||||||||||||||||||||||||||||||||||||||||||||
 The top performing Financial sector stocks year to date are
Now, more recently, over last week, the top performing Financial sector stocks on the move are


|
||||||||||||||||||||||||||||||||||||||||||||||||
| 12Stocks.com: Investing in Financial Sector using Exchange Traded Funds | |
|
The following table shows list of key exchange traded funds (ETF) that
help investors track Financial Index. For detailed view, check out our ETF Funds section of our website. Quick View: Move mouse or cursor over ETF symbol (ticker) to view short-term Technical chart and over ETF name to view long term chart. Click on ticker or stock name for detailed view. Click on to add stock symbol to your watchlist and to view watchlist. |
12Stocks.com List of ETFs that track Financial Index
| Ticker | ETF Name | Watchlist | Recent Price | Smart Investing & Trading Score | Change % | Week % | Year-to-date % |
| XLF | Financial | | 40.66 | 46 | -1.12 | 0.69 | 8.14% |
| IAI | Broker-Dealers & Secs | | 111.36 | 33 | -1.36 | 0.3 | 2.61% |
| KBE | Bank | | 45.20 | 48 | -1.64 | 1.79 | -1.77% |
| FAS | Financial Bull 3X | | 99.61 | 48 | -3.48 | 1.72 | 20.52% |
| FAZ | Financial Bear 3X | | 11.00 | 47 | 3.68 | -1.79 | -19.53% |
| UYG | Financials | | 63.13 | 56 | -2.49 | 1.11 | 14.37% |
| KIE | Insurance | | 49.00 | 51 | -1.35 | -0.16 | 8.36% |
| 12Stocks.com: Charts, Trends, Fundamental Data and Performances of Financial Stocks | |
|
We now take in-depth look at all Financial stocks including charts, multi-period performances and overall trends (as measured by Smart Investing & Trading Score). One can sort Financial stocks (click link to choose) by Daily, Weekly and by Year-to-Date performances. Also, one can sort by size of the company or by market capitalization. |
| Select Your Default Chart Type: | |||||
| |||||
| Click on stock symbol or name for detailed view. Click on to add stock symbol to your watchlist and to view watchlist. Quick View: Move mouse or cursor over "Daily" to quickly view daily Technical stock chart and over "Weekly" to view weekly Technical stock chart. | |||||

 | FHN First Horizon National Corporation |
| Sector: Financials | |
| SubSector: Regional - Southeast Banks | |
| MarketCap: 2661.05 Millions | |
| Recent Price: 14.76 Smart Investing & Trading Score: 58 | |
| Day Percent Change: -1.14% Day Change: -0.17 | |
| Week Change: 0.89% Year-to-date Change: 4.2% | |
| FHN Links: Profile News Message Board | |
| Charts:- Daily , Weekly | |
| Add FHN to Watchlist: View: Get Complete FHN Trend Analysis ➞ | |
 | CUBE CubeSmart |
| Sector: Financials | |
| SubSector: REIT - Industrial | |
| MarketCap: 4562.99 Millions | |
| Recent Price: 41.64 Smart Investing & Trading Score: 28 | |
| Day Percent Change: -1.14% Day Change: -0.48 | |
| Week Change: -0.98% Year-to-date Change: -10.2% | |
| CUBE Links: Profile News Message Board | |
| Charts:- Daily , Weekly | |
| Add CUBE to Watchlist: View: Get Complete CUBE Trend Analysis ➞ | |
 | PGR The Progressive Corporation |
| Sector: Financials | |
| SubSector: Property & Casualty Insurance | |
| MarketCap: 43112 Millions | |
| Recent Price: 209.78 Smart Investing & Trading Score: 51 | |
| Day Percent Change: -1.14% Day Change: -2.42 | |
| Week Change: -2.29% Year-to-date Change: 31.7% | |
| PGR Links: Profile News Message Board | |
| Charts:- Daily , Weekly | |
| Add PGR to Watchlist: View: Get Complete PGR Trend Analysis ➞ | |
 | AFL Aflac Incorporated |
| Sector: Financials | |
| SubSector: Accident & Health Insurance | |
| MarketCap: 22706 Millions | |
| Recent Price: 83.31 Smart Investing & Trading Score: 42 | |
| Day Percent Change: -1.15% Day Change: -0.97 | |
| Week Change: 0.1% Year-to-date Change: 1.0% | |
| AFL Links: Profile News Message Board | |
| Charts:- Daily , Weekly | |
| Add AFL to Watchlist: View: Get Complete AFL Trend Analysis ➞ | |
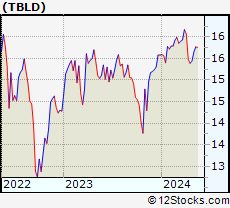 | TBLD Thornburg Income Builder Opportunities Trust |
| Sector: Financials | |
| SubSector: Closed-End Fund - Equity | |
| MarketCap: 489 Millions | |
| Recent Price: 15.30 Smart Investing & Trading Score: 18 | |
| Day Percent Change: -1.16% Day Change: -0.18 | |
| Week Change: -0.58% Year-to-date Change: -1.8% | |
| TBLD Links: Profile News Message Board | |
| Charts:- Daily , Weekly | |
| Add TBLD to Watchlist: View: Get Complete TBLD Trend Analysis ➞ | |
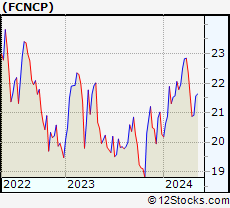 | FCNCP First Citizens BancShares, Inc. |
| Sector: Financials | |
| SubSector: Banks Regional | |
| MarketCap: 60157 Millions | |
| Recent Price: 20.95 Smart Investing & Trading Score: 37 | |
| Day Percent Change: -1.16% Day Change: -0.25 | |
| Week Change: 0.31% Year-to-date Change: 3.3% | |
| FCNCP Links: Profile News Message Board | |
| Charts:- Daily , Weekly | |
| Add FCNCP to Watchlist: View: Get Complete FCNCP Trend Analysis ➞ | |
 | STEP StepStone Group Inc. |
| Sector: Financials | |
| SubSector: Asset Management | |
| MarketCap: 30757 Millions | |
| Recent Price: 35.38 Smart Investing & Trading Score: 36 | |
| Day Percent Change: -1.16% Day Change: -0.41 | |
| Week Change: -0.1% Year-to-date Change: 11.1% | |
| STEP Links: Profile News Message Board | |
| Charts:- Daily , Weekly | |
| Add STEP to Watchlist: View: Get Complete STEP Trend Analysis ➞ | |
 | SITC SITE Centers Corp. |
| Sector: Financials | |
| SubSector: REIT - Retail | |
| MarketCap: 1449.54 Millions | |
| Recent Price: 13.60 Smart Investing & Trading Score: 46 | |
| Day Percent Change: -1.16% Day Change: -0.16 | |
| Week Change: -0.37% Year-to-date Change: -0.2% | |
| SITC Links: Profile News Message Board | |
| Charts:- Daily , Weekly | |
| Add SITC to Watchlist: View: Get Complete SITC Trend Analysis ➞ | |
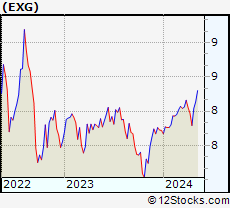 | EXG Eaton Vance Tax-Managed Global Diversified Equity Income Fund |
| Sector: Financials | |
| SubSector: Closed-End Fund - Foreign | |
| MarketCap: 1635.47 Millions | |
| Recent Price: 7.84 Smart Investing & Trading Score: 46 | |
| Day Percent Change: -1.16% Day Change: -0.09 | |
| Week Change: 0.62% Year-to-date Change: 1.5% | |
| EXG Links: Profile News Message Board | |
| Charts:- Daily , Weekly | |
| Add EXG to Watchlist: View: Get Complete EXG Trend Analysis ➞ | |
 | HIG The Hartford Financial Services Group, Inc. |
| Sector: Financials | |
| SubSector: Property & Casualty Insurance | |
| MarketCap: 12582.8 Millions | |
| Recent Price: 98.70 Smart Investing & Trading Score: 53 | |
| Day Percent Change: -1.16% Day Change: -1.16 | |
| Week Change: -0.25% Year-to-date Change: 22.8% | |
| HIG Links: Profile News Message Board | |
| Charts:- Daily , Weekly | |
| Add HIG to Watchlist: View: Get Complete HIG Trend Analysis ➞ | |
 | ESNT Essent Group Ltd. |
| Sector: Financials | |
| SubSector: Mortgage Investment | |
| MarketCap: 2806.19 Millions | |
| Recent Price: 53.53 Smart Investing & Trading Score: 17 | |
| Day Percent Change: -1.17% Day Change: -0.64 | |
| Week Change: 0.14% Year-to-date Change: 1.5% | |
| ESNT Links: Profile News Message Board | |
| Charts:- Daily , Weekly | |
| Add ESNT to Watchlist: View: Get Complete ESNT Trend Analysis ➞ | |
 | FHB First Hawaiian, Inc. |
| Sector: Financials | |
| SubSector: Regional - Pacific Banks | |
| MarketCap: 2398.99 Millions | |
| Recent Price: 21.95 Smart Investing & Trading Score: 100 | |
| Day Percent Change: -1.17% Day Change: -0.26 | |
| Week Change: 4.52% Year-to-date Change: -4.0% | |
| FHB Links: Profile News Message Board | |
| Charts:- Daily , Weekly | |
| Add FHB to Watchlist: View: Get Complete FHB Trend Analysis ➞ | |
 | ELS Equity LifeStyle Properties, Inc. |
| Sector: Financials | |
| SubSector: REIT - Residential | |
| MarketCap: 9570.61 Millions | |
| Recent Price: 60.60 Smart Investing & Trading Score: 17 | |
| Day Percent Change: -1.17% Day Change: -0.72 | |
| Week Change: -3.4% Year-to-date Change: -14.1% | |
| ELS Links: Profile News Message Board | |
| Charts:- Daily , Weekly | |
| Add ELS to Watchlist: View: Get Complete ELS Trend Analysis ➞ | |
 | CINF Cincinnati Financial Corporation |
| Sector: Financials | |
| SubSector: Property & Casualty Insurance | |
| MarketCap: 13637 Millions | |
| Recent Price: 118.52 Smart Investing & Trading Score: 43 | |
| Day Percent Change: -1.17% Day Change: -1.40 | |
| Week Change: -1.19% Year-to-date Change: 14.6% | |
| CINF Links: Profile News Message Board | |
| Charts:- Daily , Weekly | |
| Add CINF to Watchlist: View: Get Complete CINF Trend Analysis ➞ | |
 | FRPH FRP Holdings, Inc. |
| Sector: Financials | |
| SubSector: Property Management | |
| MarketCap: 374.442 Millions | |
| Recent Price: 30.34 Smart Investing & Trading Score: 25 | |
| Day Percent Change: -1.17% Day Change: -0.36 | |
| Week Change: -0.07% Year-to-date Change: -51.8% | |
| FRPH Links: Profile News Message Board | |
| Charts:- Daily , Weekly | |
| Add FRPH to Watchlist: View: Get Complete FRPH Trend Analysis ➞ | |
 | CBNK Capital Bancorp, Inc. |
| Sector: Financials | |
| SubSector: Savings & Loans | |
| MarketCap: 174.93 Millions | |
| Recent Price: 19.27 Smart Investing & Trading Score: 35 | |
| Day Percent Change: -1.18% Day Change: -0.23 | |
| Week Change: -1.56% Year-to-date Change: -20.4% | |
| CBNK Links: Profile News Message Board | |
| Charts:- Daily , Weekly | |
| Add CBNK to Watchlist: View: Get Complete CBNK Trend Analysis ➞ | |
 | TPL Texas Pacific Land Trust |
| Sector: Financials | |
| SubSector: Real Estate Development | |
| MarketCap: 3052.29 Millions | |
| Recent Price: 582.05 Smart Investing & Trading Score: 42 | |
| Day Percent Change: -1.18% Day Change: -6.96 | |
| Week Change: -0.09% Year-to-date Change: -63.0% | |
| TPL Links: Profile News Message Board | |
| Charts:- Daily , Weekly | |
| Add TPL to Watchlist: View: Get Complete TPL Trend Analysis ➞ | |
 | AXP American Express Company |
| Sector: Financials | |
| SubSector: Credit Services | |
| MarketCap: 68388 Millions | |
| Recent Price: 236.27 Smart Investing & Trading Score: 88 | |
| Day Percent Change: -1.19% Day Change: -2.85 | |
| Week Change: 2.26% Year-to-date Change: 26.1% | |
| AXP Links: Profile News Message Board | |
| Charts:- Daily , Weekly | |
| Add AXP to Watchlist: View: Get Complete AXP Trend Analysis ➞ | |
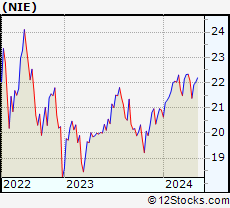 | NIE AllianzGI Equity & Convertible Income Fund |
| Sector: Financials | |
| SubSector: Asset Management | |
| MarketCap: 461.003 Millions | |
| Recent Price: 21.58 Smart Investing & Trading Score: 56 | |
| Day Percent Change: -1.19% Day Change: -0.26 | |
| Week Change: 0.94% Year-to-date Change: 3.2% | |
| NIE Links: Profile News Message Board | |
| Charts:- Daily , Weekly | |
| Add NIE to Watchlist: View: Get Complete NIE Trend Analysis ➞ | |
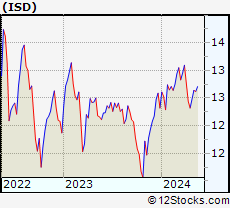 | ISD PGIM High Yield Bond Fund, Inc |
| Sector: Financials | |
| SubSector: Closed-End Fund - Debt | |
| MarketCap: 341.507 Millions | |
| Recent Price: 12.33 Smart Investing & Trading Score: 32 | |
| Day Percent Change: -1.20% Day Change: -0.15 | |
| Week Change: 0.08% Year-to-date Change: 0.1% | |
| ISD Links: Profile News Message Board | |
| Charts:- Daily , Weekly | |
| Add ISD to Watchlist: View: Get Complete ISD Trend Analysis ➞ | |
 | EFSC Enterprise Financial Services Corp |
| Sector: Financials | |
| SubSector: Regional - Southwest Banks | |
| MarketCap: 770.165 Millions | |
| Recent Price: 38.66 Smart Investing & Trading Score: 17 | |
| Day Percent Change: -1.20% Day Change: -0.47 | |
| Week Change: -2.57% Year-to-date Change: -13.4% | |
| EFSC Links: Profile News Message Board | |
| Charts:- Daily , Weekly | |
| Add EFSC to Watchlist: View: Get Complete EFSC Trend Analysis ➞ | |
 | NNI Nelnet, Inc. |
| Sector: Financials | |
| SubSector: Credit Services | |
| MarketCap: 1664.38 Millions | |
| Recent Price: 93.81 Smart Investing & Trading Score: 76 | |
| Day Percent Change: -1.20% Day Change: -1.13 | |
| Week Change: -1.59% Year-to-date Change: 6.3% | |
| NNI Links: Profile News Message Board | |
| Charts:- Daily , Weekly | |
| Add NNI to Watchlist: View: Get Complete NNI Trend Analysis ➞ | |
 | WTFC Wintrust Financial Corporation |
| Sector: Financials | |
| SubSector: Regional - Midwest Banks | |
| MarketCap: 1942.6 Millions | |
| Recent Price: 98.93 Smart Investing & Trading Score: 86 | |
| Day Percent Change: -1.20% Day Change: -1.20 | |
| Week Change: 1.66% Year-to-date Change: 6.7% | |
| WTFC Links: Profile News Message Board | |
| Charts:- Daily , Weekly | |
| Add WTFC to Watchlist: View: Get Complete WTFC Trend Analysis ➞ | |
 | ROIC Retail Opportunity Investments Corp. |
| Sector: Financials | |
| SubSector: REIT - Retail | |
| MarketCap: 943.414 Millions | |
| Recent Price: 12.25 Smart Investing & Trading Score: 67 | |
| Day Percent Change: -1.21% Day Change: -0.15 | |
| Week Change: -0.24% Year-to-date Change: -12.7% | |
| ROIC Links: Profile News Message Board | |
| Charts:- Daily , Weekly | |
| Add ROIC to Watchlist: View: Get Complete ROIC Trend Analysis ➞ | |
 | MPA BlackRock MuniYield Pennsylvania Quality Fund |
| Sector: Financials | |
| SubSector: Closed-End Fund - Debt | |
| MarketCap: 155.107 Millions | |
| Recent Price: 12.25 Smart Investing & Trading Score: 93 | |
| Day Percent Change: -1.21% Day Change: -0.15 | |
| Week Change: 0.57% Year-to-date Change: 5.3% | |
| MPA Links: Profile News Message Board | |
| Charts:- Daily , Weekly | |
| Add MPA to Watchlist: View: Get Complete MPA Trend Analysis ➞ | |
| For tabular summary view of above stock list: Summary View ➞ 0 - 25 , 25 - 50 , 50 - 75 , 75 - 100 , 100 - 125 , 125 - 150 , 150 - 175 , 175 - 200 , 200 - 225 , 225 - 250 , 250 - 275 , 275 - 300 , 300 - 325 , 325 - 350 , 350 - 375 , 375 - 400 , 400 - 425 , 425 - 450 , 450 - 475 , 475 - 500 , 500 - 525 , 525 - 550 , 550 - 575 , 575 - 600 , 600 - 625 , 625 - 650 , 650 - 675 , 675 - 700 , 700 - 725 , 725 - 750 , 750 - 775 , 775 - 800 , 800 - 825 , 825 - 850 , 850 - 875 , 875 - 900 , 900 - 925 , 925 - 950 , 950 - 975 , 975 - 1000 , 1000 - 1025 , 1025 - 1050 , 1050 - 1075 , 1075 - 1100 , 1100 - 1125 , 1125 - 1150 , 1150 - 1175 | ||
| Click To Change The Sort Order: By Market Cap or Company Size Performance: Year-to-date, Week and Day | |
| Select Chart Type: | ||
|
Best Stocks Today 12Stocks.com |
© 2024 12Stocks.com Terms & Conditions Privacy Contact Us
All Information Provided Only For Education And Not To Be Used For Investing or Trading. See Terms & Conditions


One More Thing ... Get Best Stocks Delivered Daily!
Never Ever Miss A Move With Our Top Ten Stocks Lists
Find Best Stocks In Any Market - Bull or Bear Market
Take A Peek At Our Top Ten Stocks Lists: Daily, Weekly, Year-to-Date & Top Trends
Find Best Stocks In Any Market - Bull or Bear Market
Take A Peek At Our Top Ten Stocks Lists: Daily, Weekly, Year-to-Date & Top Trends
Financial Stocks With Best Up Trends [0-bearish to 100-bullish]: Deutsche Bank[100], Virtu [100], Trustmark [100], B. Riley[100], TCG BDC[100], Third Coast[100], LCNB [100], UDR [100], Fidus [100], Equity Residential[100], Capital Southwest[100]
Best Financial Stocks Year-to-Date:
Root [465%], Hippo [126.07%], Gladstone Capital[98.88%], Banco Macro[75.09%], Grupo Financiero[73.76%], Banco BBVA[67%], Yiren Digital[62.5%], Heritage Insurance[59.2%], Fidelis Insurance[54.93%], EverQuote [53.35%], First [51.34%] Best Financial Stocks This Week:
B. Riley[49.67%], Oportun [40.95%], Globe Life[14.66%], Root [14.33%], Provident Bancorp[13.67%], Deutsche Bank[12.16%], First Citizens[11.92%], TOP [11.49%], Cipher Mining[11.33%], Trustmark [10.91%], Barclays [10.21%] Best Financial Stocks Daily:
Deutsche Bank[8.28%], Barclays [7.34%], First Citizens[6.99%], MicroSectors Gold[5.71%], Meta [4.35%], Ladder Capital[4.14%], Bridge [3.93%], CNFinance [3.85%], Hanmi [3.83%], Grupo Financiero[3.20%], HarborOne Bancorp[3.18%]