
 Login Sign Up


| |||||
 |  | ||||

| 12Stocks.com Market Intelligence |
Best Financial Stocks
| In a hurry? Financial Stocks Lists: Performance Trends Table, Stock Charts
Sort Financial stocks: Daily, Weekly, Year-to-Date, Market Cap & Trends. Filter Financial stocks list by size:All Financial Large Mid-Range Small & MicroCap |
| 12Stocks.com Financial Stocks Performances & Trends Daily | |||||||||
|
|  The overall Smart Investing & Trading Score is 63 (0-bearish to 100-bullish) which puts Financial sector in short term neutral to bullish trend. The Smart Investing & Trading Score from previous trading session is 56 and hence an improvement of trend.
| ||||||||
Here are the Smart Investing & Trading Scores of the most requested Financial stocks at 12Stocks.com (click stock name for detailed review):
|


| 12Stocks.com: Investing in Financial sector with Stocks | |
|
The following table helps investors and traders sort through current performance and trends (as measured by Smart Investing & Trading Score) of various
stocks in the Financial sector. Quick View: Move mouse or cursor over stock symbol (ticker) to view short-term Technical chart and over stock name to view long term chart. Click on  to add stock symbol to your watchlist and to add stock symbol to your watchlist and  to view watchlist. Click on any ticker or stock name for detailed market intelligence report for that stock. to view watchlist. Click on any ticker or stock name for detailed market intelligence report for that stock. |
12Stocks.com Performance of Stocks in Financial Sector
| Ticker | Stock Name | Watchlist | Category | Recent Price | Smart Investing & Trading Score | Change % | YTD Change% |
| PFS | Provident |   | S&L | 14.46 | 52 | 5.16 | -19.80% |
| FFWM | First Foundation | | Regional Banks | 6.76 | 52 | 5.13 | -30.17% |
| TRUP | Trupanion | | Insurance | 22.45 | 35 | 5.10 | -26.42% |
| OSBC | Old Second | | Regional Banks | 14.43 | 100 | 5.02 | -6.54% |
| CIVB | Civista Bancshares | | Regional Banks | 15.02 | 52 | 4.96 | -18.55% |
| FRBA | First Bank | | Regional Banks | 12.72 | 42 | 4.95 | -13.47% |
| TIPT | Tiptree | | Life Insurance | 16.34 | 42 | 4.91 | -13.84% |
| TCBI | Texas Capital | | Regional - Southwest Banks | 58.68 | 52 | 4.82 | -9.21% |
| BSRR | Sierra Bancorp | | Regional Banks | 18.75 | 52 | 4.81 | -16.85% |
| DCOM | Dime Community | | S&L | 18.68 | 52 | 4.77 | -30.63% |
| CBU | Community Bank | | Regional Banks | 44.50 | 52 | 4.76 | -14.60% |
| BCBP | BCB Bancorp | | Regional Banks | 9.97 | 52 | 4.73 | -22.41% |
| TCBK | TriCo Bancshares | | Regional Banks | 33.58 | 52 | 4.71 | -21.85% |
| CAC | Camden National | | Regional Banks | 30.06 | 42 | 4.70 | -20.12% |
| NFBK | Northfield Bancorp | | Regional Banks | 8.51 | 42 | 4.67 | -32.35% |
| TMP | Tompkins | | Regional Banks | 45.72 | 52 | 4.65 | -24.09% |
| CVLY | Codorus Valley | | Regional Banks | 22.34 | 42 | 4.64 | -13.07% |
| UVSP | Univest | | Regional Banks | 19.44 | 52 | 4.57 | -11.76% |
| BRT | BRT Apartments | | Mortgage | 17.37 | 93 | 4.51 | -6.56% |
| WSBF | Waterstone | | S&L | 11.59 | 59 | 4.51 | -18.38% |
| PPBI | Pacific Premier | | Regional Banks | 22.27 | 52 | 4.50 | -23.50% |
| ACNB | ACNB | | Regional - Southwest Banks | 32.49 | 42 | 4.47 | -27.41% |
| MBWM | Mercantile Bank | | Regional Banks | 36.07 | 42 | 4.46 | -10.67% |
| PGC | Peapack-Gladstone | | Regional Banks | 24.13 | 52 | 4.46 | -19.08% |
| GCBC | Greene County | | S&L | 28.60 | 93 | 4.38 | 1.42% |
| For chart view version of above stock list: Chart View ➞ 0 - 25 , 25 - 50 , 50 - 75 , 75 - 100 , 100 - 125 , 125 - 150 , 150 - 175 , 175 - 200 , 200 - 225 , 225 - 250 , 250 - 275 , 275 - 300 , 300 - 325 , 325 - 350 , 350 - 375 , 375 - 400 , 400 - 425 , 425 - 450 , 450 - 475 , 475 - 500 , 500 - 525 , 525 - 550 , 550 - 575 , 575 - 600 , 600 - 625 , 625 - 650 , 650 - 675 , 675 - 700 , 700 - 725 , 725 - 750 , 750 - 775 , 775 - 800 , 800 - 825 , 825 - 850 , 850 - 875 , 875 - 900 , 900 - 925 , 925 - 950 , 950 - 975 , 975 - 1000 , 1000 - 1025 , 1025 - 1050 , 1050 - 1075 , 1075 - 1100 , 1100 - 1125 , 1125 - 1150 , 1150 - 1175 , 1175 - 1200 , 1200 - 1225 , 1225 - 1250 | ||
 | Click To Change The Sort Order: By Market Cap or Company Size Performance: Year-to-date, Week and Day |  |
|
Get the most comprehensive stock market coverage daily at 12Stocks.com ➞ Best Stocks Today ➞ Best Stocks Weekly ➞ Best Stocks Year-to-Date ➞ Best Stocks Trends ➞  Best Stocks Today 12Stocks.com Best Nasdaq Stocks ➞ Best S&P 500 Stocks ➞ Best Tech Stocks ➞ Best Biotech Stocks ➞ |
| Detailed Overview of Financial Stocks |
| Financial Technical Overview, Leaders & Laggards, Top Financial ETF Funds & Detailed Financial Stocks List, Charts, Trends & More |
| Financial Sector: Technical Analysis, Trends & YTD Performance | |
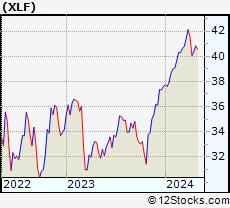
| Financial sector is composed of stocks
from banks, brokers, insurance, REITs
and services subsectors. Financial sector, as represented by XLF, an exchange-traded fund [ETF] that holds basket of Financial stocks (e.g, Bank of America, Goldman Sachs) is up by 7.39% and is currently outperforming the overall market by 4.01% year-to-date. Below is a quick view of Technical charts and trends: |
|
 XLF Weekly Chart |
|
| Long Term Trend: Very Good | |
| Medium Term Trend: Not Good | |
 XLF Daily Chart |
|
| Short Term Trend: Very Good | |
| Overall Trend Score: 63 | |
| YTD Performance: 7.39% | |
| **Trend Scores & Views Are Only For Educational Purposes And Not For Investing | |
| 12Stocks.com: Top Performing Financial Sector Stocks | ||||||||||||||||||||||||||||||||||||||||||||||||
 The top performing Financial sector stocks year to date are
Now, more recently, over last week, the top performing Financial sector stocks on the move are


|
||||||||||||||||||||||||||||||||||||||||||||||||
| 12Stocks.com: Investing in Financial Sector using Exchange Traded Funds | |
|
The following table shows list of key exchange traded funds (ETF) that
help investors track Financial Index. For detailed view, check out our ETF Funds section of our website. Quick View: Move mouse or cursor over ETF symbol (ticker) to view short-term Technical chart and over ETF name to view long term chart. Click on ticker or stock name for detailed view. Click on to add stock symbol to your watchlist and to view watchlist. |
12Stocks.com List of ETFs that track Financial Index
| Ticker | ETF Name | Watchlist | Recent Price | Smart Investing & Trading Score | Change % | Week % | Year-to-date % |
| XLF | Financial | | 40.38 | 63 | 1.38 | 0.8 | 7.39% |
| IAI | Broker-Dealers & Secs | | 111.03 | 63 | 0.47 | 0.18 | 2.3% |
| IYF | Financials | | 91.30 | 63 | 1.40 | 0.83 | 6.9% |
| IYG | Financial Services | | 63.42 | 63 | 1.19 | 0.33 | 6.16% |
| KRE | Regional Banking | | 47.32 | 42 | 2.62 | 1.72 | -9.75% |
| IXG | Global Financials | | 82.86 | 63 | 0.64 | 0.24 | 5.45% |
| VFH | Financials | | 97.75 | 63 | 1.40 | 0.59 | 5.95% |
| KBE | Bank | | 44.41 | 42 | 2.33 | 1.42 | -3.5% |
| FAS | Financial Bull 3X | | 97.93 | 63 | 4.03 | 1.78 | 18.49% |
| FAZ | Financial Bear 3X | | 11.20 | 32 | -3.95 | -1.84 | -18.07% |
| UYG | Financials | | 62.44 | 63 | 2.78 | 1.58 | 13.12% |
| IAT | Regional Banks | | 40.74 | 55 | 2.52 | 0.74 | -2.63% |
| KIE | Insurance | | 49.08 | 58 | 1.66 | 1.57 | 8.54% |
| PSCF | SmallCap Financials | | 45.47 | 42 | 1.59 | 0.13 | -7.54% |
| EUFN | Europe Financials | | 21.95 | 63 | 0.37 | 0.27 | 4.72% |
| PGF | Financial Preferred | | 14.53 | 25 | 0.55 | -1.02 | -0.34% |
| 12Stocks.com: Charts, Trends, Fundamental Data and Performances of Financial Stocks | |
|
We now take in-depth look at all Financial stocks including charts, multi-period performances and overall trends (as measured by Smart Investing & Trading Score). One can sort Financial stocks (click link to choose) by Daily, Weekly and by Year-to-Date performances. Also, one can sort by size of the company or by market capitalization. |
| Select Your Default Chart Type: | |||||
| |||||
| Click on stock symbol or name for detailed view. Click on to add stock symbol to your watchlist and to view watchlist. Quick View: Move mouse or cursor over "Daily" to quickly view daily Technical stock chart and over "Weekly" to view weekly Technical stock chart. | |||||

 | PFS Provident Financial Services, Inc. |
| Sector: Financials | |
| SubSector: Savings & Loans | |
| MarketCap: 829.73 Millions | |
| Recent Price: 14.46 Smart Investing & Trading Score: 52 | |
| Day Percent Change: 5.16% Day Change: 0.71 | |
| Week Change: 2.84% Year-to-date Change: -19.8% | |
| PFS Links: Profile News Message Board | |
| Charts:- Daily , Weekly | |
| Add PFS to Watchlist: View: Get Complete PFS Trend Analysis ➞ | |
 | FFWM First Foundation Inc. |
| Sector: Financials | |
| SubSector: Regional - Midwest Banks | |
| MarketCap: 457.17 Millions | |
| Recent Price: 6.76 Smart Investing & Trading Score: 52 | |
| Day Percent Change: 5.13% Day Change: 0.33 | |
| Week Change: -2.03% Year-to-date Change: -30.2% | |
| FFWM Links: Profile News Message Board | |
| Charts:- Daily , Weekly | |
| Add FFWM to Watchlist: View: Get Complete FFWM Trend Analysis ➞ | |
 | TRUP Trupanion, Inc. |
| Sector: Financials | |
| SubSector: Accident & Health Insurance | |
| MarketCap: 852.06 Millions | |
| Recent Price: 22.45 Smart Investing & Trading Score: 35 | |
| Day Percent Change: 5.10% Day Change: 1.09 | |
| Week Change: -3.98% Year-to-date Change: -26.4% | |
| TRUP Links: Profile News Message Board | |
| Charts:- Daily , Weekly | |
| Add TRUP to Watchlist: View: Get Complete TRUP Trend Analysis ➞ | |
 | OSBC Old Second Bancorp, Inc. |
| Sector: Financials | |
| SubSector: Regional - Midwest Banks | |
| MarketCap: 237.17 Millions | |
| Recent Price: 14.43 Smart Investing & Trading Score: 100 | |
| Day Percent Change: 5.02% Day Change: 0.69 | |
| Week Change: 7.53% Year-to-date Change: -6.5% | |
| OSBC Links: Profile News Message Board | |
| Charts:- Daily , Weekly | |
| Add OSBC to Watchlist: View: Get Complete OSBC Trend Analysis ➞ | |
 | CIVB Civista Bancshares, Inc. |
| Sector: Financials | |
| SubSector: Regional - Pacific Banks | |
| MarketCap: 255.929 Millions | |
| Recent Price: 15.02 Smart Investing & Trading Score: 52 | |
| Day Percent Change: 4.96% Day Change: 0.71 | |
| Week Change: 4.74% Year-to-date Change: -18.6% | |
| CIVB Links: Profile News Message Board | |
| Charts:- Daily , Weekly | |
| Add CIVB to Watchlist: View: Get Complete CIVB Trend Analysis ➞ | |
 | FRBA First Bank |
| Sector: Financials | |
| SubSector: Regional - Mid-Atlantic Banks | |
| MarketCap: 124.859 Millions | |
| Recent Price: 12.72 Smart Investing & Trading Score: 42 | |
| Day Percent Change: 4.95% Day Change: 0.60 | |
| Week Change: 2.58% Year-to-date Change: -13.5% | |
| FRBA Links: Profile News Message Board | |
| Charts:- Daily , Weekly | |
| Add FRBA to Watchlist: View: Get Complete FRBA Trend Analysis ➞ | |
 | TIPT Tiptree Inc. |
| Sector: Financials | |
| SubSector: Life Insurance | |
| MarketCap: 183.486 Millions | |
| Recent Price: 16.34 Smart Investing & Trading Score: 42 | |
| Day Percent Change: 4.91% Day Change: 0.77 | |
| Week Change: 3.06% Year-to-date Change: -13.8% | |
| TIPT Links: Profile News Message Board | |
| Charts:- Daily , Weekly | |
| Add TIPT to Watchlist: View: Get Complete TIPT Trend Analysis ➞ | |
 | TCBI Texas Capital Bancshares, Inc. |
| Sector: Financials | |
| SubSector: Regional - Southwest Banks | |
| MarketCap: 1202.75 Millions | |
| Recent Price: 58.68 Smart Investing & Trading Score: 52 | |
| Day Percent Change: 4.82% Day Change: 2.70 | |
| Week Change: 3.82% Year-to-date Change: -9.2% | |
| TCBI Links: Profile News Message Board | |
| Charts:- Daily , Weekly | |
| Add TCBI to Watchlist: View: Get Complete TCBI Trend Analysis ➞ | |
 | BSRR Sierra Bancorp |
| Sector: Financials | |
| SubSector: Regional - Pacific Banks | |
| MarketCap: 256.929 Millions | |
| Recent Price: 18.75 Smart Investing & Trading Score: 52 | |
| Day Percent Change: 4.81% Day Change: 0.86 | |
| Week Change: 4.22% Year-to-date Change: -16.9% | |
| BSRR Links: Profile News Message Board | |
| Charts:- Daily , Weekly | |
| Add BSRR to Watchlist: View: Get Complete BSRR Trend Analysis ➞ | |
 | DCOM Dime Community Bancshares, Inc. |
| Sector: Financials | |
| SubSector: Savings & Loans | |
| MarketCap: 477.83 Millions | |
| Recent Price: 18.68 Smart Investing & Trading Score: 52 | |
| Day Percent Change: 4.77% Day Change: 0.85 | |
| Week Change: 0.92% Year-to-date Change: -30.6% | |
| DCOM Links: Profile News Message Board | |
| Charts:- Daily , Weekly | |
| Add DCOM to Watchlist: View: Get Complete DCOM Trend Analysis ➞ | |
 | CBU Community Bank System, Inc. |
| Sector: Financials | |
| SubSector: Regional - Midwest Banks | |
| MarketCap: 2787.8 Millions | |
| Recent Price: 44.50 Smart Investing & Trading Score: 52 | |
| Day Percent Change: 4.76% Day Change: 2.02 | |
| Week Change: 3.68% Year-to-date Change: -14.6% | |
| CBU Links: Profile News Message Board | |
| Charts:- Daily , Weekly | |
| Add CBU to Watchlist: View: Get Complete CBU Trend Analysis ➞ | |
 | BCBP BCB Bancorp, Inc. |
| Sector: Financials | |
| SubSector: Regional - Northeast Banks | |
| MarketCap: 196.799 Millions | |
| Recent Price: 9.97 Smart Investing & Trading Score: 52 | |
| Day Percent Change: 4.73% Day Change: 0.45 | |
| Week Change: 1.94% Year-to-date Change: -22.4% | |
| BCBP Links: Profile News Message Board | |
| Charts:- Daily , Weekly | |
| Add BCBP to Watchlist: View: Get Complete BCBP Trend Analysis ➞ | |
 | TCBK TriCo Bancshares |
| Sector: Financials | |
| SubSector: Regional - Pacific Banks | |
| MarketCap: 875.129 Millions | |
| Recent Price: 33.58 Smart Investing & Trading Score: 52 | |
| Day Percent Change: 4.71% Day Change: 1.51 | |
| Week Change: 2.94% Year-to-date Change: -21.9% | |
| TCBK Links: Profile News Message Board | |
| Charts:- Daily , Weekly | |
| Add TCBK to Watchlist: View: Get Complete TCBK Trend Analysis ➞ | |
 | CAC Camden National Corporation |
| Sector: Financials | |
| SubSector: Regional - Northeast Banks | |
| MarketCap: 550.999 Millions | |
| Recent Price: 30.06 Smart Investing & Trading Score: 42 | |
| Day Percent Change: 4.70% Day Change: 1.35 | |
| Week Change: 2.56% Year-to-date Change: -20.1% | |
| CAC Links: Profile News Message Board | |
| Charts:- Daily , Weekly | |
| Add CAC to Watchlist: View: Get Complete CAC Trend Analysis ➞ | |
 | NFBK Northfield Bancorp, Inc. (Staten Island, NY) |
| Sector: Financials | |
| SubSector: Regional - Northeast Banks | |
| MarketCap: 540.699 Millions | |
| Recent Price: 8.51 Smart Investing & Trading Score: 42 | |
| Day Percent Change: 4.67% Day Change: 0.38 | |
| Week Change: 1.67% Year-to-date Change: -32.4% | |
| NFBK Links: Profile News Message Board | |
| Charts:- Daily , Weekly | |
| Add NFBK to Watchlist: View: Get Complete NFBK Trend Analysis ➞ | |
 | TMP Tompkins Financial Corporation |
| Sector: Financials | |
| SubSector: Regional - Northeast Banks | |
| MarketCap: 1144.79 Millions | |
| Recent Price: 45.72 Smart Investing & Trading Score: 52 | |
| Day Percent Change: 4.65% Day Change: 2.03 | |
| Week Change: 3.14% Year-to-date Change: -24.1% | |
| TMP Links: Profile News Message Board | |
| Charts:- Daily , Weekly | |
| Add TMP to Watchlist: View: Get Complete TMP Trend Analysis ➞ | |
 | CVLY Codorus Valley Bancorp, Inc. |
| Sector: Financials | |
| SubSector: Regional - Northeast Banks | |
| MarketCap: 173.799 Millions | |
| Recent Price: 22.34 Smart Investing & Trading Score: 42 | |
| Day Percent Change: 4.64% Day Change: 0.99 | |
| Week Change: 4.54% Year-to-date Change: -13.1% | |
| CVLY Links: Profile News Message Board | |
| Charts:- Daily , Weekly | |
| Add CVLY to Watchlist: View: Get Complete CVLY Trend Analysis ➞ | |
 | UVSP Univest Financial Corporation |
| Sector: Financials | |
| SubSector: Regional - Northeast Banks | |
| MarketCap: 467.999 Millions | |
| Recent Price: 19.44 Smart Investing & Trading Score: 52 | |
| Day Percent Change: 4.57% Day Change: 0.85 | |
| Week Change: 3.85% Year-to-date Change: -11.8% | |
| UVSP Links: Profile News Message Board | |
| Charts:- Daily , Weekly | |
| Add UVSP to Watchlist: View: Get Complete UVSP Trend Analysis ➞ | |
 | BRT BRT Apartments Corp. |
| Sector: Financials | |
| SubSector: Mortgage Investment | |
| MarketCap: 163.239 Millions | |
| Recent Price: 17.37 Smart Investing & Trading Score: 93 | |
| Day Percent Change: 4.51% Day Change: 0.75 | |
| Week Change: -1.53% Year-to-date Change: -6.6% | |
| BRT Links: Profile News Message Board | |
| Charts:- Daily , Weekly | |
| Add BRT to Watchlist: View: Get Complete BRT Trend Analysis ➞ | |
 | WSBF Waterstone Financial, Inc. |
| Sector: Financials | |
| SubSector: Savings & Loans | |
| MarketCap: 371.93 Millions | |
| Recent Price: 11.59 Smart Investing & Trading Score: 59 | |
| Day Percent Change: 4.51% Day Change: 0.50 | |
| Week Change: 2.39% Year-to-date Change: -18.4% | |
| WSBF Links: Profile News Message Board | |
| Charts:- Daily , Weekly | |
| Add WSBF to Watchlist: View: Get Complete WSBF Trend Analysis ➞ | |
 | PPBI Pacific Premier Bancorp, Inc. |
| Sector: Financials | |
| SubSector: Regional - Pacific Banks | |
| MarketCap: 978.029 Millions | |
| Recent Price: 22.27 Smart Investing & Trading Score: 52 | |
| Day Percent Change: 4.50% Day Change: 0.96 | |
| Week Change: 1.88% Year-to-date Change: -23.5% | |
| PPBI Links: Profile News Message Board | |
| Charts:- Daily , Weekly | |
| Add PPBI to Watchlist: View: Get Complete PPBI Trend Analysis ➞ | |
 | ACNB ACNB Corporation |
| Sector: Financials | |
| SubSector: Regional - Southwest Banks | |
| MarketCap: 231.065 Millions | |
| Recent Price: 32.49 Smart Investing & Trading Score: 42 | |
| Day Percent Change: 4.47% Day Change: 1.39 | |
| Week Change: -0.49% Year-to-date Change: -27.4% | |
| ACNB Links: Profile News Message Board | |
| Charts:- Daily , Weekly | |
| Add ACNB to Watchlist: View: Get Complete ACNB Trend Analysis ➞ | |
 | MBWM Mercantile Bank Corporation |
| Sector: Financials | |
| SubSector: Regional - Midwest Banks | |
| MarketCap: 372.77 Millions | |
| Recent Price: 36.07 Smart Investing & Trading Score: 42 | |
| Day Percent Change: 4.46% Day Change: 1.54 | |
| Week Change: 0.92% Year-to-date Change: -10.7% | |
| MBWM Links: Profile News Message Board | |
| Charts:- Daily , Weekly | |
| Add MBWM to Watchlist: View: Get Complete MBWM Trend Analysis ➞ | |
 | PGC Peapack-Gladstone Financial Corporation |
| Sector: Financials | |
| SubSector: Regional - Northeast Banks | |
| MarketCap: 284.399 Millions | |
| Recent Price: 24.13 Smart Investing & Trading Score: 52 | |
| Day Percent Change: 4.46% Day Change: 1.03 | |
| Week Change: 4.01% Year-to-date Change: -19.1% | |
| PGC Links: Profile News Message Board | |
| Charts:- Daily , Weekly | |
| Add PGC to Watchlist: View: Get Complete PGC Trend Analysis ➞ | |
 | GCBC Greene County Bancorp, Inc. |
| Sector: Financials | |
| SubSector: Savings & Loans | |
| MarketCap: 314.83 Millions | |
| Recent Price: 28.60 Smart Investing & Trading Score: 93 | |
| Day Percent Change: 4.38% Day Change: 1.20 | |
| Week Change: 7.64% Year-to-date Change: 1.4% | |
| GCBC Links: Profile News Message Board | |
| Charts:- Daily , Weekly | |
| Add GCBC to Watchlist: View: Get Complete GCBC Trend Analysis ➞ | |
| For tabular summary view of above stock list: Summary View ➞ 0 - 25 , 25 - 50 , 50 - 75 , 75 - 100 , 100 - 125 , 125 - 150 , 150 - 175 , 175 - 200 , 200 - 225 , 225 - 250 , 250 - 275 , 275 - 300 , 300 - 325 , 325 - 350 , 350 - 375 , 375 - 400 , 400 - 425 , 425 - 450 , 450 - 475 , 475 - 500 , 500 - 525 , 525 - 550 , 550 - 575 , 575 - 600 , 600 - 625 , 625 - 650 , 650 - 675 , 675 - 700 , 700 - 725 , 725 - 750 , 750 - 775 , 775 - 800 , 800 - 825 , 825 - 850 , 850 - 875 , 875 - 900 , 900 - 925 , 925 - 950 , 950 - 975 , 975 - 1000 , 1000 - 1025 , 1025 - 1050 , 1050 - 1075 , 1075 - 1100 , 1100 - 1125 , 1125 - 1150 , 1150 - 1175 , 1175 - 1200 , 1200 - 1225 , 1225 - 1250 | ||
| Click To Change The Sort Order: By Market Cap or Company Size Performance: Year-to-date, Week and Day | |
| Select Chart Type: | ||
|
Best Stocks Today 12Stocks.com |
© 2024 12Stocks.com Terms & Conditions Privacy Contact Us
All Information Provided Only For Education And Not To Be Used For Investing or Trading. See Terms & Conditions


One More Thing ... Get Best Stocks Delivered Daily!
Never Ever Miss A Move With Our Top Ten Stocks Lists
Find Best Stocks In Any Market - Bull or Bear Market
Take A Peek At Our Top Ten Stocks Lists: Daily, Weekly, Year-to-Date & Top Trends
Find Best Stocks In Any Market - Bull or Bear Market
Take A Peek At Our Top Ten Stocks Lists: Daily, Weekly, Year-to-Date & Top Trends
Financial Stocks With Best Up Trends [0-bearish to 100-bullish]: BancFirst [100], Old Second[100], Angel Oak[100], Tejon Ranch[100], United Fire[100], Victory Capital[100], Wells Fargo[100], Macatawa Bank[100], Amerisafe [100], ASA Gold[100], Stellus Capital[100]
Best Financial Stocks Year-to-Date:
Root [394.17%], Hippo [119.76%], Gladstone Capital[96.64%], Banco Macro[73.59%], Grupo Financiero[64.84%], Banco BBVA[57.54%], Yiren Digital[54.81%], First [51.04%], Fidelis Insurance[51.01%], EverQuote [50.25%], Heritage Insurance[46.93%] Best Financial Stocks This Week:
Macatawa Bank[47.34%], Metropolitan Bank[13.32%], Globe Life[12.95%], Medical Properties[10.78%], Victory Capital[10.59%], James River[10.4%], Chemung [10.1%], Southern First[9.19%], Summit [8.28%], BancFirst [7.85%], Bancorp [7.81%] Best Financial Stocks Daily:
Metropolitan Bank[18.01%], Chemung [10.29%], Cohen & Steers[9.50%], Clipper Realty[9.49%], BancFirst [8.86%], Summit [8.45%], Home Bancorp[7.41%], Bar Harbor[6.79%], Southern First[6.38%], American Express[6.23%], Banco BBVA[6.20%]