
 Login Sign Up


| |||||
 |  | ||||

| 12Stocks.com Market Intelligence |
Best Financial Stocks
| In a hurry? Financial Stocks Lists: Performance Trends Table, Stock Charts
Sort Financial stocks: Daily, Weekly, Year-to-Date, Market Cap & Trends. Filter Financial stocks list by size:All Financial Large Mid-Range Small & MicroCap |
| 12Stocks.com Financial Stocks Performances & Trends Daily | |||||||||
|
|  The overall Smart Investing & Trading Score is 63 (0-bearish to 100-bullish) which puts Financial sector in short term neutral to bullish trend. The Smart Investing & Trading Score from previous trading session is 56 and hence an improvement of trend.
| ||||||||
Here are the Smart Investing & Trading Scores of the most requested Financial stocks at 12Stocks.com (click stock name for detailed review):
|


| 12Stocks.com: Investing in Financial sector with Stocks | |
|
The following table helps investors and traders sort through current performance and trends (as measured by Smart Investing & Trading Score) of various
stocks in the Financial sector. Quick View: Move mouse or cursor over stock symbol (ticker) to view short-term Technical chart and over stock name to view long term chart. Click on  to add stock symbol to your watchlist and to add stock symbol to your watchlist and  to view watchlist. Click on any ticker or stock name for detailed market intelligence report for that stock. to view watchlist. Click on any ticker or stock name for detailed market intelligence report for that stock. |
12Stocks.com Performance of Stocks in Financial Sector
| Ticker | Stock Name | Watchlist | Category | Recent Price | Smart Investing & Trading Score | Change % | YTD Change% |
| BHLB | Berkshire Hills |   | S&L | 21.71 | 52 | 3.48 | -12.57% |
| PEBO | Peoples Bancorp | | Regional Banks | 28.49 | 52 | 3.45 | -15.61% |
| FNWB | First Northwest | | S&L | 10.60 | 10 | 3.41 | -33.50% |
| HOMB | Home Bancshares | | Banks | 24.01 | 78 | 3.40 | -5.21% |
| WSFS | WSFS | | Regional Banks | 43.27 | 52 | 3.39 | -5.79% |
| SAMG | Silvercrest Asset | | Asset Mgmt | 14.62 | 32 | 3.39 | -14.00% |
| FBNC | First Bancorp | | Regional Banks | 32.31 | 42 | 3.36 | -12.70% |
| BAC | Bank of America | | Banks | 36.97 | 68 | 3.35 | 9.80% |
| FRPH | FRP | | Property Mgmt | 30.36 | 32 | 3.34 | -51.72% |
| ABCB | Ameris Bancorp | | Regional Banks | 46.28 | 47 | 3.33 | -12.76% |
| UVE | Universal Insurance | | Insurance | 19.62 | 70 | 3.32 | 22.78% |
| IBCP | Independent Bank | | Regional Banks | 24.36 | 42 | 3.31 | -6.38% |
| CFG | Citizens | | Regional Banks | 33.99 | 68 | 3.31 | 2.56% |
| BDN | Brandywine Realty | | REIT - | 4.38 | 47 | 3.30 | -18.89% |
| PWOD | Penns Woods | | Regional Banks | 17.96 | 42 | 3.28 | -20.21% |
| NWBI | Northwest Bancshares | | S&L | 11.13 | 52 | 3.25 | -10.82% |
| BKU | BankUnited | | Regional Banks | 26.71 | 52 | 3.25 | -17.64% |
| HTH | Hilltop | | Mortgage | 29.99 | 42 | 3.24 | -14.83% |
| LOB | Live Oak | | S&L | 37.90 | 63 | 3.24 | -16.70% |
| AUB | Atlantic Union | | Regional Banks | 33.22 | 47 | 3.23 | -9.09% |
| WAFD | Washington Federal | | S&L | 27.90 | 52 | 3.22 | -15.35% |
| COLB | Columbia Banking | | S&L | 18.31 | 52 | 3.21 | -31.37% |
| FCF | First Commonwealth | | Regional Banks | 13.20 | 52 | 3.21 | -14.51% |
| PKST | Peakstone Realty | | REIT - | 12.88 | 42 | 3.21 | -37.23% |
| BY | Byline Bancorp | | Regional Banks | 20.72 | 52 | 3.19 | -12.05% |
| For chart view version of above stock list: Chart View ➞ 0 - 25 , 25 - 50 , 50 - 75 , 75 - 100 , 100 - 125 , 125 - 150 , 150 - 175 , 175 - 200 , 200 - 225 , 225 - 250 , 250 - 275 , 275 - 300 , 300 - 325 , 325 - 350 , 350 - 375 , 375 - 400 , 400 - 425 , 425 - 450 , 450 - 475 , 475 - 500 , 500 - 525 , 525 - 550 , 550 - 575 , 575 - 600 , 600 - 625 , 625 - 650 , 650 - 675 , 675 - 700 , 700 - 725 , 725 - 750 , 750 - 775 , 775 - 800 , 800 - 825 , 825 - 850 , 850 - 875 , 875 - 900 , 900 - 925 , 925 - 950 , 950 - 975 , 975 - 1000 , 1000 - 1025 , 1025 - 1050 , 1050 - 1075 , 1075 - 1100 , 1100 - 1125 , 1125 - 1150 , 1150 - 1175 , 1175 - 1200 , 1200 - 1225 , 1225 - 1250 | ||
 | Click To Change The Sort Order: By Market Cap or Company Size Performance: Year-to-date, Week and Day |  |
|
Get the most comprehensive stock market coverage daily at 12Stocks.com ➞ Best Stocks Today ➞ Best Stocks Weekly ➞ Best Stocks Year-to-Date ➞ Best Stocks Trends ➞  Best Stocks Today 12Stocks.com Best Nasdaq Stocks ➞ Best S&P 500 Stocks ➞ Best Tech Stocks ➞ Best Biotech Stocks ➞ |
| Detailed Overview of Financial Stocks |
| Financial Technical Overview, Leaders & Laggards, Top Financial ETF Funds & Detailed Financial Stocks List, Charts, Trends & More |
| Financial Sector: Technical Analysis, Trends & YTD Performance | |
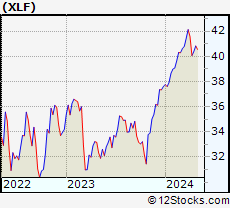
| Financial sector is composed of stocks
from banks, brokers, insurance, REITs
and services subsectors. Financial sector, as represented by XLF, an exchange-traded fund [ETF] that holds basket of Financial stocks (e.g, Bank of America, Goldman Sachs) is up by 7.39% and is currently outperforming the overall market by 4.01% year-to-date. Below is a quick view of Technical charts and trends: |
|
 XLF Weekly Chart |
|
| Long Term Trend: Very Good | |
| Medium Term Trend: Not Good | |
 XLF Daily Chart |
|
| Short Term Trend: Very Good | |
| Overall Trend Score: 63 | |
| YTD Performance: 7.39% | |
| **Trend Scores & Views Are Only For Educational Purposes And Not For Investing | |
| 12Stocks.com: Top Performing Financial Sector Stocks | ||||||||||||||||||||||||||||||||||||||||||||||||
 The top performing Financial sector stocks year to date are
Now, more recently, over last week, the top performing Financial sector stocks on the move are


|
||||||||||||||||||||||||||||||||||||||||||||||||
| 12Stocks.com: Investing in Financial Sector using Exchange Traded Funds | |
|
The following table shows list of key exchange traded funds (ETF) that
help investors track Financial Index. For detailed view, check out our ETF Funds section of our website. Quick View: Move mouse or cursor over ETF symbol (ticker) to view short-term Technical chart and over ETF name to view long term chart. Click on ticker or stock name for detailed view. Click on to add stock symbol to your watchlist and to view watchlist. |
12Stocks.com List of ETFs that track Financial Index
| Ticker | ETF Name | Watchlist | Recent Price | Smart Investing & Trading Score | Change % | Week % | Year-to-date % |
| XLF | Financial | | 40.38 | 63 | 1.38 | 0.8 | 7.39% |
| IAI | Broker-Dealers & Secs | | 111.03 | 63 | 0.47 | 0.18 | 2.3% |
| IYF | Financials | | 91.30 | 63 | 1.40 | 0.83 | 6.9% |
| IYG | Financial Services | | 63.42 | 63 | 1.19 | 0.33 | 6.16% |
| KRE | Regional Banking | | 47.32 | 42 | 2.62 | 1.72 | -9.75% |
| IXG | Global Financials | | 82.86 | 63 | 0.64 | 0.24 | 5.45% |
| VFH | Financials | | 97.75 | 63 | 1.40 | 0.59 | 5.95% |
| KBE | Bank | | 44.41 | 42 | 2.33 | 1.42 | -3.5% |
| FAS | Financial Bull 3X | | 97.93 | 63 | 4.03 | 1.78 | 18.49% |
| FAZ | Financial Bear 3X | | 11.20 | 32 | -3.95 | -1.84 | -18.07% |
| UYG | Financials | | 62.44 | 63 | 2.78 | 1.58 | 13.12% |
| IAT | Regional Banks | | 40.74 | 55 | 2.52 | 0.74 | -2.63% |
| KIE | Insurance | | 49.08 | 58 | 1.66 | 1.57 | 8.54% |
| PSCF | SmallCap Financials | | 45.47 | 42 | 1.59 | 0.13 | -7.54% |
| EUFN | Europe Financials | | 21.95 | 63 | 0.37 | 0.27 | 4.72% |
| PGF | Financial Preferred | | 14.53 | 25 | 0.55 | -1.02 | -0.34% |
| 12Stocks.com: Charts, Trends, Fundamental Data and Performances of Financial Stocks | |
|
We now take in-depth look at all Financial stocks including charts, multi-period performances and overall trends (as measured by Smart Investing & Trading Score). One can sort Financial stocks (click link to choose) by Daily, Weekly and by Year-to-Date performances. Also, one can sort by size of the company or by market capitalization. |
| Select Your Default Chart Type: | |||||
| |||||
| Click on stock symbol or name for detailed view. Click on to add stock symbol to your watchlist and to view watchlist. Quick View: Move mouse or cursor over "Daily" to quickly view daily Technical stock chart and over "Weekly" to view weekly Technical stock chart. | |||||

 | BHLB Berkshire Hills Bancorp, Inc. |
| Sector: Financials | |
| SubSector: Savings & Loans | |
| MarketCap: 686.33 Millions | |
| Recent Price: 21.71 Smart Investing & Trading Score: 52 | |
| Day Percent Change: 3.48% Day Change: 0.73 | |
| Week Change: 3.83% Year-to-date Change: -12.6% | |
| BHLB Links: Profile News Message Board | |
| Charts:- Daily , Weekly | |
| Add BHLB to Watchlist: View: Get Complete BHLB Trend Analysis ➞ | |
 | PEBO Peoples Bancorp Inc. |
| Sector: Financials | |
| SubSector: Regional - Midwest Banks | |
| MarketCap: 449.77 Millions | |
| Recent Price: 28.49 Smart Investing & Trading Score: 52 | |
| Day Percent Change: 3.45% Day Change: 0.95 | |
| Week Change: 2.52% Year-to-date Change: -15.6% | |
| PEBO Links: Profile News Message Board | |
| Charts:- Daily , Weekly | |
| Add PEBO to Watchlist: View: Get Complete PEBO Trend Analysis ➞ | |
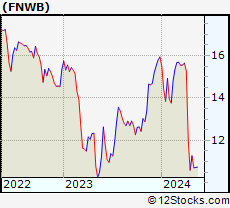 | FNWB First Northwest Bancorp |
| Sector: Financials | |
| SubSector: Savings & Loans | |
| MarketCap: 126.83 Millions | |
| Recent Price: 10.60 Smart Investing & Trading Score: 10 | |
| Day Percent Change: 3.41% Day Change: 0.35 | |
| Week Change: -11.74% Year-to-date Change: -33.5% | |
| FNWB Links: Profile News Message Board | |
| Charts:- Daily , Weekly | |
| Add FNWB to Watchlist: View: Get Complete FNWB Trend Analysis ➞ | |
 | HOMB Home Bancshares, Inc. (Conway, AR) |
| Sector: Financials | |
| SubSector: Money Center Banks | |
| MarketCap: 2090.49 Millions | |
| Recent Price: 24.01 Smart Investing & Trading Score: 78 | |
| Day Percent Change: 3.40% Day Change: 0.79 | |
| Week Change: 4.71% Year-to-date Change: -5.2% | |
| HOMB Links: Profile News Message Board | |
| Charts:- Daily , Weekly | |
| Add HOMB to Watchlist: View: Get Complete HOMB Trend Analysis ➞ | |
 | WSFS WSFS Financial Corporation |
| Sector: Financials | |
| SubSector: Regional - Mid-Atlantic Banks | |
| MarketCap: 1191.29 Millions | |
| Recent Price: 43.27 Smart Investing & Trading Score: 52 | |
| Day Percent Change: 3.39% Day Change: 1.42 | |
| Week Change: 1.22% Year-to-date Change: -5.8% | |
| WSFS Links: Profile News Message Board | |
| Charts:- Daily , Weekly | |
| Add WSFS to Watchlist: View: Get Complete WSFS Trend Analysis ➞ | |
 | SAMG Silvercrest Asset Management Group Inc. |
| Sector: Financials | |
| SubSector: Asset Management | |
| MarketCap: 116.303 Millions | |
| Recent Price: 14.62 Smart Investing & Trading Score: 32 | |
| Day Percent Change: 3.39% Day Change: 0.48 | |
| Week Change: -1.22% Year-to-date Change: -14.0% | |
| SAMG Links: Profile News Message Board | |
| Charts:- Daily , Weekly | |
| Add SAMG to Watchlist: View: Get Complete SAMG Trend Analysis ➞ | |
 | FBNC First Bancorp |
| Sector: Financials | |
| SubSector: Regional - Mid-Atlantic Banks | |
| MarketCap: 664.959 Millions | |
| Recent Price: 32.31 Smart Investing & Trading Score: 42 | |
| Day Percent Change: 3.36% Day Change: 1.05 | |
| Week Change: -1.13% Year-to-date Change: -12.7% | |
| FBNC Links: Profile News Message Board | |
| Charts:- Daily , Weekly | |
| Add FBNC to Watchlist: View: Get Complete FBNC Trend Analysis ➞ | |
 | BAC Bank of America Corporation |
| Sector: Financials | |
| SubSector: Money Center Banks | |
| MarketCap: 189690 Millions | |
| Recent Price: 36.97 Smart Investing & Trading Score: 68 | |
| Day Percent Change: 3.35% Day Change: 1.20 | |
| Week Change: 3.3% Year-to-date Change: 9.8% | |
| BAC Links: Profile News Message Board | |
| Charts:- Daily , Weekly | |
| Add BAC to Watchlist: View: Get Complete BAC Trend Analysis ➞ | |
 | FRPH FRP Holdings, Inc. |
| Sector: Financials | |
| SubSector: Property Management | |
| MarketCap: 374.442 Millions | |
| Recent Price: 30.36 Smart Investing & Trading Score: 32 | |
| Day Percent Change: 3.34% Day Change: 0.98 | |
| Week Change: -49.58% Year-to-date Change: -51.7% | |
| FRPH Links: Profile News Message Board | |
| Charts:- Daily , Weekly | |
| Add FRPH to Watchlist: View: Get Complete FRPH Trend Analysis ➞ | |
 | ABCB Ameris Bancorp |
| Sector: Financials | |
| SubSector: Regional - Mid-Atlantic Banks | |
| MarketCap: 1537.79 Millions | |
| Recent Price: 46.28 Smart Investing & Trading Score: 47 | |
| Day Percent Change: 3.33% Day Change: 1.49 | |
| Week Change: 2.48% Year-to-date Change: -12.8% | |
| ABCB Links: Profile News Message Board | |
| Charts:- Daily , Weekly | |
| Add ABCB to Watchlist: View: Get Complete ABCB Trend Analysis ➞ | |
 | UVE Universal Insurance Holdings, Inc. |
| Sector: Financials | |
| SubSector: Property & Casualty Insurance | |
| MarketCap: 616.212 Millions | |
| Recent Price: 19.62 Smart Investing & Trading Score: 70 | |
| Day Percent Change: 3.32% Day Change: 0.63 | |
| Week Change: 4.08% Year-to-date Change: 22.8% | |
| UVE Links: Profile News Message Board | |
| Charts:- Daily , Weekly | |
| Add UVE to Watchlist: View: Get Complete UVE Trend Analysis ➞ | |
 | IBCP Independent Bank Corporation |
| Sector: Financials | |
| SubSector: Regional - Midwest Banks | |
| MarketCap: 273.67 Millions | |
| Recent Price: 24.36 Smart Investing & Trading Score: 42 | |
| Day Percent Change: 3.31% Day Change: 0.78 | |
| Week Change: 4.64% Year-to-date Change: -6.4% | |
| IBCP Links: Profile News Message Board | |
| Charts:- Daily , Weekly | |
| Add IBCP to Watchlist: View: Get Complete IBCP Trend Analysis ➞ | |
 | CFG Citizens Financial Group, Inc. |
| Sector: Financials | |
| SubSector: Regional - Mid-Atlantic Banks | |
| MarketCap: 8225.19 Millions | |
| Recent Price: 33.99 Smart Investing & Trading Score: 68 | |
| Day Percent Change: 3.31% Day Change: 1.09 | |
| Week Change: 2.56% Year-to-date Change: 2.6% | |
| CFG Links: Profile News Message Board | |
| Charts:- Daily , Weekly | |
| Add CFG to Watchlist: View: Get Complete CFG Trend Analysis ➞ | |
 | BDN Brandywine Realty Trust |
| Sector: Financials | |
| SubSector: REIT - Diversified | |
| MarketCap: 1688.13 Millions | |
| Recent Price: 4.38 Smart Investing & Trading Score: 47 | |
| Day Percent Change: 3.30% Day Change: 0.14 | |
| Week Change: 0.46% Year-to-date Change: -18.9% | |
| BDN Links: Profile News Message Board | |
| Charts:- Daily , Weekly | |
| Add BDN to Watchlist: View: Get Complete BDN Trend Analysis ➞ | |
 | PWOD Penns Woods Bancorp, Inc. |
| Sector: Financials | |
| SubSector: Regional - Mid-Atlantic Banks | |
| MarketCap: 152.559 Millions | |
| Recent Price: 17.96 Smart Investing & Trading Score: 42 | |
| Day Percent Change: 3.28% Day Change: 0.57 | |
| Week Change: 0.62% Year-to-date Change: -20.2% | |
| PWOD Links: Profile News Message Board | |
| Charts:- Daily , Weekly | |
| Add PWOD to Watchlist: View: Get Complete PWOD Trend Analysis ➞ | |
 | NWBI Northwest Bancshares, Inc. |
| Sector: Financials | |
| SubSector: Savings & Loans | |
| MarketCap: 1266.3 Millions | |
| Recent Price: 11.13 Smart Investing & Trading Score: 52 | |
| Day Percent Change: 3.25% Day Change: 0.35 | |
| Week Change: 2.87% Year-to-date Change: -10.8% | |
| NWBI Links: Profile News Message Board | |
| Charts:- Daily , Weekly | |
| Add NWBI to Watchlist: View: Get Complete NWBI Trend Analysis ➞ | |
 | BKU BankUnited, Inc. |
| Sector: Financials | |
| SubSector: Regional - Mid-Atlantic Banks | |
| MarketCap: 1905.99 Millions | |
| Recent Price: 26.71 Smart Investing & Trading Score: 52 | |
| Day Percent Change: 3.25% Day Change: 0.84 | |
| Week Change: 5.78% Year-to-date Change: -17.6% | |
| BKU Links: Profile News Message Board | |
| Charts:- Daily , Weekly | |
| Add BKU to Watchlist: View: Get Complete BKU Trend Analysis ➞ | |
 | HTH Hilltop Holdings Inc. |
| Sector: Financials | |
| SubSector: Mortgage Investment | |
| MarketCap: 1317.89 Millions | |
| Recent Price: 29.99 Smart Investing & Trading Score: 42 | |
| Day Percent Change: 3.24% Day Change: 0.94 | |
| Week Change: 1.59% Year-to-date Change: -14.8% | |
| HTH Links: Profile News Message Board | |
| Charts:- Daily , Weekly | |
| Add HTH to Watchlist: View: Get Complete HTH Trend Analysis ➞ | |
 | LOB Live Oak Bancshares, Inc. |
| Sector: Financials | |
| SubSector: Savings & Loans | |
| MarketCap: 394.23 Millions | |
| Recent Price: 37.90 Smart Investing & Trading Score: 63 | |
| Day Percent Change: 3.24% Day Change: 1.19 | |
| Week Change: -0.08% Year-to-date Change: -16.7% | |
| LOB Links: Profile News Message Board | |
| Charts:- Daily , Weekly | |
| Add LOB to Watchlist: View: Get Complete LOB Trend Analysis ➞ | |
 | AUB Atlantic Union Bankshares Corporation |
| Sector: Financials | |
| SubSector: Regional - Mid-Atlantic Banks | |
| MarketCap: 1728.79 Millions | |
| Recent Price: 33.22 Smart Investing & Trading Score: 47 | |
| Day Percent Change: 3.23% Day Change: 1.04 | |
| Week Change: 3.62% Year-to-date Change: -9.1% | |
| AUB Links: Profile News Message Board | |
| Charts:- Daily , Weekly | |
| Add AUB to Watchlist: View: Get Complete AUB Trend Analysis ➞ | |
 | WAFD Washington Federal, Inc. |
| Sector: Financials | |
| SubSector: Savings & Loans | |
| MarketCap: 2219.2 Millions | |
| Recent Price: 27.90 Smart Investing & Trading Score: 52 | |
| Day Percent Change: 3.22% Day Change: 0.87 | |
| Week Change: 3.91% Year-to-date Change: -15.4% | |
| WAFD Links: Profile News Message Board | |
| Charts:- Daily , Weekly | |
| Add WAFD to Watchlist: View: Get Complete WAFD Trend Analysis ➞ | |
 | COLB Columbia Banking System, Inc. |
| Sector: Financials | |
| SubSector: Savings & Loans | |
| MarketCap: 1868.3 Millions | |
| Recent Price: 18.31 Smart Investing & Trading Score: 52 | |
| Day Percent Change: 3.21% Day Change: 0.57 | |
| Week Change: 3.74% Year-to-date Change: -31.4% | |
| COLB Links: Profile News Message Board | |
| Charts:- Daily , Weekly | |
| Add COLB to Watchlist: View: Get Complete COLB Trend Analysis ➞ | |
 | FCF First Commonwealth Financial Corporation |
| Sector: Financials | |
| SubSector: Regional - Northeast Banks | |
| MarketCap: 900.299 Millions | |
| Recent Price: 13.20 Smart Investing & Trading Score: 52 | |
| Day Percent Change: 3.21% Day Change: 0.41 | |
| Week Change: 3.61% Year-to-date Change: -14.5% | |
| FCF Links: Profile News Message Board | |
| Charts:- Daily , Weekly | |
| Add FCF to Watchlist: View: Get Complete FCF Trend Analysis ➞ | |
 | PKST Peakstone Realty Trust |
| Sector: Financials | |
| SubSector: REIT - Diversified | |
| MarketCap: 1050 Millions | |
| Recent Price: 12.88 Smart Investing & Trading Score: 42 | |
| Day Percent Change: 3.21% Day Change: 0.40 | |
| Week Change: -6.46% Year-to-date Change: -37.2% | |
| PKST Links: Profile News Message Board | |
| Charts:- Daily , Weekly | |
| Add PKST to Watchlist: View: Get Complete PKST Trend Analysis ➞ | |
 | BY Byline Bancorp, Inc. |
| Sector: Financials | |
| SubSector: Regional - Midwest Banks | |
| MarketCap: 381.87 Millions | |
| Recent Price: 20.72 Smart Investing & Trading Score: 52 | |
| Day Percent Change: 3.19% Day Change: 0.64 | |
| Week Change: 2.63% Year-to-date Change: -12.1% | |
| BY Links: Profile News Message Board | |
| Charts:- Daily , Weekly | |
| Add BY to Watchlist: View: Get Complete BY Trend Analysis ➞ | |
| For tabular summary view of above stock list: Summary View ➞ 0 - 25 , 25 - 50 , 50 - 75 , 75 - 100 , 100 - 125 , 125 - 150 , 150 - 175 , 175 - 200 , 200 - 225 , 225 - 250 , 250 - 275 , 275 - 300 , 300 - 325 , 325 - 350 , 350 - 375 , 375 - 400 , 400 - 425 , 425 - 450 , 450 - 475 , 475 - 500 , 500 - 525 , 525 - 550 , 550 - 575 , 575 - 600 , 600 - 625 , 625 - 650 , 650 - 675 , 675 - 700 , 700 - 725 , 725 - 750 , 750 - 775 , 775 - 800 , 800 - 825 , 825 - 850 , 850 - 875 , 875 - 900 , 900 - 925 , 925 - 950 , 950 - 975 , 975 - 1000 , 1000 - 1025 , 1025 - 1050 , 1050 - 1075 , 1075 - 1100 , 1100 - 1125 , 1125 - 1150 , 1150 - 1175 , 1175 - 1200 , 1200 - 1225 , 1225 - 1250 | ||
| Click To Change The Sort Order: By Market Cap or Company Size Performance: Year-to-date, Week and Day | |
| Select Chart Type: | ||
|
Best Stocks Today 12Stocks.com |
© 2024 12Stocks.com Terms & Conditions Privacy Contact Us
All Information Provided Only For Education And Not To Be Used For Investing or Trading. See Terms & Conditions


One More Thing ... Get Best Stocks Delivered Daily!
Never Ever Miss A Move With Our Top Ten Stocks Lists
Find Best Stocks In Any Market - Bull or Bear Market
Take A Peek At Our Top Ten Stocks Lists: Daily, Weekly, Year-to-Date & Top Trends
Find Best Stocks In Any Market - Bull or Bear Market
Take A Peek At Our Top Ten Stocks Lists: Daily, Weekly, Year-to-Date & Top Trends
Financial Stocks With Best Up Trends [0-bearish to 100-bullish]: BancFirst [100], Old Second[100], Angel Oak[100], Tejon Ranch[100], United Fire[100], Victory Capital[100], Wells Fargo[100], Macatawa Bank[100], Amerisafe [100], ASA Gold[100], Stellus Capital[100]
Best Financial Stocks Year-to-Date:
Root [394.17%], Hippo [119.76%], Gladstone Capital[96.64%], Banco Macro[73.59%], Grupo Financiero[64.84%], Banco BBVA[57.54%], Yiren Digital[54.81%], First [51.04%], Fidelis Insurance[51.01%], EverQuote [50.25%], Heritage Insurance[46.93%] Best Financial Stocks This Week:
Macatawa Bank[47.34%], Metropolitan Bank[13.32%], Globe Life[12.95%], Medical Properties[10.78%], Victory Capital[10.59%], James River[10.4%], Chemung [10.1%], Southern First[9.19%], Summit [8.28%], BancFirst [7.85%], Bancorp [7.81%] Best Financial Stocks Daily:
Metropolitan Bank[18.01%], Chemung [10.29%], Cohen & Steers[9.50%], Clipper Realty[9.49%], BancFirst [8.86%], Summit [8.45%], Home Bancorp[7.41%], Bar Harbor[6.79%], Southern First[6.38%], American Express[6.23%], Banco BBVA[6.20%]