
 Login Sign Up


| |||||
 |  | ||||

| 12Stocks.com Market Intelligence |
Best Financial Stocks
| In a hurry? Financial Stocks Lists: Performance Trends Table, Stock Charts
Sort Financial stocks: Daily, Weekly, Year-to-Date, Market Cap & Trends. Filter Financial stocks list by size:All Financial Large Mid-Range Small & MicroCap |
| 12Stocks.com Financial Stocks Performances & Trends Daily | |||||||||
|
|  The overall Smart Investing & Trading Score is 56 (0-bearish to 100-bullish) which puts Financial sector in short term neutral trend. The Smart Investing & Trading Score from previous trading session is 68 and hence a deterioration of trend.
| ||||||||
Here are the Smart Investing & Trading Scores of the most requested Financial stocks at 12Stocks.com (click stock name for detailed review):
|


| 12Stocks.com: Investing in Financial sector with Stocks | |
|
The following table helps investors and traders sort through current performance and trends (as measured by Smart Investing & Trading Score) of various
stocks in the Financial sector. Quick View: Move mouse or cursor over stock symbol (ticker) to view short-term Technical chart and over stock name to view long term chart. Click on  to add stock symbol to your watchlist and to add stock symbol to your watchlist and  to view watchlist. Click on any ticker or stock name for detailed market intelligence report for that stock. to view watchlist. Click on any ticker or stock name for detailed market intelligence report for that stock. |
12Stocks.com Performance of Stocks in Financial Sector
| Ticker | Stock Name | Watchlist | Category | Recent Price | Smart Investing & Trading Score | Change % | YTD Change% |
| RILY | B. Riley |   | Asset Mgmt | 34.69 | 100 | 16.61 | 65.27% |
| FCNCA | First Citizens | | Regional Banks | 1800.35 | 95 | 9.80 | 26.88% |
| DB | Deutsche Bank | | Foreign Banks | 17.92 | 100 | 8.74 | 32.25% |
| PVBC | Provident Bancorp | | Banks | 9.34 | 49 | 8.10 | -7.25% |
| BCS | Barclays | | Foreign Banks | 10.36 | 75 | 7.92 | 31.47% |
| GDXU | MicroSectors Gold | | Exchange Traded Fund | 36.49 | 43 | 5.71 | 9.28% |
| DUO | Fangdd Network | | Property Mgmt | 0.41 | 17 | 5.41 | -39.23% |
| ATLC | Atlanticus | | Credit Services | 26.10 | 42 | 4.90 | -32.51% |
| CPF | Central Pacific | | Regional Banks | 20.76 | 100 | 4.06 | 5.49% |
| BRDG | Bridge | | Asset Mgmt | 6.85 | 42 | 3.63 | -30.32% |
| CASH | Meta | | S&L | 52.92 | 62 | 3.58 | -0.02% |
| HAFC | Hanmi | | Regional Banks | 15.63 | 34 | 3.24 | -19.43% |
| TOP | TOP | | Capital Markets | 2.68 | 52 | 3.08 | -27.96% |
| PMT | PennyMac Mortgage | | Mortgage | 14.14 | 39 | 3.06 | -5.42% |
| LADR | Ladder Capital | | Mortgage | 10.80 | 42 | 2.86 | -6.17% |
| UVSP | Univest | | Regional Banks | 20.55 | 74 | 2.75 | -6.72% |
| MPB | Mid Penn | | Regional Banks | 20.98 | 74 | 2.74 | -13.59% |
| VIRT | Virtu | | Brokerage | 22.40 | 100 | 2.56 | 10.56% |
| PKST | Peakstone Realty | | REIT - | 14.35 | 59 | 2.50 | -30.07% |
| ASA | ASA Gold | | Asset Mgmt | 17.34 | 43 | 2.24 | 15.14% |
| HCI | HCI | | Insurance | 116.08 | 71 | 2.16 | 32.81% |
| OPAD | Offerpad | | Financials Services | 8.12 | 74 | 2.14 | -20.78% |
| NRIM | Northrim BanCorp | | Regional Banks | 47.97 | 34 | 2.13 | -16.15% |
| CFFI | C&F | | Regional Banks | 37.74 | 35 | 2.01 | -44.65% |
| NU | Nu | | Banks - | 10.87 | 56 | 1.87 | 30.34% |
| For chart view version of above stock list: Chart View ➞ 0 - 25 , 25 - 50 , 50 - 75 , 75 - 100 , 100 - 125 , 125 - 150 , 150 - 175 , 175 - 200 , 200 - 225 , 225 - 250 , 250 - 275 , 275 - 300 , 300 - 325 , 325 - 350 , 350 - 375 , 375 - 400 , 400 - 425 , 425 - 450 , 450 - 475 , 475 - 500 , 500 - 525 , 525 - 550 , 550 - 575 , 575 - 600 , 600 - 625 , 625 - 650 , 650 - 675 , 675 - 700 , 700 - 725 , 725 - 750 , 750 - 775 , 775 - 800 , 800 - 825 , 825 - 850 , 850 - 875 , 875 - 900 , 900 - 925 , 925 - 950 , 950 - 975 , 975 - 1000 , 1000 - 1025 , 1025 - 1050 , 1050 - 1075 , 1075 - 1100 , 1100 - 1125 , 1125 - 1150 , 1150 - 1175 , 1175 - 1200 , 1200 - 1225 , 1225 - 1250 | ||
 | Click To Change The Sort Order: By Market Cap or Company Size Performance: Year-to-date, Week and Day |  |
|
Get the most comprehensive stock market coverage daily at 12Stocks.com ➞ Best Stocks Today ➞ Best Stocks Weekly ➞ Best Stocks Year-to-Date ➞ Best Stocks Trends ➞  Best Stocks Today 12Stocks.com Best Nasdaq Stocks ➞ Best S&P 500 Stocks ➞ Best Tech Stocks ➞ Best Biotech Stocks ➞ |
| Detailed Overview of Financial Stocks |
| Financial Technical Overview, Leaders & Laggards, Top Financial ETF Funds & Detailed Financial Stocks List, Charts, Trends & More |
| Financial Sector: Technical Analysis, Trends & YTD Performance | |
| Financial sector is composed of stocks
from banks, brokers, insurance, REITs
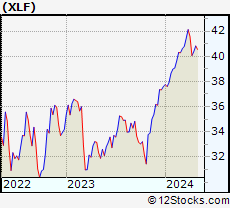
and services subsectors. Financial sector, as represented by XLF, an exchange-traded fund [ETF] that holds basket of Financial stocks (e.g, Bank of America, Goldman Sachs) is up by 8.72% and is currently outperforming the overall market by 3.56% year-to-date. Below is a quick view of Technical charts and trends: |
|
 XLF Weekly Chart |
|
| Long Term Trend: Very Good | |
| Medium Term Trend: Not Good | |
 XLF Daily Chart |
|
| Short Term Trend: Deteriorating | |
| Overall Trend Score: 56 | |
| YTD Performance: 8.72% | |
| **Trend Scores & Views Are Only For Educational Purposes And Not For Investing | |
| 12Stocks.com: Top Performing Financial Sector Stocks | ||||||||||||||||||||||||||||||||||||||||||||||||
 The top performing Financial sector stocks year to date are
Now, more recently, over last week, the top performing Financial sector stocks on the move are


|
||||||||||||||||||||||||||||||||||||||||||||||||
| 12Stocks.com: Investing in Financial Sector using Exchange Traded Funds | |
|
The following table shows list of key exchange traded funds (ETF) that
help investors track Financial Index. For detailed view, check out our ETF Funds section of our website. Quick View: Move mouse or cursor over ETF symbol (ticker) to view short-term Technical chart and over ETF name to view long term chart. Click on ticker or stock name for detailed view. Click on to add stock symbol to your watchlist and to view watchlist. |
12Stocks.com List of ETFs that track Financial Index
| Ticker | ETF Name | Watchlist | Recent Price | Smart Investing & Trading Score | Change % | Week % | Year-to-date % |
| XLF | Financial | | 40.88 | 56 | -0.58 | 1.24 | 8.72% |
| IAI | Broker-Dealers & Secs | | 112.15 | 48 | -0.66 | 1.01 | 3.34% |
| IYF | Financials | | 92.49 | 68 | -0.51 | 1.3 | 8.29% |
| IYG | Financial Services | | 64.56 | 76 | -0.54 | 1.8 | 8.07% |
| KRE | Regional Banking | | 48.47 | 67 | -1.10 | 2.43 | -7.55% |
| IXG | Global Financials | | 84.44 | 53 | -0.03 | 1.91 | 7.46% |
| VFH | Financials | | 99.12 | 68 | -0.60 | 1.4 | 7.44% |
| KBE | Bank | | 45.47 | 73 | -1.07 | 2.39 | -1.2% |
| FAS | Financial Bull 3X | | 101.43 | 61 | -1.72 | 3.57 | 22.72% |
| FAZ | Financial Bear 3X | | 10.79 | 40 | 1.70 | -3.66 | -21.07% |
| UYG | Financials | | 63.92 | 56 | -1.27 | 2.37 | 15.8% |
| IAT | Regional Banks | | 41.85 | 93 | -0.85 | 2.72 | 0.02% |
| KIE | Insurance | | 49.30 | 51 | -0.74 | 0.45 | 9.02% |
| PSCF | SmallCap Financials | | 46.29 | 65 | -1.59 | 1.8 | -5.88% |
| EUFN | Europe Financials | | 22.34 | 68 | -0.36 | 1.78 | 6.58% |
| PGF | Financial Preferred | | 14.57 | 37 | -1.09 | 0.28 | -0.07% |
| 12Stocks.com: Charts, Trends, Fundamental Data and Performances of Financial Stocks | |
|
We now take in-depth look at all Financial stocks including charts, multi-period performances and overall trends (as measured by Smart Investing & Trading Score). One can sort Financial stocks (click link to choose) by Daily, Weekly and by Year-to-Date performances. Also, one can sort by size of the company or by market capitalization. |
| Select Your Default Chart Type: | |||||
| |||||
| Click on stock symbol or name for detailed view. Click on to add stock symbol to your watchlist and to view watchlist. Quick View: Move mouse or cursor over "Daily" to quickly view daily Technical stock chart and over "Weekly" to view weekly Technical stock chart. | |||||

 | RILY B. Riley Financial, Inc. |
| Sector: Financials | |
| SubSector: Asset Management | |
| MarketCap: 443.703 Millions | |
| Recent Price: 34.69 Smart Investing & Trading Score: 100 | |
| Day Percent Change: 16.61% Day Change: 4.94 | |
| Week Change: 73.54% Year-to-date Change: 65.3% | |
| RILY Links: Profile News Message Board | |
| Charts:- Daily , Weekly | |
| Add RILY to Watchlist: View: Get Complete RILY Trend Analysis ➞ | |
 | FCNCA First Citizens BancShares, Inc. |
| Sector: Financials | |
| SubSector: Regional - Mid-Atlantic Banks | |
| MarketCap: 3157.19 Millions | |
| Recent Price: 1800.35 Smart Investing & Trading Score: 95 | |
| Day Percent Change: 9.80% Day Change: 160.72 | |
| Week Change: 14.87% Year-to-date Change: 26.9% | |
| FCNCA Links: Profile News Message Board | |
| Charts:- Daily , Weekly | |
| Add FCNCA to Watchlist: View: Get Complete FCNCA Trend Analysis ➞ | |
 | DB Deutsche Bank Aktiengesellschaft |
| Sector: Financials | |
| SubSector: Foreign Regional Banks | |
| MarketCap: 14500.5 Millions | |
| Recent Price: 17.92 Smart Investing & Trading Score: 100 | |
| Day Percent Change: 8.74% Day Change: 1.44 | |
| Week Change: 12.63% Year-to-date Change: 32.3% | |
| DB Links: Profile News Message Board | |
| Charts:- Daily , Weekly | |
| Add DB to Watchlist: View: Get Complete DB Trend Analysis ➞ | |
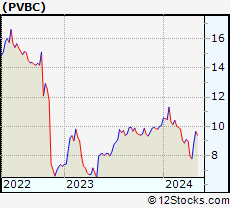 | PVBC Provident Bancorp, Inc. |
| Sector: Financials | |
| SubSector: Money Center Banks | |
| MarketCap: 168.599 Millions | |
| Recent Price: 9.34 Smart Investing & Trading Score: 49 | |
| Day Percent Change: 8.10% Day Change: 0.70 | |
| Week Change: 19.9% Year-to-date Change: -7.3% | |
| PVBC Links: Profile News Message Board | |
| Charts:- Daily , Weekly | |
| Add PVBC to Watchlist: View: Get Complete PVBC Trend Analysis ➞ | |
 | BCS Barclays PLC |
| Sector: Financials | |
| SubSector: Foreign Money Center Banks | |
| MarketCap: 21013.4 Millions | |
| Recent Price: 10.36 Smart Investing & Trading Score: 75 | |
| Day Percent Change: 7.92% Day Change: 0.76 | |
| Week Change: 10.8% Year-to-date Change: 31.5% | |
| BCS Links: Profile News Message Board | |
| Charts:- Daily , Weekly | |
| Add BCS to Watchlist: View: Get Complete BCS Trend Analysis ➞ | |
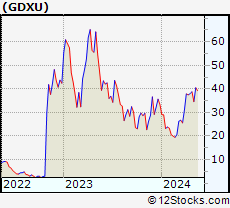 | GDXU MicroSectors Gold Miners 3X Leveraged ETNs |
| Sector: Financials | |
| SubSector: Exchange Traded Fund | |
| MarketCap: 60157 Millions | |
| Recent Price: 36.49 Smart Investing & Trading Score: 43 | |
| Day Percent Change: 5.71% Day Change: 1.97 | |
| Week Change: -4.05% Year-to-date Change: 9.3% | |
| GDXU Links: Profile News Message Board | |
| Charts:- Daily , Weekly | |
| Add GDXU to Watchlist: View: Get Complete GDXU Trend Analysis ➞ | |
 | DUO Fangdd Network Group Ltd. |
| Sector: Financials | |
| SubSector: Property Management | |
| MarketCap: 783.142 Millions | |
| Recent Price: 0.41 Smart Investing & Trading Score: 17 | |
| Day Percent Change: 5.41% Day Change: 0.02 | |
| Week Change: 4.87% Year-to-date Change: -39.2% | |
| DUO Links: Profile News Message Board | |
| Charts:- Daily , Weekly | |
| Add DUO to Watchlist: View: Get Complete DUO Trend Analysis ➞ | |
 | ATLC Atlanticus Holdings Corporation |
| Sector: Financials | |
| SubSector: Credit Services | |
| MarketCap: 122.008 Millions | |
| Recent Price: 26.10 Smart Investing & Trading Score: 42 | |
| Day Percent Change: 4.90% Day Change: 1.22 | |
| Week Change: 7.23% Year-to-date Change: -32.5% | |
| ATLC Links: Profile News Message Board | |
| Charts:- Daily , Weekly | |
| Add ATLC to Watchlist: View: Get Complete ATLC Trend Analysis ➞ | |
 | CPF Central Pacific Financial Corp. |
| Sector: Financials | |
| SubSector: Regional - Pacific Banks | |
| MarketCap: 407.429 Millions | |
| Recent Price: 20.76 Smart Investing & Trading Score: 100 | |
| Day Percent Change: 4.06% Day Change: 0.81 | |
| Week Change: 7.62% Year-to-date Change: 5.5% | |
| CPF Links: Profile News Message Board | |
| Charts:- Daily , Weekly | |
| Add CPF to Watchlist: View: Get Complete CPF Trend Analysis ➞ | |
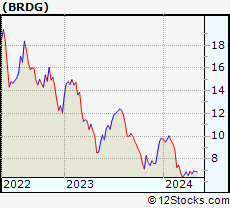 | BRDG Bridge Investment Group Holdings Inc. |
| Sector: Financials | |
| SubSector: Asset Management | |
| MarketCap: 1320 Millions | |
| Recent Price: 6.85 Smart Investing & Trading Score: 42 | |
| Day Percent Change: 3.63% Day Change: 0.24 | |
| Week Change: 2.7% Year-to-date Change: -30.3% | |
| BRDG Links: Profile News Message Board | |
| Charts:- Daily , Weekly | |
| Add BRDG to Watchlist: View: Get Complete BRDG Trend Analysis ➞ | |
 | CASH Meta Financial Group, Inc. |
| Sector: Financials | |
| SubSector: Savings & Loans | |
| MarketCap: 849.33 Millions | |
| Recent Price: 52.92 Smart Investing & Trading Score: 62 | |
| Day Percent Change: 3.58% Day Change: 1.83 | |
| Week Change: 5.02% Year-to-date Change: 0.0% | |
| CASH Links: Profile News Message Board | |
| Charts:- Daily , Weekly | |
| Add CASH to Watchlist: View: Get Complete CASH Trend Analysis ➞ | |
 | HAFC Hanmi Financial Corporation |
| Sector: Financials | |
| SubSector: Regional - Pacific Banks | |
| MarketCap: 319.929 Millions | |
| Recent Price: 15.63 Smart Investing & Trading Score: 34 | |
| Day Percent Change: 3.24% Day Change: 0.49 | |
| Week Change: 2.76% Year-to-date Change: -19.4% | |
| HAFC Links: Profile News Message Board | |
| Charts:- Daily , Weekly | |
| Add HAFC to Watchlist: View: Get Complete HAFC Trend Analysis ➞ | |
 | TOP TOP Financial Group Limited |
| Sector: Financials | |
| SubSector: Capital Markets | |
| MarketCap: 329 Millions | |
| Recent Price: 2.68 Smart Investing & Trading Score: 52 | |
| Day Percent Change: 3.08% Day Change: 0.08 | |
| Week Change: 14.04% Year-to-date Change: -28.0% | |
| TOP Links: Profile News Message Board | |
| Charts:- Daily , Weekly | |
| Add TOP to Watchlist: View: Get Complete TOP Trend Analysis ➞ | |
 | PMT PennyMac Mortgage Investment Trust |
| Sector: Financials | |
| SubSector: Mortgage Investment | |
| MarketCap: 917.639 Millions | |
| Recent Price: 14.14 Smart Investing & Trading Score: 39 | |
| Day Percent Change: 3.06% Day Change: 0.42 | |
| Week Change: 4.28% Year-to-date Change: -5.4% | |
| PMT Links: Profile News Message Board | |
| Charts:- Daily , Weekly | |
| Add PMT to Watchlist: View: Get Complete PMT Trend Analysis ➞ | |
 | LADR Ladder Capital Corp |
| Sector: Financials | |
| SubSector: Mortgage Investment | |
| MarketCap: 660.039 Millions | |
| Recent Price: 10.80 Smart Investing & Trading Score: 42 | |
| Day Percent Change: 2.86% Day Change: 0.30 | |
| Week Change: 3.05% Year-to-date Change: -6.2% | |
| LADR Links: Profile News Message Board | |
| Charts:- Daily , Weekly | |
| Add LADR to Watchlist: View: Get Complete LADR Trend Analysis ➞ | |
 | UVSP Univest Financial Corporation |
| Sector: Financials | |
| SubSector: Regional - Northeast Banks | |
| MarketCap: 467.999 Millions | |
| Recent Price: 20.55 Smart Investing & Trading Score: 74 | |
| Day Percent Change: 2.75% Day Change: 0.55 | |
| Week Change: 5.71% Year-to-date Change: -6.7% | |
| UVSP Links: Profile News Message Board | |
| Charts:- Daily , Weekly | |
| Add UVSP to Watchlist: View: Get Complete UVSP Trend Analysis ➞ | |
 | MPB Mid Penn Bancorp, Inc. |
| Sector: Financials | |
| SubSector: Regional - Northeast Banks | |
| MarketCap: 187.699 Millions | |
| Recent Price: 20.98 Smart Investing & Trading Score: 74 | |
| Day Percent Change: 2.74% Day Change: 0.56 | |
| Week Change: 2.34% Year-to-date Change: -13.6% | |
| MPB Links: Profile News Message Board | |
| Charts:- Daily , Weekly | |
| Add MPB to Watchlist: View: Get Complete MPB Trend Analysis ➞ | |
 | VIRT Virtu Financial, Inc. |
| Sector: Financials | |
| SubSector: Investment Brokerage - National | |
| MarketCap: 4305.15 Millions | |
| Recent Price: 22.40 Smart Investing & Trading Score: 100 | |
| Day Percent Change: 2.56% Day Change: 0.56 | |
| Week Change: 6.36% Year-to-date Change: 10.6% | |
| VIRT Links: Profile News Message Board | |
| Charts:- Daily , Weekly | |
| Add VIRT to Watchlist: View: Get Complete VIRT Trend Analysis ➞ | |
 | PKST Peakstone Realty Trust |
| Sector: Financials | |
| SubSector: REIT - Diversified | |
| MarketCap: 1050 Millions | |
| Recent Price: 14.35 Smart Investing & Trading Score: 59 | |
| Day Percent Change: 2.50% Day Change: 0.35 | |
| Week Change: 11.41% Year-to-date Change: -30.1% | |
| PKST Links: Profile News Message Board | |
| Charts:- Daily , Weekly | |
| Add PKST to Watchlist: View: Get Complete PKST Trend Analysis ➞ | |
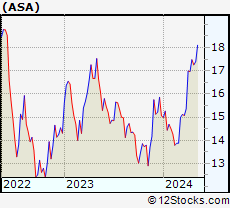 | ASA ASA Gold and Precious Metals Limited |
| Sector: Financials | |
| SubSector: Asset Management | |
| MarketCap: 175.503 Millions | |
| Recent Price: 17.34 Smart Investing & Trading Score: 43 | |
| Day Percent Change: 2.24% Day Change: 0.38 | |
| Week Change: -0.8% Year-to-date Change: 15.1% | |
| ASA Links: Profile News Message Board | |
| Charts:- Daily , Weekly | |
| Add ASA to Watchlist: View: Get Complete ASA Trend Analysis ➞ | |
 | HCI HCI Group, Inc. |
| Sector: Financials | |
| SubSector: Property & Casualty Insurance | |
| MarketCap: 297.412 Millions | |
| Recent Price: 116.08 Smart Investing & Trading Score: 71 | |
| Day Percent Change: 2.16% Day Change: 2.45 | |
| Week Change: 3.74% Year-to-date Change: 32.8% | |
| HCI Links: Profile News Message Board | |
| Charts:- Daily , Weekly | |
| Add HCI to Watchlist: View: Get Complete HCI Trend Analysis ➞ | |
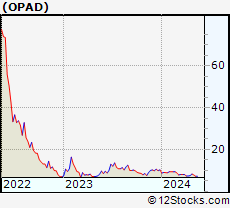 | OPAD Offerpad Solutions Inc. |
| Sector: Financials | |
| SubSector: Financials Services | |
| MarketCap: 345 Millions | |
| Recent Price: 8.12 Smart Investing & Trading Score: 74 | |
| Day Percent Change: 2.14% Day Change: 0.17 | |
| Week Change: 8.41% Year-to-date Change: -20.8% | |
| OPAD Links: Profile News Message Board | |
| Charts:- Daily , Weekly | |
| Add OPAD to Watchlist: View: Get Complete OPAD Trend Analysis ➞ | |
 | NRIM Northrim BanCorp, Inc. |
| Sector: Financials | |
| SubSector: Regional - Pacific Banks | |
| MarketCap: 147.629 Millions | |
| Recent Price: 47.97 Smart Investing & Trading Score: 34 | |
| Day Percent Change: 2.13% Day Change: 1.00 | |
| Week Change: 3.41% Year-to-date Change: -16.2% | |
| NRIM Links: Profile News Message Board | |
| Charts:- Daily , Weekly | |
| Add NRIM to Watchlist: View: Get Complete NRIM Trend Analysis ➞ | |
 | CFFI C&F Financial Corporation |
| Sector: Financials | |
| SubSector: Regional - Mid-Atlantic Banks | |
| MarketCap: 145.559 Millions | |
| Recent Price: 37.74 Smart Investing & Trading Score: 35 | |
| Day Percent Change: 2.01% Day Change: 0.74 | |
| Week Change: 2.1% Year-to-date Change: -44.7% | |
| CFFI Links: Profile News Message Board | |
| Charts:- Daily , Weekly | |
| Add CFFI to Watchlist: View: Get Complete CFFI Trend Analysis ➞ | |
 | NU Nu Holdings Ltd. |
| Sector: Financials | |
| SubSector: Banks - Diversified | |
| MarketCap: 37240 Millions | |
| Recent Price: 10.87 Smart Investing & Trading Score: 56 | |
| Day Percent Change: 1.87% Day Change: 0.20 | |
| Week Change: 3.72% Year-to-date Change: 30.3% | |
| NU Links: Profile News Message Board | |
| Charts:- Daily , Weekly | |
| Add NU to Watchlist: View: Get Complete NU Trend Analysis ➞ | |
| For tabular summary view of above stock list: Summary View ➞ 0 - 25 , 25 - 50 , 50 - 75 , 75 - 100 , 100 - 125 , 125 - 150 , 150 - 175 , 175 - 200 , 200 - 225 , 225 - 250 , 250 - 275 , 275 - 300 , 300 - 325 , 325 - 350 , 350 - 375 , 375 - 400 , 400 - 425 , 425 - 450 , 450 - 475 , 475 - 500 , 500 - 525 , 525 - 550 , 550 - 575 , 575 - 600 , 600 - 625 , 625 - 650 , 650 - 675 , 675 - 700 , 700 - 725 , 725 - 750 , 750 - 775 , 775 - 800 , 800 - 825 , 825 - 850 , 850 - 875 , 875 - 900 , 900 - 925 , 925 - 950 , 950 - 975 , 975 - 1000 , 1000 - 1025 , 1025 - 1050 , 1050 - 1075 , 1075 - 1100 , 1100 - 1125 , 1125 - 1150 , 1150 - 1175 , 1175 - 1200 , 1200 - 1225 , 1225 - 1250 | ||
| Click To Change The Sort Order: By Market Cap or Company Size Performance: Year-to-date, Week and Day | |
| Select Chart Type: | ||
|
Best Stocks Today 12Stocks.com |
© 2024 12Stocks.com Terms & Conditions Privacy Contact Us
All Information Provided Only For Education And Not To Be Used For Investing or Trading. See Terms & Conditions


One More Thing ... Get Best Stocks Delivered Daily!
Never Ever Miss A Move With Our Top Ten Stocks Lists
Find Best Stocks In Any Market - Bull or Bear Market
Take A Peek At Our Top Ten Stocks Lists: Daily, Weekly, Year-to-Date & Top Trends
Find Best Stocks In Any Market - Bull or Bear Market
Take A Peek At Our Top Ten Stocks Lists: Daily, Weekly, Year-to-Date & Top Trends
Financial Stocks With Best Up Trends [0-bearish to 100-bullish]: B. Riley[100], Deutsche Bank[100], Central Pacific[100], Virtu [100], Trustmark [100], Equity Residential[100], Third Coast[100], UDR [100], AvalonBay Communities[100], Capital Southwest[100], LTC Properties[100]
Best Financial Stocks Year-to-Date:
Root [465%], Hippo [128.87%], Gladstone Capital[98.88%], Banco Macro[71.01%], Grupo Financiero[70.81%], B. Riley[65.27%], Banco BBVA[64.71%], Yiren Digital[61.54%], Heritage Insurance[59.97%], Fidelis Insurance[56.23%], First [52.08%] Best Financial Stocks This Week:
B. Riley[73.54%], Oportun [34.91%], Provident Bancorp[19.9%], Cipher Mining[15.36%], First Citizens[14.87%], Root [14.33%], TOP [14.04%], Globe Life[13.19%], Deutsche Bank[12.63%], Trustmark [11.56%], Peakstone Realty[11.41%] Best Financial Stocks Daily:
B. Riley[16.61%], First Citizens[9.80%], Deutsche Bank[8.74%], Provident Bancorp[8.10%], Barclays [7.92%], MicroSectors Gold[5.71%], Fangdd Network[5.41%], Atlanticus [4.90%], Central Pacific[4.06%], Bridge [3.63%], Meta [3.58%]