
 Login Sign Up


| |||||
 |  | ||||

| 12Stocks.com Market Intelligence |
Best Financial Stocks
| In a hurry? Financial Stocks Lists: Performance Trends Table, Stock Charts
Sort Financial stocks: Daily, Weekly, Year-to-Date, Market Cap & Trends. Filter Financial stocks list by size:All Financial Large Mid-Range Small & MicroCap |
| 12Stocks.com Financial Stocks Performances & Trends Daily | |||||||||
|
|  The overall Smart Investing & Trading Score is 58 (0-bearish to 100-bullish) which puts Financial sector in short term neutral trend. The Smart Investing & Trading Score from previous trading session is 56 and hence an improvement of trend.
| ||||||||
Here are the Smart Investing & Trading Scores of the most requested Financial stocks at 12Stocks.com (click stock name for detailed review):
|


| 12Stocks.com: Investing in Financial sector with Stocks | |
|
The following table helps investors and traders sort through current performance and trends (as measured by Smart Investing & Trading Score) of various
stocks in the Financial sector. Quick View: Move mouse or cursor over stock symbol (ticker) to view short-term Technical chart and over stock name to view long term chart. Click on  to add stock symbol to your watchlist and to add stock symbol to your watchlist and  to view watchlist. Click on any ticker or stock name for detailed market intelligence report for that stock. to view watchlist. Click on any ticker or stock name for detailed market intelligence report for that stock. |
12Stocks.com Performance of Stocks in Financial Sector
| Ticker | Stock Name | Watchlist | Category | Recent Price | Smart Investing & Trading Score | Change % | YTD Change% |
| CBNK | Capital Bancorp |   | S&L | 19.60 | 42 | 1.84 | -19.01% |
| BY | Byline Bancorp | | Regional Banks | 20.45 | 52 | 1.84 | -13.20% |
| O | Realty ome | | REIT - Retail | 52.98 | 52 | 1.83 | -7.73% |
| FBNC | First Bancorp | | Regional Banks | 31.83 | 32 | 1.82 | -14.00% |
| CPF | Central Pacific | | Regional Banks | 19.04 | 42 | 1.82 | -3.25% |
| MBI | MBIA | | Insurance | 6.16 | 20 | 1.82 | 0.65% |
| FBP | First Ban | | Foreign Banks | 16.74 | 45 | 1.82 | 1.76% |
| MTB | M&T Bank | | Regional Banks | 141.83 | 85 | 1.82 | 3.47% |
| EBC | Eastern Bankshares | | Banks Regional | 12.65 | 42 | 1.81 | -10.95% |
| PDLB | PDL Community | | REIT - Retail | 8.14 | 32 | 1.81 | -16.55% |
| WSBC | WesBanco | | Regional Banks | 28.06 | 42 | 1.81 | -10.55% |
| PGRE | Paramount | | Property Mgmt | 4.53 | 28 | 1.80 | -12.38% |
| GCBC | Greene County | | S&L | 27.89 | 78 | 1.79 | -1.10% |
| SLG | SL Green | | REIT - Retail | 49.39 | 56 | 1.79 | 9.34% |
| EFSC | Enterprise | | Regional - Southwest Banks | 38.86 | 52 | 1.78 | -12.97% |
| CHCT | Community Healthcare | | REIT | 25.63 | 55 | 1.77 | -3.81% |
| LOB | Live Oak | | S&L | 37.36 | 58 | 1.77 | -17.89% |
| TFSL | TFS | | Regional Banks | 12.05 | 42 | 1.77 | -17.97% |
| MC | Moelis & | | Asset Mgmt | 51.87 | 32 | 1.76 | -7.60% |
| ESGR | Enstar | | Insurance | 282.19 | 51 | 1.76 | -4.13% |
| BSBR | Banco Santander | | Foreign Banks | 5.21 | 32 | 1.76 | -20.46% |
| C | Citi | | Banks | 59.34 | 68 | 1.76 | 15.37% |
| AIG | American | | Insurance | 74.27 | 51 | 1.75 | 9.62% |
| BLFY | Blue Foundry | | Banks - Regional | 8.15 | 42 | 1.75 | -15.37% |
| GUT | Gabelli Utility | | Closed-End Fund - Equity | 5.51 | 81 | 1.75 | 1.75% |
| For chart view version of above stock list: Chart View ➞ 0 - 25 , 25 - 50 , 50 - 75 , 75 - 100 , 100 - 125 , 125 - 150 , 150 - 175 , 175 - 200 , 200 - 225 , 225 - 250 , 250 - 275 , 275 - 300 , 300 - 325 , 325 - 350 , 350 - 375 , 375 - 400 , 400 - 425 , 425 - 450 , 450 - 475 , 475 - 500 , 500 - 525 , 525 - 550 , 550 - 575 , 575 - 600 , 600 - 625 , 625 - 650 , 650 - 675 , 675 - 700 , 700 - 725 , 725 - 750 , 750 - 775 , 775 - 800 , 800 - 825 , 825 - 850 , 850 - 875 , 875 - 900 , 900 - 925 , 925 - 950 , 950 - 975 , 975 - 1000 , 1000 - 1025 , 1025 - 1050 , 1050 - 1075 , 1075 - 1100 , 1100 - 1125 , 1125 - 1150 , 1150 - 1175 , 1175 - 1200 | ||
 | Click To Change The Sort Order: By Market Cap or Company Size Performance: Year-to-date, Week and Day |  |
|
Get the most comprehensive stock market coverage daily at 12Stocks.com ➞ Best Stocks Today ➞ Best Stocks Weekly ➞ Best Stocks Year-to-Date ➞ Best Stocks Trends ➞  Best Stocks Today 12Stocks.com Best Nasdaq Stocks ➞ Best S&P 500 Stocks ➞ Best Tech Stocks ➞ Best Biotech Stocks ➞ |
| Detailed Overview of Financial Stocks |
| Financial Technical Overview, Leaders & Laggards, Top Financial ETF Funds & Detailed Financial Stocks List, Charts, Trends & More |
| Financial Sector: Technical Analysis, Trends & YTD Performance | |
| Financial sector is composed of stocks
from banks, brokers, insurance, REITs
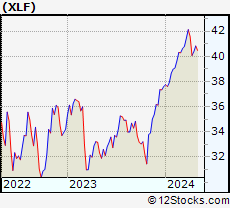
and services subsectors. Financial sector, as represented by XLF, an exchange-traded fund [ETF] that holds basket of Financial stocks (e.g, Bank of America, Goldman Sachs) is up by 7.13% and is currently outperforming the overall market by 3.05% year-to-date. Below is a quick view of Technical charts and trends: |
|
 XLF Weekly Chart |
|
| Long Term Trend: Very Good | |
| Medium Term Trend: Not Good | |
 XLF Daily Chart |
|
| Short Term Trend: Very Good | |
| Overall Trend Score: 58 | |
| YTD Performance: 7.13% | |
| **Trend Scores & Views Are Only For Educational Purposes And Not For Investing | |
| 12Stocks.com: Top Performing Financial Sector Stocks | ||||||||||||||||||||||||||||||||||||||||||||||||
 The top performing Financial sector stocks year to date are
Now, more recently, over last week, the top performing Financial sector stocks on the move are


|
||||||||||||||||||||||||||||||||||||||||||||||||
| 12Stocks.com: Investing in Financial Sector using Exchange Traded Funds | |
|
The following table shows list of key exchange traded funds (ETF) that
help investors track Financial Index. For detailed view, check out our ETF Funds section of our website. Quick View: Move mouse or cursor over ETF symbol (ticker) to view short-term Technical chart and over ETF name to view long term chart. Click on ticker or stock name for detailed view. Click on to add stock symbol to your watchlist and to view watchlist. |
12Stocks.com List of ETFs that track Financial Index
| Ticker | ETF Name | Watchlist | Recent Price | Smart Investing & Trading Score | Change % | Week % | Year-to-date % |
| XLF | Financial | | 40.28 | 58 | 1.13 | 0.55 | 7.13% |
| IAI | Broker-Dealers & Secs | | 111.01 | 63 | 0.45 | 0.16 | 2.29% |
| KBE | Bank | | 44.12 | 37 | 1.66 | 0.75 | -4.13% |
| FAS | Financial Bull 3X | | 96.66 | 63 | 2.68 | 0.46 | 16.95% |
| FAZ | Financial Bear 3X | | 11.30 | 32 | -3.09 | -0.96 | -17.34% |
| UYG | Financials | | 61.80 | 63 | 1.73 | 0.54 | 11.96% |
| KIE | Insurance | | 48.90 | 58 | 1.27 | 1.19 | 8.13% |
| 12Stocks.com: Charts, Trends, Fundamental Data and Performances of Financial Stocks | |
|
We now take in-depth look at all Financial stocks including charts, multi-period performances and overall trends (as measured by Smart Investing & Trading Score). One can sort Financial stocks (click link to choose) by Daily, Weekly and by Year-to-Date performances. Also, one can sort by size of the company or by market capitalization. |
| Select Your Default Chart Type: | |||||
| |||||
| Click on stock symbol or name for detailed view. Click on to add stock symbol to your watchlist and to view watchlist. Quick View: Move mouse or cursor over "Daily" to quickly view daily Technical stock chart and over "Weekly" to view weekly Technical stock chart. | |||||

 | CBNK Capital Bancorp, Inc. |
| Sector: Financials | |
| SubSector: Savings & Loans | |
| MarketCap: 174.93 Millions | |
| Recent Price: 19.60 Smart Investing & Trading Score: 42 | |
| Day Percent Change: 1.84% Day Change: 0.36 | |
| Week Change: -0.1% Year-to-date Change: -19.0% | |
| CBNK Links: Profile News Message Board | |
| Charts:- Daily , Weekly | |
| Add CBNK to Watchlist: View: Get Complete CBNK Trend Analysis ➞ | |
 | BY Byline Bancorp, Inc. |
| Sector: Financials | |
| SubSector: Regional - Midwest Banks | |
| MarketCap: 381.87 Millions | |
| Recent Price: 20.45 Smart Investing & Trading Score: 52 | |
| Day Percent Change: 1.84% Day Change: 0.37 | |
| Week Change: 1.29% Year-to-date Change: -13.2% | |
| BY Links: Profile News Message Board | |
| Charts:- Daily , Weekly | |
| Add BY to Watchlist: View: Get Complete BY Trend Analysis ➞ | |
 | O Realty Income Corporation |
| Sector: Financials | |
| SubSector: REIT - Retail | |
| MarketCap: 17647.4 Millions | |
| Recent Price: 52.98 Smart Investing & Trading Score: 52 | |
| Day Percent Change: 1.83% Day Change: 0.95 | |
| Week Change: 1.85% Year-to-date Change: -7.7% | |
| O Links: Profile News Message Board | |
| Charts:- Daily , Weekly | |
| Add O to Watchlist: View: Get Complete O Trend Analysis ➞ | |
 | FBNC First Bancorp |
| Sector: Financials | |
| SubSector: Regional - Mid-Atlantic Banks | |
| MarketCap: 664.959 Millions | |
| Recent Price: 31.83 Smart Investing & Trading Score: 32 | |
| Day Percent Change: 1.82% Day Change: 0.57 | |
| Week Change: -2.6% Year-to-date Change: -14.0% | |
| FBNC Links: Profile News Message Board | |
| Charts:- Daily , Weekly | |
| Add FBNC to Watchlist: View: Get Complete FBNC Trend Analysis ➞ | |
 | CPF Central Pacific Financial Corp. |
| Sector: Financials | |
| SubSector: Regional - Pacific Banks | |
| MarketCap: 407.429 Millions | |
| Recent Price: 19.04 Smart Investing & Trading Score: 42 | |
| Day Percent Change: 1.82% Day Change: 0.34 | |
| Week Change: 0% Year-to-date Change: -3.3% | |
| CPF Links: Profile News Message Board | |
| Charts:- Daily , Weekly | |
| Add CPF to Watchlist: View: Get Complete CPF Trend Analysis ➞ | |
 | MBI MBIA Inc. |
| Sector: Financials | |
| SubSector: Property & Casualty Insurance | |
| MarketCap: 539.012 Millions | |
| Recent Price: 6.16 Smart Investing & Trading Score: 20 | |
| Day Percent Change: 1.82% Day Change: 0.11 | |
| Week Change: -1.28% Year-to-date Change: 0.7% | |
| MBI Links: Profile News Message Board | |
| Charts:- Daily , Weekly | |
| Add MBI to Watchlist: View: Get Complete MBI Trend Analysis ➞ | |
 | FBP First BanCorp. |
| Sector: Financials | |
| SubSector: Foreign Regional Banks | |
| MarketCap: 913.079 Millions | |
| Recent Price: 16.74 Smart Investing & Trading Score: 45 | |
| Day Percent Change: 1.82% Day Change: 0.30 | |
| Week Change: 0.54% Year-to-date Change: 1.8% | |
| FBP Links: Profile News Message Board | |
| Charts:- Daily , Weekly | |
| Add FBP to Watchlist: View: Get Complete FBP Trend Analysis ➞ | |
 | MTB M&T Bank Corporation |
| Sector: Financials | |
| SubSector: Regional - Northeast Banks | |
| MarketCap: 13950.9 Millions | |
| Recent Price: 141.83 Smart Investing & Trading Score: 85 | |
| Day Percent Change: 1.82% Day Change: 2.53 | |
| Week Change: 5.4% Year-to-date Change: 3.5% | |
| MTB Links: Profile News Message Board | |
| Charts:- Daily , Weekly | |
| Add MTB to Watchlist: View: Get Complete MTB Trend Analysis ➞ | |
 | EBC Eastern Bankshares, Inc. |
| Sector: Financials | |
| SubSector: Banks Regional | |
| MarketCap: 30057 Millions | |
| Recent Price: 12.65 Smart Investing & Trading Score: 42 | |
| Day Percent Change: 1.81% Day Change: 0.22 | |
| Week Change: 0.28% Year-to-date Change: -11.0% | |
| EBC Links: Profile News Message Board | |
| Charts:- Daily , Weekly | |
| Add EBC to Watchlist: View: Get Complete EBC Trend Analysis ➞ | |
 | PDLB PDL Community Bancorp |
| Sector: Financials | |
| SubSector: REIT - Retail | |
| MarketCap: 206.114 Millions | |
| Recent Price: 8.14 Smart Investing & Trading Score: 32 | |
| Day Percent Change: 1.81% Day Change: 0.14 | |
| Week Change: 0.56% Year-to-date Change: -16.6% | |
| PDLB Links: Profile News Message Board | |
| Charts:- Daily , Weekly | |
| Add PDLB to Watchlist: View: Get Complete PDLB Trend Analysis ➞ | |
 | WSBC WesBanco, Inc. |
| Sector: Financials | |
| SubSector: Regional - Mid-Atlantic Banks | |
| MarketCap: 1575.79 Millions | |
| Recent Price: 28.06 Smart Investing & Trading Score: 42 | |
| Day Percent Change: 1.81% Day Change: 0.50 | |
| Week Change: 2.04% Year-to-date Change: -10.6% | |
| WSBC Links: Profile News Message Board | |
| Charts:- Daily , Weekly | |
| Add WSBC to Watchlist: View: Get Complete WSBC Trend Analysis ➞ | |
 | PGRE Paramount Group, Inc. |
| Sector: Financials | |
| SubSector: Property Management | |
| MarketCap: 1722.72 Millions | |
| Recent Price: 4.53 Smart Investing & Trading Score: 28 | |
| Day Percent Change: 1.80% Day Change: 0.08 | |
| Week Change: -3.41% Year-to-date Change: -12.4% | |
| PGRE Links: Profile News Message Board | |
| Charts:- Daily , Weekly | |
| Add PGRE to Watchlist: View: Get Complete PGRE Trend Analysis ➞ | |
 | GCBC Greene County Bancorp, Inc. |
| Sector: Financials | |
| SubSector: Savings & Loans | |
| MarketCap: 314.83 Millions | |
| Recent Price: 27.89 Smart Investing & Trading Score: 78 | |
| Day Percent Change: 1.79% Day Change: 0.49 | |
| Week Change: 4.97% Year-to-date Change: -1.1% | |
| GCBC Links: Profile News Message Board | |
| Charts:- Daily , Weekly | |
| Add GCBC to Watchlist: View: Get Complete GCBC Trend Analysis ➞ | |
 | SLG SL Green Realty Corp. |
| Sector: Financials | |
| SubSector: REIT - Retail | |
| MarketCap: 4048.14 Millions | |
| Recent Price: 49.39 Smart Investing & Trading Score: 56 | |
| Day Percent Change: 1.79% Day Change: 0.87 | |
| Week Change: -3.52% Year-to-date Change: 9.3% | |
| SLG Links: Profile News Message Board | |
| Charts:- Daily , Weekly | |
| Add SLG to Watchlist: View: Get Complete SLG Trend Analysis ➞ | |
 | EFSC Enterprise Financial Services Corp |
| Sector: Financials | |
| SubSector: Regional - Southwest Banks | |
| MarketCap: 770.165 Millions | |
| Recent Price: 38.86 Smart Investing & Trading Score: 52 | |
| Day Percent Change: 1.78% Day Change: 0.68 | |
| Week Change: 1.46% Year-to-date Change: -13.0% | |
| EFSC Links: Profile News Message Board | |
| Charts:- Daily , Weekly | |
| Add EFSC to Watchlist: View: Get Complete EFSC Trend Analysis ➞ | |
 | CHCT Community Healthcare Trust Incorporated |
| Sector: Financials | |
| SubSector: REIT - Healthcare Facilities | |
| MarketCap: 698.614 Millions | |
| Recent Price: 25.63 Smart Investing & Trading Score: 55 | |
| Day Percent Change: 1.77% Day Change: 0.45 | |
| Week Change: 1.89% Year-to-date Change: -3.8% | |
| CHCT Links: Profile News Message Board | |
| Charts:- Daily , Weekly | |
| Add CHCT to Watchlist: View: Get Complete CHCT Trend Analysis ➞ | |
 | LOB Live Oak Bancshares, Inc. |
| Sector: Financials | |
| SubSector: Savings & Loans | |
| MarketCap: 394.23 Millions | |
| Recent Price: 37.36 Smart Investing & Trading Score: 58 | |
| Day Percent Change: 1.77% Day Change: 0.65 | |
| Week Change: -1.5% Year-to-date Change: -17.9% | |
| LOB Links: Profile News Message Board | |
| Charts:- Daily , Weekly | |
| Add LOB to Watchlist: View: Get Complete LOB Trend Analysis ➞ | |
 | TFSL TFS Financial Corporation |
| Sector: Financials | |
| SubSector: Regional - Midwest Banks | |
| MarketCap: 4539.1 Millions | |
| Recent Price: 12.05 Smart Investing & Trading Score: 42 | |
| Day Percent Change: 1.77% Day Change: 0.21 | |
| Week Change: 0.5% Year-to-date Change: -18.0% | |
| TFSL Links: Profile News Message Board | |
| Charts:- Daily , Weekly | |
| Add TFSL to Watchlist: View: Get Complete TFSL Trend Analysis ➞ | |
 | MC Moelis & Company |
| Sector: Financials | |
| SubSector: Asset Management | |
| MarketCap: 1675.93 Millions | |
| Recent Price: 51.87 Smart Investing & Trading Score: 32 | |
| Day Percent Change: 1.76% Day Change: 0.90 | |
| Week Change: -0.36% Year-to-date Change: -7.6% | |
| MC Links: Profile News Message Board | |
| Charts:- Daily , Weekly | |
| Add MC to Watchlist: View: Get Complete MC Trend Analysis ➞ | |
 | ESGR Enstar Group Limited |
| Sector: Financials | |
| SubSector: Property & Casualty Insurance | |
| MarketCap: 2886.02 Millions | |
| Recent Price: 282.19 Smart Investing & Trading Score: 51 | |
| Day Percent Change: 1.76% Day Change: 4.88 | |
| Week Change: -0.93% Year-to-date Change: -4.1% | |
| ESGR Links: Profile News Message Board | |
| Charts:- Daily , Weekly | |
| Add ESGR to Watchlist: View: Get Complete ESGR Trend Analysis ➞ | |
 | BSBR Banco Santander (Brasil) S.A. |
| Sector: Financials | |
| SubSector: Foreign Regional Banks | |
| MarketCap: 21961.4 Millions | |
| Recent Price: 5.21 Smart Investing & Trading Score: 32 | |
| Day Percent Change: 1.76% Day Change: 0.09 | |
| Week Change: -2.25% Year-to-date Change: -20.5% | |
| BSBR Links: Profile News Message Board | |
| Charts:- Daily , Weekly | |
| Add BSBR to Watchlist: View: Get Complete BSBR Trend Analysis ➞ | |
 | C Citigroup Inc. |
| Sector: Financials | |
| SubSector: Money Center Banks | |
| MarketCap: 94128 Millions | |
| Recent Price: 59.34 Smart Investing & Trading Score: 68 | |
| Day Percent Change: 1.76% Day Change: 1.02 | |
| Week Change: -0.56% Year-to-date Change: 15.4% | |
| C Links: Profile News Message Board | |
| Charts:- Daily , Weekly | |
| Add C to Watchlist: View: Get Complete C Trend Analysis ➞ | |
 | AIG American International Group, Inc. |
| Sector: Financials | |
| SubSector: Property & Casualty Insurance | |
| MarketCap: 21219 Millions | |
| Recent Price: 74.27 Smart Investing & Trading Score: 51 | |
| Day Percent Change: 1.75% Day Change: 1.28 | |
| Week Change: 0.8% Year-to-date Change: 9.6% | |
| AIG Links: Profile News Message Board | |
| Charts:- Daily , Weekly | |
| Add AIG to Watchlist: View: Get Complete AIG Trend Analysis ➞ | |
 | BLFY Blue Foundry Bancorp |
| Sector: Financials | |
| SubSector: Banks - Regional | |
| MarketCap: 264 Millions | |
| Recent Price: 8.15 Smart Investing & Trading Score: 42 | |
| Day Percent Change: 1.75% Day Change: 0.14 | |
| Week Change: -4% Year-to-date Change: -15.4% | |
| BLFY Links: Profile News Message Board | |
| Charts:- Daily , Weekly | |
| Add BLFY to Watchlist: View: Get Complete BLFY Trend Analysis ➞ | |
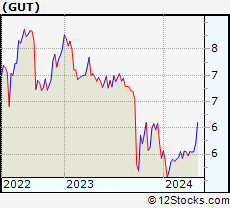 | GUT The Gabelli Utility Trust |
| Sector: Financials | |
| SubSector: Closed-End Fund - Equity | |
| MarketCap: 267.447 Millions | |
| Recent Price: 5.51 Smart Investing & Trading Score: 81 | |
| Day Percent Change: 1.75% Day Change: 0.09 | |
| Week Change: -0.63% Year-to-date Change: 1.8% | |
| GUT Links: Profile News Message Board | |
| Charts:- Daily , Weekly | |
| Add GUT to Watchlist: View: Get Complete GUT Trend Analysis ➞ | |
| For tabular summary view of above stock list: Summary View ➞ 0 - 25 , 25 - 50 , 50 - 75 , 75 - 100 , 100 - 125 , 125 - 150 , 150 - 175 , 175 - 200 , 200 - 225 , 225 - 250 , 250 - 275 , 275 - 300 , 300 - 325 , 325 - 350 , 350 - 375 , 375 - 400 , 400 - 425 , 425 - 450 , 450 - 475 , 475 - 500 , 500 - 525 , 525 - 550 , 550 - 575 , 575 - 600 , 600 - 625 , 625 - 650 , 650 - 675 , 675 - 700 , 700 - 725 , 725 - 750 , 750 - 775 , 775 - 800 , 800 - 825 , 825 - 850 , 850 - 875 , 875 - 900 , 900 - 925 , 925 - 950 , 950 - 975 , 975 - 1000 , 1000 - 1025 , 1025 - 1050 , 1050 - 1075 , 1075 - 1100 , 1100 - 1125 , 1125 - 1150 , 1150 - 1175 , 1175 - 1200 | ||
| Click To Change The Sort Order: By Market Cap or Company Size Performance: Year-to-date, Week and Day | |
| Select Chart Type: | ||
|
Best Stocks Today 12Stocks.com |
© 2024 12Stocks.com Terms & Conditions Privacy Contact Us
All Information Provided Only For Education And Not To Be Used For Investing or Trading. See Terms & Conditions


One More Thing ... Get Best Stocks Delivered Daily!
Never Ever Miss A Move With Our Top Ten Stocks Lists
Find Best Stocks In Any Market - Bull or Bear Market
Take A Peek At Our Top Ten Stocks Lists: Daily, Weekly, Year-to-Date & Top Trends
Find Best Stocks In Any Market - Bull or Bear Market
Take A Peek At Our Top Ten Stocks Lists: Daily, Weekly, Year-to-Date & Top Trends
Financial Stocks With Best Up Trends [0-bearish to 100-bullish]: Victory Capital[100], Wells Fargo[100], Mercury General[100], United Fire[100], Old Second[100], ASA Gold[100], Tejon Ranch[100], Charles Schwab[100], WhiteHorse Finance[100], Fidus [100], Goldman Sachs[100]
Best Financial Stocks Year-to-Date:
Root [394.17%], Hippo [123.38%], Gladstone Capital[95.14%], Banco Macro[71.53%], Grupo Financiero[63.89%], Yiren Digital[55.13%], Banco BBVA[52.76%], First [51.45%], EverQuote [50.98%], Fidelis Insurance[50.53%], Heritage Insurance[46.01%] Best Financial Stocks This Week:
Macatawa Bank[44.89%], Medical Properties[17.04%], Metropolitan Bank[13.05%], James River[10.99%], Globe Life[10.86%], Victory Capital[10.85%], Chemung [9.29%], Green Dot[7.75%], Bar Harbor[7.62%], Wells Fargo[7.31%], Iris Energy[6.99%] Best Financial Stocks Daily:
Hywin [17.78%], Metropolitan Bank[17.73%], Fanhua [9.68%], Chemung [9.48%], Cohen & Steers[8.35%], Bar Harbor[7.71%], Offerpad [7.65%], Iris Energy[6.30%], Fifth Third[5.13%], Glacier Bancorp[4.94%], American Express[4.47%]