
 Login Sign Up


| |||||
 |  | ||||

| 12Stocks.com Market Intelligence |
Best Financial Stocks
| In a hurry? Financial Stocks Lists: Performance Trends Table, Stock Charts
Sort Financial stocks: Daily, Weekly, Year-to-Date, Market Cap & Trends. Filter Financial stocks list by size:All Financial Large Mid-Range Small & MicroCap |
| 12Stocks.com Financial Stocks Performances & Trends Daily | |||||||||
|
|  The overall Smart Investing & Trading Score is 30 (0-bearish to 100-bullish) which puts Financial sector in short term bearish to neutral trend. The Smart Investing & Trading Score from previous trading session is 50 and hence a deterioration of trend.
| ||||||||
Here are the Smart Investing & Trading Scores of the most requested Financial stocks at 12Stocks.com (click stock name for detailed review):
|


| 12Stocks.com: Investing in Financial sector with Stocks | |
|
The following table helps investors and traders sort through current performance and trends (as measured by Smart Investing & Trading Score) of various
stocks in the Financial sector. Quick View: Move mouse or cursor over stock symbol (ticker) to view short-term Technical chart and over stock name to view long term chart. Click on  to add stock symbol to your watchlist and to add stock symbol to your watchlist and  to view watchlist. Click on any ticker or stock name for detailed market intelligence report for that stock. to view watchlist. Click on any ticker or stock name for detailed market intelligence report for that stock. |
12Stocks.com Performance of Stocks in Financial Sector
| Ticker | Stock Name | Watchlist | Category | Recent Price | Smart Investing & Trading Score | Change % | YTD Change% |
| SLRC | SLR |   | Asset Mgmt | 15.92 | 10 | -0.93 | 2.21% |
| NUM | Nuveen Michigan | | Asset Mgmt | 60.69 | 10 | -0.93 | 0.00% |
| SAMG | Silvercrest Asset | | Asset Mgmt | 16.06 | 50 | -0.93 | -9.70% |
| TFC | Truist | | Banks - Regional | 44.78 | 20 | -0.93 | 7.21% |
| EOI | Eaton Vance | | Closed-End Fund - Equity | 21.34 | 30 | -0.93 | 7.82% |
| TRV | Travelers | | Insurance - Property & Casualty | 276.30 | 50 | -0.94 | 15.64% |
| PLD | Prologis | | REIT - Industrial | 114.27 | 60 | -0.94 | 11.63% |
| SKT | Tanger | | REIT - Retail | 33.80 | 30 | -0.94 | 2.13% |
| KREF | KKR Real | | REIT - Mortgage | 9.50 | 30 | -0.94 | -2.06% |
| FRME | First Merchants | | Banks - Regional | 39.65 | 10 | -0.95 | 3.30% |
| RF | Regions | | Banks - Regional | 26.90 | 60 | -0.96 | 18.26% |
| SBAC | SBA | | REIT - Specialty | 198.05 | 20 | -0.96 | -0.19% |
| SLM | SLM Corp | | Credit Services | 27.86 | 0 | -0.96 | 2.74% |
| TW | Tradeweb Markets | | Capital Markets | 116.79 | 10 | -0.96 | -10.92% |
| GRX | Gabelli Healthcare | | Closed-End Fund - Equity | 9.33 | 0 | -0.96 | -3.42% |
| BNL | Broadstone Net | | REIT - | 18.60 | 50 | -0.96 | 22.81% |
| ORI | Old Republic | | Insurance - Property & Casualty | 39.88 | 30 | -0.97 | 19.03% |
| TFSL | TFS | | Banks - Regional | 13.24 | 20 | -0.97 | 11.48% |
| ISBC | Investors Bancorp | | S&L | 2.04 | 0 | -0.97 | 0.00% |
| TOWN | Townebank Portsmouth | | Banks - Regional | 35.54 | 10 | -0.98 | 8.62% |
| HTBK | Heritage Commerce | | Banks - Regional | 10.06 | 20 | -0.98 | 13.58% |
| EVT | Eaton Vance | | Closed-End Fund - Equity | 24.16 | 20 | -0.98 | 6.12% |
| TMP | Tompkins | | Banks - Regional | 68.72 | 40 | -0.99 | 5.96% |
| GOF | Guggenheim Strategic | | Closed-End Fund - Debt | 14.94 | 30 | -0.99 | 6.19% |
| ICE | Intercontinental Exchange | | Financial Data & Stock Exchanges | 172.23 | 0 | -1.00 | 15.96% |
| For chart view version of above stock list: Chart View ➞ 0 - 25 , 25 - 50 , 50 - 75 , 75 - 100 , 100 - 125 , 125 - 150 , 150 - 175 , 175 - 200 , 200 - 225 , 225 - 250 , 250 - 275 , 275 - 300 , 300 - 325 , 325 - 350 , 350 - 375 , 375 - 400 , 400 - 425 , 425 - 450 , 450 - 475 , 475 - 500 , 500 - 525 , 525 - 550 , 550 - 575 , 575 - 600 , 600 - 625 , 625 - 650 , 650 - 675 , 675 - 700 , 700 - 725 , 725 - 750 , 750 - 775 , 775 - 800 , 800 - 825 , 825 - 850 , 850 - 875 , 875 - 900 , 900 - 925 , 925 - 950 , 950 - 975 , 975 - 1000 , 1000 - 1025 , 1025 - 1050 , 1050 - 1075 , 1075 - 1100 , 1100 - 1125 , 1125 - 1150 , 1150 - 1175 , 1175 - 1200 , 1200 - 1225 , 1225 - 1250 , 1250 - 1275 , 1275 - 1300 , 1300 - 1325 , 1325 - 1350 , 1350 - 1375 , 1375 - 1400 , 1400 - 1425 , 1425 - 1450 , 1450 - 1475 , 1475 - 1500 , 1500 - 1525 , 1525 - 1550 | ||
 | Click To Change The Sort Order: By Market Cap or Company Size Performance: Year-to-date, Week and Day |  |
|
Get the most comprehensive stock market coverage daily at 12Stocks.com ➞ Best Stocks Today ➞ Best Stocks Weekly ➞ Best Stocks Year-to-Date ➞ Best Stocks Trends ➞  Best Stocks Today 12Stocks.com Best Nasdaq Stocks ➞ Best S&P 500 Stocks ➞ Best Tech Stocks ➞ Best Biotech Stocks ➞ |
| Detailed Overview of Financial Stocks |
| Financial Technical Overview, Leaders & Laggards, Top Financial ETF Funds & Detailed Financial Stocks List, Charts, Trends & More |
| Financial Sector: Technical Analysis, Trends & YTD Performance | |
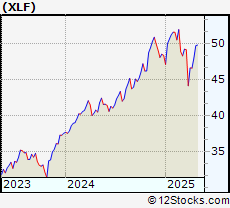
| Financial sector is composed of stocks
from banks, brokers, insurance, REITs
and services subsectors. Financial sector, as represented by XLF, an exchange-traded fund [ETF] that holds basket of Financial stocks (e.g, Bank of America, Goldman Sachs) is up by 12.1335% and is currently underperforming the overall market by -1.2673% year-to-date. Below is a quick view of Technical charts and trends: |
|
 XLF Weekly Chart |
|
| Long Term Trend: Good | |
| Medium Term Trend: Not Good | |
 XLF Daily Chart |
|
| Short Term Trend: Good | |
| Overall Trend Score: 30 | |
| YTD Performance: 12.1335% | |
| **Trend Scores & Views Are Only For Educational Purposes And Not For Investing | |
| 12Stocks.com: Top Performing Financial Sector Stocks | |||||||||||||||||||||||||||||||||||||||||||||||
 The top performing Financial sector stocks year to date are
Now, more recently, over last week, the top performing Financial sector stocks on the move are


|
|||||||||||||||||||||||||||||||||||||||||||||||
| 12Stocks.com: Investing in Financial Sector using Exchange Traded Funds | |
|
The following table shows list of key exchange traded funds (ETF) that
help investors track Financial Index. For detailed view, check out our ETF Funds section of our website. Quick View: Move mouse or cursor over ETF symbol (ticker) to view short-term Technical chart and over ETF name to view long term chart. Click on ticker or stock name for detailed view. Click on to add stock symbol to your watchlist and to view watchlist. |
12Stocks.com List of ETFs that track Financial Index
| Ticker | ETF Name | Watchlist | Recent Price | Smart Investing & Trading Score | Change % | Week % | Year-to-date % |
| CHIX | China Financials | | 10.57 | 20 | 0 | 0 | 0% |
| 12Stocks.com: Charts, Trends, Fundamental Data and Performances of Financial Stocks | |
|
We now take in-depth look at all Financial stocks including charts, multi-period performances and overall trends (as measured by Smart Investing & Trading Score). One can sort Financial stocks (click link to choose) by Daily, Weekly and by Year-to-Date performances. Also, one can sort by size of the company or by market capitalization. |
| Select Your Default Chart Type: | |||||
| |||||
| Click on stock symbol or name for detailed view. Click on to add stock symbol to your watchlist and to view watchlist. Quick View: Move mouse or cursor over "Daily" to quickly view daily Technical stock chart and over "Weekly" to view weekly Technical stock chart. | |||||

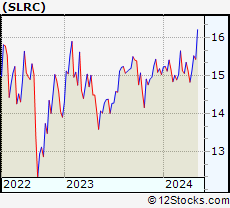 | SLRC SLR Investment Corp |
| Sector: Financials | |
| SubSector: Asset Management | |
| MarketCap: 911.06 Millions | |
| Recent Price: 15.92 Smart Investing & Trading Score: 10 | |
| Day Percent Change: -0.933416% Day Change: -0.01 | |
| Week Change: -4.67066% Year-to-date Change: 2.2% | |
| SLRC Links: Profile News Message Board | |
| Charts:- Daily , Weekly | |
| Add SLRC to Watchlist: View: Get Complete SLRC Trend Analysis ➞ | |
 | NUM Nuveen Michigan Quality Municipal Income Fund |
| Sector: Financials | |
| SubSector: Asset Management | |
| MarketCap: 246.103 Millions | |
| Recent Price: 60.69 Smart Investing & Trading Score: 10 | |
| Day Percent Change: -0.93046% Day Change: -9999 | |
| Week Change: -63.1646% Year-to-date Change: 0.0% | |
| NUM Links: Profile News Message Board | |
| Charts:- Daily , Weekly | |
| Add NUM to Watchlist: View: Get Complete NUM Trend Analysis ➞ | |
 | SAMG Silvercrest Asset Management Group Inc |
| Sector: Financials | |
| SubSector: Asset Management | |
| MarketCap: 198.81 Millions | |
| Recent Price: 16.06 Smart Investing & Trading Score: 50 | |
| Day Percent Change: -0.925355% Day Change: -0.14 | |
| Week Change: 1.51707% Year-to-date Change: -9.7% | |
| SAMG Links: Profile News Message Board | |
| Charts:- Daily , Weekly | |
| Add SAMG to Watchlist: View: Get Complete SAMG Trend Analysis ➞ | |
 | TFC Truist Financial Corporation |
| Sector: Financials | |
| SubSector: Banks - Regional | |
| MarketCap: 59984.5 Millions | |
| Recent Price: 44.78 Smart Investing & Trading Score: 20 | |
| Day Percent Change: -0.929204% Day Change: -0.41 | |
| Week Change: -3.74033% Year-to-date Change: 7.2% | |
| TFC Links: Profile News Message Board | |
| Charts:- Daily , Weekly | |
| Add TFC to Watchlist: View: Get Complete TFC Trend Analysis ➞ | |
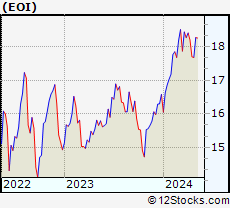 | EOI Eaton Vance Enhanced Equity Income Fund |
| Sector: Financials | |
| SubSector: Closed-End Fund - Equity | |
| MarketCap: 874.98 Millions | |
| Recent Price: 21.34 Smart Investing & Trading Score: 30 | |
| Day Percent Change: -0.928505% Day Change: -0.02 | |
| Week Change: -0.373483% Year-to-date Change: 7.8% | |
| EOI Links: Profile News Message Board | |
| Charts:- Daily , Weekly | |
| Add EOI to Watchlist: View: Get Complete EOI Trend Analysis ➞ | |
 | TRV Travelers Companies Inc |
| Sector: Financials | |
| SubSector: Insurance - Property & Casualty | |
| MarketCap: 61961.3 Millions | |
| Recent Price: 276.30 Smart Investing & Trading Score: 50 | |
| Day Percent Change: -0.942889% Day Change: -1.54 | |
| Week Change: 0.392413% Year-to-date Change: 15.6% | |
| TRV Links: Profile News Message Board | |
| Charts:- Daily , Weekly | |
| Add TRV to Watchlist: View: Get Complete TRV Trend Analysis ➞ | |
 | PLD Prologis Inc |
| Sector: Financials | |
| SubSector: REIT - Industrial | |
| MarketCap: 108028 Millions | |
| Recent Price: 114.27 Smart Investing & Trading Score: 60 | |
| Day Percent Change: -0.936281% Day Change: -1.28 | |
| Week Change: 0.545535% Year-to-date Change: 11.6% | |
| PLD Links: Profile News Message Board | |
| Charts:- Daily , Weekly | |
| Add PLD to Watchlist: View: Get Complete PLD Trend Analysis ➞ | |
 | SKT Tanger Inc |
| Sector: Financials | |
| SubSector: REIT - Retail | |
| MarketCap: 3936.19 Millions | |
| Recent Price: 33.80 Smart Investing & Trading Score: 30 | |
| Day Percent Change: -0.937866% Day Change: -0.24 | |
| Week Change: -2.81771% Year-to-date Change: 2.1% | |
| SKT Links: Profile News Message Board | |
| Charts:- Daily , Weekly | |
| Add SKT to Watchlist: View: Get Complete SKT Trend Analysis ➞ | |
 | KREF KKR Real Estate Finance Trust Inc |
| Sector: Financials | |
| SubSector: REIT - Mortgage | |
| MarketCap: 650.59 Millions | |
| Recent Price: 9.50 Smart Investing & Trading Score: 30 | |
| Day Percent Change: -0.938478% Day Change: -0.23 | |
| Week Change: -3.74873% Year-to-date Change: -2.1% | |
| KREF Links: Profile News Message Board | |
| Charts:- Daily , Weekly | |
| Add KREF to Watchlist: View: Get Complete KREF Trend Analysis ➞ | |
 | FRME First Merchants Corp |
| Sector: Financials | |
| SubSector: Banks - Regional | |
| MarketCap: 2367.6 Millions | |
| Recent Price: 39.65 Smart Investing & Trading Score: 10 | |
| Day Percent Change: -0.949288% Day Change: 0.18 | |
| Week Change: -3.31626% Year-to-date Change: 3.3% | |
| FRME Links: Profile News Message Board | |
| Charts:- Daily , Weekly | |
| Add FRME to Watchlist: View: Get Complete FRME Trend Analysis ➞ | |
 | RF Regions Financial Corp |
| Sector: Financials | |
| SubSector: Banks - Regional | |
| MarketCap: 24119.1 Millions | |
| Recent Price: 26.90 Smart Investing & Trading Score: 60 | |
| Day Percent Change: -0.95729% Day Change: -0.23 | |
| Week Change: -0.480947% Year-to-date Change: 18.3% | |
| RF Links: Profile News Message Board | |
| Charts:- Daily , Weekly | |
| Add RF to Watchlist: View: Get Complete RF Trend Analysis ➞ | |
 | SBAC SBA Communications Corp |
| Sector: Financials | |
| SubSector: REIT - Specialty | |
| MarketCap: 21233.1 Millions | |
| Recent Price: 198.05 Smart Investing & Trading Score: 20 | |
| Day Percent Change: -0.960144% Day Change: -2.24 | |
| Week Change: 0.156772% Year-to-date Change: -0.2% | |
| SBAC Links: Profile News Message Board | |
| Charts:- Daily , Weekly | |
| Add SBAC to Watchlist: View: Get Complete SBAC Trend Analysis ➞ | |
 | SLM SLM Corp |
| Sector: Financials | |
| SubSector: Credit Services | |
| MarketCap: 6485.86 Millions | |
| Recent Price: 27.86 Smart Investing & Trading Score: 0 | |
| Day Percent Change: -0.959829% Day Change: -0.23 | |
| Week Change: -10.4468% Year-to-date Change: 2.7% | |
| SLM Links: Profile News Message Board | |
| Charts:- Daily , Weekly | |
| Add SLM to Watchlist: View: Get Complete SLM Trend Analysis ➞ | |
 | TW Tradeweb Markets Inc |
| Sector: Financials | |
| SubSector: Capital Markets | |
| MarketCap: 28158.8 Millions | |
| Recent Price: 116.79 Smart Investing & Trading Score: 10 | |
| Day Percent Change: -0.958277% Day Change: -1.02 | |
| Week Change: -1.93131% Year-to-date Change: -10.9% | |
| TW Links: Profile News Message Board | |
| Charts:- Daily , Weekly | |
| Add TW to Watchlist: View: Get Complete TW Trend Analysis ➞ | |
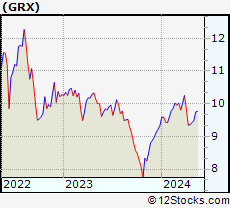 | GRX Gabelli Healthcare & WellnessRx Trust |
| Sector: Financials | |
| SubSector: Closed-End Fund - Equity | |
| MarketCap: 147.31 Millions | |
| Recent Price: 9.33 Smart Investing & Trading Score: 0 | |
| Day Percent Change: -0.955414% Day Change: 0.03 | |
| Week Change: -1.84114% Year-to-date Change: -3.4% | |
| GRX Links: Profile News Message Board | |
| Charts:- Daily , Weekly | |
| Add GRX to Watchlist: View: Get Complete GRX Trend Analysis ➞ | |
 | BNL Broadstone Net Lease Inc |
| Sector: Financials | |
| SubSector: REIT - Diversified | |
| MarketCap: 3532.95 Millions | |
| Recent Price: 18.60 Smart Investing & Trading Score: 50 | |
| Day Percent Change: -0.958466% Day Change: 0.41 | |
| Week Change: -0.428266% Year-to-date Change: 22.8% | |
| BNL Links: Profile News Message Board | |
| Charts:- Daily , Weekly | |
| Add BNL to Watchlist: View: Get Complete BNL Trend Analysis ➞ | |
 | ORI Old Republic International Corp |
| Sector: Financials | |
| SubSector: Insurance - Property & Casualty | |
| MarketCap: 10050.6 Millions | |
| Recent Price: 39.88 Smart Investing & Trading Score: 30 | |
| Day Percent Change: -0.968463% Day Change: -0.34 | |
| Week Change: -1.40915% Year-to-date Change: 19.0% | |
| ORI Links: Profile News Message Board | |
| Charts:- Daily , Weekly | |
| Add ORI to Watchlist: View: Get Complete ORI Trend Analysis ➞ | |
 | TFSL TFS Financial Corporation |
| Sector: Financials | |
| SubSector: Banks - Regional | |
| MarketCap: 3820.16 Millions | |
| Recent Price: 13.24 Smart Investing & Trading Score: 20 | |
| Day Percent Change: -0.972326% Day Change: -0.13 | |
| Week Change: -2.71859% Year-to-date Change: 11.5% | |
| TFSL Links: Profile News Message Board | |
| Charts:- Daily , Weekly | |
| Add TFSL to Watchlist: View: Get Complete TFSL Trend Analysis ➞ | |
 | ISBC Investors Bancorp, Inc. |
| Sector: Financials | |
| SubSector: Savings & Loans | |
| MarketCap: 2182.3 Millions | |
| Recent Price: 2.04 Smart Investing & Trading Score: 0 | |
| Day Percent Change: -0.970874% Day Change: -9999 | |
| Week Change: -85.654% Year-to-date Change: 0.0% | |
| ISBC Links: Profile News Message Board | |
| Charts:- Daily , Weekly | |
| Add ISBC to Watchlist: View: Get Complete ISBC Trend Analysis ➞ | |
 | TOWN Townebank Portsmouth VA |
| Sector: Financials | |
| SubSector: Banks - Regional | |
| MarketCap: 2944.04 Millions | |
| Recent Price: 35.54 Smart Investing & Trading Score: 10 | |
| Day Percent Change: -0.975202% Day Change: 0.05 | |
| Week Change: -2.25523% Year-to-date Change: 8.6% | |
| TOWN Links: Profile News Message Board | |
| Charts:- Daily , Weekly | |
| Add TOWN to Watchlist: View: Get Complete TOWN Trend Analysis ➞ | |
 | HTBK Heritage Commerce Corp |
| Sector: Financials | |
| SubSector: Banks - Regional | |
| MarketCap: 627.99 Millions | |
| Recent Price: 10.06 Smart Investing & Trading Score: 20 | |
| Day Percent Change: -0.984252% Day Change: -0.04 | |
| Week Change: -1.56556% Year-to-date Change: 13.6% | |
| HTBK Links: Profile News Message Board | |
| Charts:- Daily , Weekly | |
| Add HTBK to Watchlist: View: Get Complete HTBK Trend Analysis ➞ | |
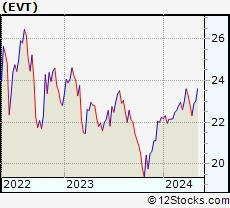 | EVT Eaton Vance Tax Advantaged Dividend Income Fund |
| Sector: Financials | |
| SubSector: Closed-End Fund - Equity | |
| MarketCap: 1812.88 Millions | |
| Recent Price: 24.16 Smart Investing & Trading Score: 20 | |
| Day Percent Change: -0.983607% Day Change: -0.11 | |
| Week Change: -0.657895% Year-to-date Change: 6.1% | |
| EVT Links: Profile News Message Board | |
| Charts:- Daily , Weekly | |
| Add EVT to Watchlist: View: Get Complete EVT Trend Analysis ➞ | |
 | TMP Tompkins Financial Corp |
| Sector: Financials | |
| SubSector: Banks - Regional | |
| MarketCap: 1009.06 Millions | |
| Recent Price: 68.72 Smart Investing & Trading Score: 40 | |
| Day Percent Change: -0.994093% Day Change: 0.09 | |
| Week Change: -1.71625% Year-to-date Change: 6.0% | |
| TMP Links: Profile News Message Board | |
| Charts:- Daily , Weekly | |
| Add TMP to Watchlist: View: Get Complete TMP Trend Analysis ➞ | |
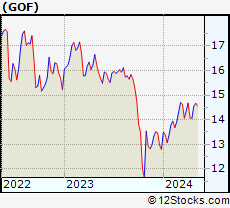 | GOF Guggenheim Strategic Opportunities Fund |
| Sector: Financials | |
| SubSector: Closed-End Fund - Debt | |
| MarketCap: 2659.51 Millions | |
| Recent Price: 14.94 Smart Investing & Trading Score: 30 | |
| Day Percent Change: -0.994036% Day Change: -0.03 | |
| Week Change: -1.25578% Year-to-date Change: 6.2% | |
| GOF Links: Profile News Message Board | |
| Charts:- Daily , Weekly | |
| Add GOF to Watchlist: View: Get Complete GOF Trend Analysis ➞ | |
 | ICE Intercontinental Exchange Inc |
| Sector: Financials | |
| SubSector: Financial Data & Stock Exchanges | |
| MarketCap: 99756.2 Millions | |
| Recent Price: 172.23 Smart Investing & Trading Score: 0 | |
| Day Percent Change: -1.00017% Day Change: -1.2 | |
| Week Change: -1.1706% Year-to-date Change: 16.0% | |
| ICE Links: Profile News Message Board | |
| Charts:- Daily , Weekly | |
| Add ICE to Watchlist: View: Get Complete ICE Trend Analysis ➞ | |
| For tabular summary view of above stock list: Summary View ➞ 0 - 25 , 25 - 50 , 50 - 75 , 75 - 100 , 100 - 125 , 125 - 150 , 150 - 175 , 175 - 200 , 200 - 225 , 225 - 250 , 250 - 275 , 275 - 300 , 300 - 325 , 325 - 350 , 350 - 375 , 375 - 400 , 400 - 425 , 425 - 450 , 450 - 475 , 475 - 500 , 500 - 525 , 525 - 550 , 550 - 575 , 575 - 600 , 600 - 625 , 625 - 650 , 650 - 675 , 675 - 700 , 700 - 725 , 725 - 750 , 750 - 775 , 775 - 800 , 800 - 825 , 825 - 850 , 850 - 875 , 875 - 900 , 900 - 925 , 925 - 950 , 950 - 975 , 975 - 1000 , 1000 - 1025 , 1025 - 1050 , 1050 - 1075 , 1075 - 1100 , 1100 - 1125 , 1125 - 1150 , 1150 - 1175 , 1175 - 1200 , 1200 - 1225 , 1225 - 1250 , 1250 - 1275 , 1275 - 1300 , 1300 - 1325 , 1325 - 1350 , 1350 - 1375 , 1375 - 1400 , 1400 - 1425 , 1425 - 1450 , 1450 - 1475 , 1475 - 1500 , 1500 - 1525 , 1525 - 1550 | ||
| Click To Change The Sort Order: By Market Cap or Company Size Performance: Year-to-date, Week and Day | |
| Select Chart Type: | ||
|
Best Stocks Today 12Stocks.com |
© 2025 12Stocks.com Terms & Conditions Privacy Contact Us
All Information Provided Only For Education And Not To Be Used For Investing or Trading. See Terms & Conditions


One More Thing ... Get Best Stocks Delivered Daily!
Never Ever Miss A Move With Our Top Ten Stocks Lists
Find Best Stocks In Any Market - Bull or Bear Market
Take A Peek At Our Top Ten Stocks Lists: Daily, Weekly, Year-to-Date & Top Trends
Find Best Stocks In Any Market - Bull or Bear Market
Take A Peek At Our Top Ten Stocks Lists: Daily, Weekly, Year-to-Date & Top Trends
Financial Stocks With Best Up Trends [0-bearish to 100-bullish]: PIMCO California[100], Torchmark [100], PIMCO California[100], Triumph Bancorp[100], Lemonade [100], PIMCO Municipal[100], Better Home[100], PIMCO Municipal[100], SuRo Capital[100], Front Yard[100], Atlanticus [100]
Best Financial Stocks Year-to-Date:
Insight Select[12384.6%], Oxford Lane[298.776%], Metalpha Technology[206.195%], Robinhood Markets[191.151%], Better Home[187.309%], Mr. Cooper[133.83%], LoanDepot [131.282%], Banco Santander[130.948%], IHS Holding[125.472%], Cipher Mining[124.638%], Deutsche Bank[123.86%] Best Financial Stocks This Week:
Colony Starwood[15929900%], Blackhawk Network[91300%], Macquarie Global[81662.9%], Credit Suisse[63241.6%], Pennsylvania Real[23823%], First Republic[22570.9%], Select ome[14000%], CorEnergy Infrastructure[6797.78%], FedNat Holding[5525%], BlackRock Municipal[5340%], BlackRock MuniYield[3379.04%] Best Financial Stocks Daily:
PIMCO California[11.9545%], Torchmark [11.8363%], PIMCO California[11.4754%], BlackRock Muni[10.8108%], Blackrock MuniYield[10.72%], Triumph Bancorp[10.2661%], BlackRock MuniYield[8.15348%], Lemonade [7.81815%], Summit [7.79817%], Concord Acquisition[7.63431%], PIMCO Municipal[6.8299%]