
 Login Sign Up


| |||||
 |  | ||||

| 12Stocks.com Market Intelligence |
Best Financial Stocks
| In a hurry? Financial Stocks Lists: Performance Trends Table, Stock Charts
Sort Financial stocks: Daily, Weekly, Year-to-Date, Market Cap & Trends. Filter Financial stocks list by size:All Financial Large Mid-Range Small & MicroCap |
| 12Stocks.com Financial Stocks Performances & Trends Daily | |||||||||
|
|  The overall Smart Investing & Trading Score is 50 (0-bearish to 100-bullish) which puts Financial sector in short term neutral trend. The Smart Investing & Trading Score from previous trading session is 100 and hence a deterioration of trend.
| ||||||||
Here are the Smart Investing & Trading Scores of the most requested Financial stocks at 12Stocks.com (click stock name for detailed review):
|


| 12Stocks.com: Investing in Financial sector with Stocks | |
|
The following table helps investors and traders sort through current performance and trends (as measured by Smart Investing & Trading Score) of various
stocks in the Financial sector. Quick View: Move mouse or cursor over stock symbol (ticker) to view short-term Technical chart and over stock name to view long term chart. Click on  to add stock symbol to your watchlist and to add stock symbol to your watchlist and  to view watchlist. Click on any ticker or stock name for detailed market intelligence report for that stock. to view watchlist. Click on any ticker or stock name for detailed market intelligence report for that stock. |
12Stocks.com Performance of Stocks in Financial Sector
| Ticker | Stock Name | Watchlist | Category | Recent Price | Smart Investing & Trading Score | Change % | YTD Change% |
| STT | State Street |   | Asset Mgmt | 112.83 | 40 | -1.86 | 12.79% |
| HASI | Hannon Armstrong | | REIT - | 28.24 | 40 | -1.87 | 5.08% |
| CWH | Camping World | | REIT - Office | 17.51 | 30 | -1.91 | -18.42% |
| GS | Goldman Sachs | | Brokerage | 730.85 | 40 | -1.93 | 15.26% |
| ARI | Apollo Commercial | | Mortgage | 10.59 | 100 | -1.95 | 22.49% |
| KNSL | Kinsale Capital | | Insurance | 457.45 | 50 | -1.95 | -1.23% |
| ECPG | Encore Capital | | Asset Mgmt | 41.84 | 70 | -1.96 | -15.09% |
| O | Realty ome | | REIT - Retail | 57.6 | 40 | -1.97 | 8.96% |
| NYMT | New York | | Mortgage | 7.22 | 90 | -1.99 | 21.10% |
| RMAX | RE/MAX | | Property Mgmt | 9.42 | 50 | -1.99 | -21.37% |
| NTRS | Northern Trust | | Asset Mgmt | 128.65 | 40 | -2.00 | 16.29% |
| CNS | Cohen & Steers | | Asset Mgmt | 73.86 | 0 | -2.00 | -20.35% |
| RF | Regions | | Regional Banks | 26.81 | 60 | -2.12 | 11.26% |
| UNIT | Uniti | | REIT - Industrial | 6.30 | 0 | -2.13 | -34.56% |
| ABR | Arbor Realty | | Mortgage | 11.94 | 40 | -2.15 | -12.59% |
| GCBC | Greene County | | S&L | 23.99 | 50 | -2.16 | -16.21% |
| GSHD | Goosehead Insurance | | Insurance | 84.71 | 0 | -2.18 | -14.68% |
| LGIH | LGI Homes | | Real Estatet | 61.91 | 40 | -2.21 | -30.63% |
| MTB | M&T Bank | | Regional Banks | 197.17 | 50 | -2.23 | -0.59% |
| SUNS | Solar Senior | | Asset Mgmt | 11.06 | 80 | -2.23 | -21.13% |
| ARE | Alexandria Real | | REIT - Office | 80.56 | 50 | -2.28 | -14.55% |
| PMT | PennyMac Mortgage | | Mortgage | 12.31 | 10 | -2.30 | 0.59% |
| JBGS | JBG SMITH | | Property Mgmt | 21.44 | 90 | -2.31 | 34.71% |
| PRU | Prudential | | Life Insurance | 107.07 | 20 | -2.36 | -9.11% |
| TROW | T. Rowe | | Asset Mgmt | 105.04 | 40 | -2.40 | -7.66% |
| For chart view version of above stock list: Chart View ➞ 0 - 25 , 25 - 50 , 50 - 75 , 75 - 100 , 100 - 125 , 125 - 150 , 150 - 175 , 175 - 200 , 200 - 225 , 225 - 250 , 250 - 275 , 275 - 300 , 300 - 325 , 325 - 350 , 350 - 375 , 375 - 400 , 400 - 425 , 425 - 450 , 450 - 475 , 475 - 500 , 500 - 525 , 525 - 550 , 550 - 575 , 575 - 600 , 600 - 625 , 625 - 650 , 650 - 675 , 675 - 700 , 700 - 725 , 725 - 750 , 750 - 775 , 775 - 800 , 800 - 825 , 825 - 850 , 850 - 875 , 875 - 900 , 900 - 925 , 925 - 950 , 950 - 975 , 975 - 1000 , 1000 - 1025 , 1025 - 1050 , 1050 - 1075 , 1075 - 1100 , 1100 - 1125 | ||
 | Click To Change The Sort Order: By Market Cap or Company Size Performance: Year-to-date, Week and Day |  |
|
Get the most comprehensive stock market coverage daily at 12Stocks.com ➞ Best Stocks Today ➞ Best Stocks Weekly ➞ Best Stocks Year-to-Date ➞ Best Stocks Trends ➞  Best Stocks Today 12Stocks.com Best Nasdaq Stocks ➞ Best S&P 500 Stocks ➞ Best Tech Stocks ➞ Best Biotech Stocks ➞ |
| Detailed Overview of Financial Stocks |
| Financial Technical Overview, Leaders & Laggards, Top Financial ETF Funds & Detailed Financial Stocks List, Charts, Trends & More |
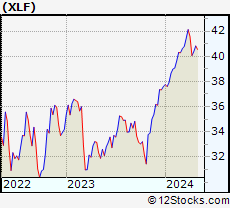
| Financial Sector: Technical Analysis, Trends & YTD Performance | |
| Financial sector is composed of stocks
from banks, brokers, insurance, REITs
and services subsectors. Financial sector, as represented by XLF, an exchange-traded fund [ETF] that holds basket of Financial stocks (e.g, Bank of America, Goldman Sachs) is up by 4.86% and is currently underperforming the overall market by -1.66% year-to-date. Below is a quick view of Technical charts and trends: |
|
 XLF Weekly Chart |
|
| Long Term Trend: Good | |
| Medium Term Trend: Very Good | |
 XLF Daily Chart |
|
| Short Term Trend: Not Good | |
| Overall Trend Score: 50 | |
| YTD Performance: 4.86% | |
| **Trend Scores & Views Are Only For Educational Purposes And Not For Investing | |
| 12Stocks.com: Top Performing Financial Sector Stocks | ||||||||||||||||||||||||||||||||||||||||||||||||
 The top performing Financial sector stocks year to date are
Now, more recently, over last week, the top performing Financial sector stocks on the move are


|
||||||||||||||||||||||||||||||||||||||||||||||||
| 12Stocks.com: Investing in Financial Sector using Exchange Traded Funds | |
|
The following table shows list of key exchange traded funds (ETF) that
help investors track Financial Index. For detailed view, check out our ETF Funds section of our website. Quick View: Move mouse or cursor over ETF symbol (ticker) to view short-term Technical chart and over ETF name to view long term chart. Click on ticker or stock name for detailed view. Click on to add stock symbol to your watchlist and to view watchlist. |
12Stocks.com List of ETFs that track Financial Index
| Ticker | ETF Name | Watchlist | Recent Price | Smart Investing & Trading Score | Change % | Week % | Year-to-date % |
| XLF | Financial | | 53.59 | 50 | -0.74 | -0.74 | 4.86% |
| IAI | Broker-Dealers & Secs | | 174.18 | 20 | 1.92 | 0.6 | 12.72% |
| IYF | Financials | | 125.73 | 60 | -0.32 | -0.87 | 11.86% |
| IYG | Financial Services | | 89.69 | 60 | -0.27 | -1.08 | 12.5% |
| KRE | Regional Banking | | 65.51 | 70 | -0.4 | -1.29 | 3.78% |
| IXG | Global Financials | | 115.49 | 50 | -0.21 | -0.37 | 20.55% |
| VFH | Financials | | 131.97 | 60 | -0.32 | -0.85 | 9.82% |
| KBE | Bank | | 61.06 | 60 | 4.83 | 5.08 | 4.7% |
| FAS | Financial Bull 3X | | 180.01 | 50 | 4.68 | 5.86 | -1.42% |
| FAZ | Financial Bear 3X | | 4.06 | 60 | -4.81 | -5.67 | -19.26% |
| UYG | Financials | | 99.90 | 50 | 3.1 | 4.07 | 2.59% |
| IAT | Regional Banks | | 54.11 | 70 | -0.53 | -1.12 | 2.84% |
| KIE | Insurance | | 58.86 | 20 | 1.22 | 3.09 | 3.97% |
| PSCF | SmallCap Financials | | 58.90 | 50 | -0.44 | -0.75 | 2.76% |
| EUFN | Europe Financials | | 33.43 | 30 | -0.35 | -0.32 | 51.27% |
| PGF | Financial Preferred | | 14.44 | 60 | -0.14 | 0.35 | 3.03% |
| 12Stocks.com: Charts, Trends, Fundamental Data and Performances of Financial Stocks | |
|
We now take in-depth look at all Financial stocks including charts, multi-period performances and overall trends (as measured by Smart Investing & Trading Score). One can sort Financial stocks (click link to choose) by Daily, Weekly and by Year-to-Date performances. Also, one can sort by size of the company or by market capitalization. |
| Select Your Default Chart Type: | |||||
| |||||
| Click on stock symbol or name for detailed view. Click on to add stock symbol to your watchlist and to view watchlist. Quick View: Move mouse or cursor over "Daily" to quickly view daily Technical stock chart and over "Weekly" to view weekly Technical stock chart. | |||||

 | STT State Street Corporation |
| Sector: Financials | |
| SubSector: Asset Management | |
| MarketCap: 18623 Millions | |
| Recent Price: 112.83 Smart Investing & Trading Score: 40 | |
| Day Percent Change: -1.86% Day Change: -2.14 | |
| Week Change: -1.86% Year-to-date Change: 12.8% | |
| STT Links: Profile News Message Board | |
| Charts:- Daily , Weekly | |
| Add STT to Watchlist: View: Get Complete STT Trend Analysis ➞ | |
 | HASI Hannon Armstrong Sustainable Infrastructure Capital, Inc. |
| Sector: Financials | |
| SubSector: REIT - Diversified | |
| MarketCap: 1405.93 Millions | |
| Recent Price: 28.24 Smart Investing & Trading Score: 40 | |
| Day Percent Change: -1.87% Day Change: -0.52 | |
| Week Change: 2.55% Year-to-date Change: 5.1% | |
| HASI Links: Profile News Message Board | |
| Charts:- Daily , Weekly | |
| Add HASI to Watchlist: View: Get Complete HASI Trend Analysis ➞ | |
 | CWH Camping World Holdings, Inc. |
| Sector: Financials | |
| SubSector: REIT - Office | |
| MarketCap: 473.566 Millions | |
| Recent Price: 17.51 Smart Investing & Trading Score: 30 | |
| Day Percent Change: -1.91% Day Change: -0.33 | |
| Week Change: -2.75% Year-to-date Change: -18.4% | |
| CWH Links: Profile News Message Board | |
| Charts:- Daily , Weekly | |
| Add CWH to Watchlist: View: Get Complete CWH Trend Analysis ➞ | |
 | GS The Goldman Sachs Group, Inc. |
| Sector: Financials | |
| SubSector: Investment Brokerage - National | |
| MarketCap: 54579.3 Millions | |
| Recent Price: 730.85 Smart Investing & Trading Score: 40 | |
| Day Percent Change: -1.93% Day Change: -14.4 | |
| Week Change: -1.93% Year-to-date Change: 15.3% | |
| GS Links: Profile News Message Board | |
| Charts:- Daily , Weekly | |
| Add GS to Watchlist: View: Get Complete GS Trend Analysis ➞ | |
 | ARI Apollo Commercial Real Estate Finance, Inc. |
| Sector: Financials | |
| SubSector: Mortgage Investment | |
| MarketCap: 1302.19 Millions | |
| Recent Price: 10.59 Smart Investing & Trading Score: 100 | |
| Day Percent Change: -1.95% Day Change: -0.2 | |
| Week Change: -0.4% Year-to-date Change: 22.5% | |
| ARI Links: Profile News Message Board | |
| Charts:- Daily , Weekly | |
| Add ARI to Watchlist: View: Get Complete ARI Trend Analysis ➞ | |
 | KNSL Kinsale Capital Group, Inc. |
| Sector: Financials | |
| SubSector: Property & Casualty Insurance | |
| MarketCap: 2198.12 Millions | |
| Recent Price: 457.45 Smart Investing & Trading Score: 50 | |
| Day Percent Change: -1.95% Day Change: -9.15 | |
| Week Change: 1.19% Year-to-date Change: -1.2% | |
| KNSL Links: Profile News Message Board | |
| Charts:- Daily , Weekly | |
| Add KNSL to Watchlist: View: Get Complete KNSL Trend Analysis ➞ | |
 | ECPG Encore Capital Group, Inc. |
| Sector: Financials | |
| SubSector: Asset Management | |
| MarketCap: 661.503 Millions | |
| Recent Price: 41.84 Smart Investing & Trading Score: 70 | |
| Day Percent Change: -1.96% Day Change: -0.81 | |
| Week Change: -2.27% Year-to-date Change: -15.1% | |
| ECPG Links: Profile News Message Board | |
| Charts:- Daily , Weekly | |
| Add ECPG to Watchlist: View: Get Complete ECPG Trend Analysis ➞ | |
 | O Realty Income Corporation |
| Sector: Financials | |
| SubSector: REIT - Retail | |
| MarketCap: 17647.4 Millions | |
| Recent Price: 57.6 Smart Investing & Trading Score: 40 | |
| Day Percent Change: -1.97% Day Change: -1.16 | |
| Week Change: -1.97% Year-to-date Change: 9.0% | |
| O Links: Profile News Message Board | |
| Charts:- Daily , Weekly | |
| Add O to Watchlist: View: Get Complete O Trend Analysis ➞ | |
 | NYMT New York Mortgage Trust, Inc. |
| Sector: Financials | |
| SubSector: Mortgage Investment | |
| MarketCap: 1038.39 Millions | |
| Recent Price: 7.22 Smart Investing & Trading Score: 90 | |
| Day Percent Change: -1.99% Day Change: -0.14 | |
| Week Change: 1.02% Year-to-date Change: 21.1% | |
| NYMT Links: Profile News Message Board | |
| Charts:- Daily , Weekly | |
| Add NYMT to Watchlist: View: Get Complete NYMT Trend Analysis ➞ | |
 | RMAX RE/MAX Holdings, Inc. |
| Sector: Financials | |
| SubSector: Property Management | |
| MarketCap: 334.742 Millions | |
| Recent Price: 9.42 Smart Investing & Trading Score: 50 | |
| Day Percent Change: -1.99% Day Change: -0.17 | |
| Week Change: -4.44% Year-to-date Change: -21.4% | |
| RMAX Links: Profile News Message Board | |
| Charts:- Daily , Weekly | |
| Add RMAX to Watchlist: View: Get Complete RMAX Trend Analysis ➞ | |
 | NTRS Northern Trust Corporation |
| Sector: Financials | |
| SubSector: Asset Management | |
| MarketCap: 15316.8 Millions | |
| Recent Price: 128.65 Smart Investing & Trading Score: 40 | |
| Day Percent Change: -2% Day Change: -2.63 | |
| Week Change: -2% Year-to-date Change: 16.3% | |
| NTRS Links: Profile News Message Board | |
| Charts:- Daily , Weekly | |
| Add NTRS to Watchlist: View: Get Complete NTRS Trend Analysis ➞ | |
 | CNS Cohen & Steers, Inc. |
| Sector: Financials | |
| SubSector: Asset Management | |
| MarketCap: 2082.43 Millions | |
| Recent Price: 73.86 Smart Investing & Trading Score: 0 | |
| Day Percent Change: -2% Day Change: -1.47 | |
| Week Change: -6.24% Year-to-date Change: -20.4% | |
| CNS Links: Profile News Message Board | |
| Charts:- Daily , Weekly | |
| Add CNS to Watchlist: View: Get Complete CNS Trend Analysis ➞ | |
 | RF Regions Financial Corporation |
| Sector: Financials | |
| SubSector: Regional - Southeast Banks | |
| MarketCap: 8936.25 Millions | |
| Recent Price: 26.81 Smart Investing & Trading Score: 60 | |
| Day Percent Change: -2.12% Day Change: -0.58 | |
| Week Change: -2.12% Year-to-date Change: 11.3% | |
| RF Links: Profile News Message Board | |
| Charts:- Daily , Weekly | |
| Add RF to Watchlist: View: Get Complete RF Trend Analysis ➞ | |
 | UNIT Uniti Group Inc. |
| Sector: Financials | |
| SubSector: REIT - Industrial | |
| MarketCap: 1363.09 Millions | |
| Recent Price: 6.30 Smart Investing & Trading Score: 0 | |
| Day Percent Change: -2.13% Day Change: -0.13 | |
| Week Change: -7.15% Year-to-date Change: -34.6% | |
| UNIT Links: Profile News Message Board | |
| Charts:- Daily , Weekly | |
| Add UNIT to Watchlist: View: Get Complete UNIT Trend Analysis ➞ | |
 | ABR Arbor Realty Trust, Inc. |
| Sector: Financials | |
| SubSector: Mortgage Investment | |
| MarketCap: 648.939 Millions | |
| Recent Price: 11.94 Smart Investing & Trading Score: 40 | |
| Day Percent Change: -2.15% Day Change: -0.25 | |
| Week Change: -4.7% Year-to-date Change: -12.6% | |
| ABR Links: Profile News Message Board | |
| Charts:- Daily , Weekly | |
| Add ABR to Watchlist: View: Get Complete ABR Trend Analysis ➞ | |
 | GCBC Greene County Bancorp, Inc. |
| Sector: Financials | |
| SubSector: Savings & Loans | |
| MarketCap: 314.83 Millions | |
| Recent Price: 23.99 Smart Investing & Trading Score: 50 | |
| Day Percent Change: -2.16% Day Change: -0.51 | |
| Week Change: -5.65% Year-to-date Change: -16.2% | |
| GCBC Links: Profile News Message Board | |
| Charts:- Daily , Weekly | |
| Add GCBC to Watchlist: View: Get Complete GCBC Trend Analysis ➞ | |
 | GSHD Goosehead Insurance, Inc |
| Sector: Financials | |
| SubSector: Insurance Brokers | |
| MarketCap: 1863.57 Millions | |
| Recent Price: 84.71 Smart Investing & Trading Score: 0 | |
| Day Percent Change: -2.18% Day Change: -1.93 | |
| Week Change: 0.14% Year-to-date Change: -14.7% | |
| GSHD Links: Profile News Message Board | |
| Charts:- Daily , Weekly | |
| Add GSHD to Watchlist: View: Get Complete GSHD Trend Analysis ➞ | |
 | LGIH LGI Homes, Inc. |
| Sector: Financials | |
| SubSector: Real Estate Development | |
| MarketCap: 1316.49 Millions | |
| Recent Price: 61.91 Smart Investing & Trading Score: 40 | |
| Day Percent Change: -2.21% Day Change: -1.4 | |
| Week Change: -4.61% Year-to-date Change: -30.6% | |
| LGIH Links: Profile News Message Board | |
| Charts:- Daily , Weekly | |
| Add LGIH to Watchlist: View: Get Complete LGIH Trend Analysis ➞ | |
 | MTB M&T Bank Corporation |
| Sector: Financials | |
| SubSector: Regional - Northeast Banks | |
| MarketCap: 13950.9 Millions | |
| Recent Price: 197.17 Smart Investing & Trading Score: 50 | |
| Day Percent Change: -2.23% Day Change: -4.49 | |
| Week Change: -2.23% Year-to-date Change: -0.6% | |
| MTB Links: Profile News Message Board | |
| Charts:- Daily , Weekly | |
| Add MTB to Watchlist: View: Get Complete MTB Trend Analysis ➞ | |
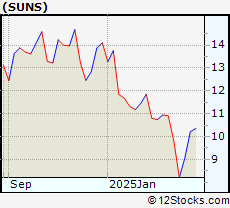 | SUNS Solar Senior Capital Ltd. |
| Sector: Financials | |
| SubSector: Asset Management | |
| MarketCap: 147.203 Millions | |
| Recent Price: 11.06 Smart Investing & Trading Score: 80 | |
| Day Percent Change: -2.23% Day Change: -0.24 | |
| Week Change: -0.19% Year-to-date Change: -21.1% | |
| SUNS Links: Profile News Message Board | |
| Charts:- Daily , Weekly | |
| Add SUNS to Watchlist: View: Get Complete SUNS Trend Analysis ➞ | |
 | ARE Alexandria Real Estate Equities, Inc. |
| Sector: Financials | |
| SubSector: REIT - Office | |
| MarketCap: 16793.6 Millions | |
| Recent Price: 80.56 Smart Investing & Trading Score: 50 | |
| Day Percent Change: -2.28% Day Change: -1.88 | |
| Week Change: -2.28% Year-to-date Change: -14.6% | |
| ARE Links: Profile News Message Board | |
| Charts:- Daily , Weekly | |
| Add ARE to Watchlist: View: Get Complete ARE Trend Analysis ➞ | |
 | PMT PennyMac Mortgage Investment Trust |
| Sector: Financials | |
| SubSector: Mortgage Investment | |
| MarketCap: 917.639 Millions | |
| Recent Price: 12.31 Smart Investing & Trading Score: 10 | |
| Day Percent Change: -2.3% Day Change: -0.28 | |
| Week Change: -2.38% Year-to-date Change: 0.6% | |
| PMT Links: Profile News Message Board | |
| Charts:- Daily , Weekly | |
| Add PMT to Watchlist: View: Get Complete PMT Trend Analysis ➞ | |
 | JBGS JBG SMITH Properties |
| Sector: Financials | |
| SubSector: Property Management | |
| MarketCap: 4335.32 Millions | |
| Recent Price: 21.44 Smart Investing & Trading Score: 90 | |
| Day Percent Change: -2.31% Day Change: -0.48 | |
| Week Change: 1.1% Year-to-date Change: 34.7% | |
| JBGS Links: Profile News Message Board | |
| Charts:- Daily , Weekly | |
| Add JBGS to Watchlist: View: Get Complete JBGS Trend Analysis ➞ | |
 | PRU Prudential Financial, Inc. |
| Sector: Financials | |
| SubSector: Life Insurance | |
| MarketCap: 21001.6 Millions | |
| Recent Price: 107.07 Smart Investing & Trading Score: 20 | |
| Day Percent Change: -2.36% Day Change: -2.59 | |
| Week Change: -2.36% Year-to-date Change: -9.1% | |
| PRU Links: Profile News Message Board | |
| Charts:- Daily , Weekly | |
| Add PRU to Watchlist: View: Get Complete PRU Trend Analysis ➞ | |
 | TROW T. Rowe Price Group, Inc. |
| Sector: Financials | |
| SubSector: Asset Management | |
| MarketCap: 24530 Millions | |
| Recent Price: 105.04 Smart Investing & Trading Score: 40 | |
| Day Percent Change: -2.4% Day Change: -2.58 | |
| Week Change: -2.4% Year-to-date Change: -7.7% | |
| TROW Links: Profile News Message Board | |
| Charts:- Daily , Weekly | |
| Add TROW to Watchlist: View: Get Complete TROW Trend Analysis ➞ | |
| For tabular summary view of above stock list: Summary View ➞ 0 - 25 , 25 - 50 , 50 - 75 , 75 - 100 , 100 - 125 , 125 - 150 , 150 - 175 , 175 - 200 , 200 - 225 , 225 - 250 , 250 - 275 , 275 - 300 , 300 - 325 , 325 - 350 , 350 - 375 , 375 - 400 , 400 - 425 , 425 - 450 , 450 - 475 , 475 - 500 , 500 - 525 , 525 - 550 , 550 - 575 , 575 - 600 , 600 - 625 , 625 - 650 , 650 - 675 , 675 - 700 , 700 - 725 , 725 - 750 , 750 - 775 , 775 - 800 , 800 - 825 , 825 - 850 , 850 - 875 , 875 - 900 , 900 - 925 , 925 - 950 , 950 - 975 , 975 - 1000 , 1000 - 1025 , 1025 - 1050 , 1050 - 1075 , 1075 - 1100 , 1100 - 1125 | ||
| Click To Change The Sort Order: By Market Cap or Company Size Performance: Year-to-date, Week and Day | |
| Select Chart Type: | ||
|
Best Stocks Today 12Stocks.com |
© 2025 12Stocks.com Terms & Conditions Privacy Contact Us
All Information Provided Only For Education And Not To Be Used For Investing or Trading. See Terms & Conditions


One More Thing ... Get Best Stocks Delivered Daily!
Never Ever Miss A Move With Our Top Ten Stocks Lists
Find Best Stocks In Any Market - Bull or Bear Market
Take A Peek At Our Top Ten Stocks Lists: Daily, Weekly, Year-to-Date & Top Trends
Find Best Stocks In Any Market - Bull or Bear Market
Take A Peek At Our Top Ten Stocks Lists: Daily, Weekly, Year-to-Date & Top Trends
Financial Stocks With Best Up Trends [0-bearish to 100-bullish]: MicroSectors Gold[100], Offerpad [100], NexGen Energy[100], Healthcare Realty[100], Eagle Point[100], EZCORP [100], Monroe Capital[100], KraneShares Trust[100], Infusive Compounding[100], Credicorp [100], Mexico Fund[100]
Best Financial Stocks Year-to-Date:
ESSA Bancorp[2923.51%], MicroSectors Gold[261.7%], Banco Santander[113.19%], Banco Bilbao[102.83%], Iris Energy[99.49%], Bancolombia S.A[93.5%], Mr. Cooper[91.06%], Heritage Insurance[90.66%], Inter & Co[86.91%], Deutsche Bank[82.36%], X [80.17%] Best Financial Stocks This Week:
Plymouth Industrial[40.4%], SelectQuote [30.15%], Seritage Growth[20.21%], MBIA [18.44%], iShares iBonds[14.61%], Nu [13.82%], TD Ameritrade[11.19%], Cipher Mining[10.9%], Brookfield Business[10.18%], Brookfield Business[9.78%], Stratus Properties[8.94%] Best Financial Stocks Daily:
SelectQuote [41.53%], X [15.73%], CNFinance [7.77%], Aegon N.V[7.64%], AdvisorShares Pure[6.12%], FinVolution [5.55%], Hippo [5.47%], Lufax Holding[5.45%], MicroSectors Gold[4.98%], eHealth [4.65%], TD Ameritrade[3.76%]