
 Login Sign Up


| |||||
 |  | ||||

| 12Stocks.com Market Intelligence |
Best Tech Stocks
| In a hurry? Tech Stocks Lists: Performance & Trends, Stock Charts, FANG Stocks
Sort Tech stocks: Daily, Weekly, Year-to-Date, Market Cap & Trends. Filter Tech stocks list by size:All Tech Large Mid-Range Small and MicroCap |
| 12Stocks.com Tech Stocks Performances & Trends Daily | |||||||||
|
|  The overall Smart Investing & Trading Score is 78 (0-bearish to 100-bullish) which puts Technology sector in short term neutral to bullish trend. The Smart Investing & Trading Score from previous trading session is 90 and hence a deterioration of trend.
| ||||||||
Here are the Smart Investing & Trading Scores of the most requested Technology stocks at 12Stocks.com (click stock name for detailed review):
|


| 12Stocks.com: Investing in Technology sector with Stocks | |
|
The following table helps investors and traders sort through current performance and trends (as measured by Smart Investing & Trading Score) of various
stocks in the Tech sector. Quick View: Move mouse or cursor over stock symbol (ticker) to view short-term technical chart and over stock name to view long term chart. Click on  to add stock symbol to your watchlist and to add stock symbol to your watchlist and  to view watchlist. Click on any ticker or stock name for detailed market intelligence report for that stock. to view watchlist. Click on any ticker or stock name for detailed market intelligence report for that stock. |
12Stocks.com Performance of Stocks in Tech Sector
| Ticker | Stock Name | Watchlist | Category | Recent Price | Smart Investing & Trading Score | Change % | Weekly Change% |
| NXPI | NXP Semiconductors |   | Semiconductor | 267.72 | 76 | -0.70% | 2.29% |
| DASH | DoorDash | | Internet Content & Information | 117.43 | 39 | 1.09% | 2.26% |
| ADP | Automatic Data | | Software | 252.33 | 87 | 0.91% | 2.22% |
| FDS | FactSet Research | | IT | 448.88 | 59 | 0.75% | 2.21% |
| TEF | Telefonica S.A | | Telecom | 4.46 | 68 | 0.68% | 2.06% |
| CHT | Chunghwa Telecom | | Telecom | 39.16 | 100 | 0.26% | 1.93% |
| ANET | Arista Networks | | Computer | 319.89 | 83 | -0.06% | 1.87% |
| RELX | RELX | | IT | 44.07 | 77 | 0.34% | 1.85% |
| DNB | Dun & Bradstreet | | IT | 10.65 | 43 | -0.37% | 1.82% |
| NTAP | NetApp | | Data Storage | 110.47 | 90 | 0.66% | 1.82% |
| LHX | L3Harris | | Communication | 223.57 | 88 | 0.67% | 1.82% |
| SNPS | Synopsys | | Semiconductor | 566.73 | 47 | -0.45% | 1.80% |
| BSY | Bentley Systems | | Software | 56.46 | 95 | 0.68% | 1.77% |
| BIDU | Baidu | | Internet | 110.58 | 83 | -1.79% | 1.77% |
| PCOR | Procore | | Software - | 69.46 | 42 | 0.33% | 1.70% |
| MTCH | Match | | Internet | 31.21 | 27 | -0.48% | 1.69% |
| NFLX | Netflix | | CATV | 621.10 | 90 | 1.73% | 1.67% |
| TSM | Taiwan Semiconductor | | Semiconductor | 151.68 | 76 | -0.36% | 1.62% |
| LBRDA | Liberty Broadband | | CATV | 53.68 | 50 | -1.11% | 1.59% |
| ADSK | Autodesk | | Software | 221.21 | 59 | 0.35% | 1.58% |
| SWKS | Skyworks | | Semiconductor | 93.62 | 27 | -0.50% | 1.54% |
| INFY | Infosys | | IT | 17.13 | 52 | -0.64% | 1.54% |
| SAP | SAP SE | | Software | 192.80 | 90 | 1.12% | 1.45% |
| MSI | Motorola | | Communication | 367.80 | 95 | 0.38% | 1.36% |
| T | AT&T | | Telecom | 17.40 | 83 | 0.58% | 1.34% |
| For chart view version of above stock list: Chart View ➞ 0 - 25 , 25 - 50 , 50 - 75 , 75 - 100 , 100 - 125 , 125 - 150 , 150 - 175 , 175 - 200 | ||
 | Click To Change The Sort Order: By Market Cap or Company Size Performance: Year-to-date, Week and Day |  |
|
Get the most comprehensive stock market coverage daily at 12Stocks.com ➞ Best Stocks Today ➞ Best Stocks Weekly ➞ Best Stocks Year-to-Date ➞ Best Stocks Trends ➞  Best Stocks Today 12Stocks.com Best Nasdaq Stocks ➞ Best S&P 500 Stocks ➞ Best Tech Stocks ➞ Best Biotech Stocks ➞ |
| Detailed Overview of Tech Stocks |
| Tech Technical Overview, Leaders & Laggards, Top Tech ETF Funds & Detailed Tech Stocks List, Charts, Trends & More |
| Tech Sector: Technical Analysis, Trends & YTD Performance | |
| Technology sector is composed of stocks
from semiconductors, software, web, social media
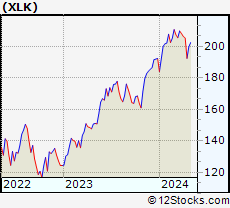
and services subsectors. Technology sector, as represented by XLK, an exchange-traded fund [ETF] that holds basket of tech stocks (e.g, Intel, Google) is up by 10.05% and is currently underperforming the overall market by -0.52% year-to-date. Below is a quick view of technical charts and trends: |
|
 XLK Weekly Chart |
|
| Long Term Trend: Very Good | |
| Medium Term Trend: Very Good | |
 XLK Daily Chart |
|
| Short Term Trend: Good | |
| Overall Trend Score: 78 | |
| YTD Performance: 10.05% | |
| **Trend Scores & Views Are Only For Educational Purposes And Not For Investing | |
| 12Stocks.com: Top Performing Technology Sector Stocks | ||||||||||||||||||||||||||||||||||||||||||||||||
 The top performing Technology sector stocks year to date are
Now, more recently, over last week, the top performing Technology sector stocks on the move are


|
||||||||||||||||||||||||||||||||||||||||||||||||
| 12Stocks.com: Investing in Tech Sector using Exchange Traded Funds | |
|
The following table shows list of key exchange traded funds (ETF) that
help investors track Tech Index. For detailed view, check out our ETF Funds section of our website. Quick View: Move mouse or cursor over ETF symbol (ticker) to view short-term technical chart and over ETF name to view long term chart. Click on ticker or stock name for detailed view. Click on to add stock symbol to your watchlist and to view watchlist. |
12Stocks.com List of ETFs that track Tech Index
| Ticker | ETF Name | Watchlist | Recent Price | Smart Investing & Trading Score | Change % | Week % | Year-to-date % |
| XLK | Technology | | 211.82 | 78 | -0.22 | 3.06 | 10.05% |
| QQQ | QQQ | | 451.76 | 78 | -0.62 | 2.19 | 10.31% |
| IYW | Technology | | 138.02 | 83 | -0.59 | 3.02 | 12.44% |
| VGT | Information Technology | | 532.55 | 78 | -1.02 | 3.16 | 10.03% |
| IXN | Global Tech | | 75.90 | 78 | -0.41 | 2.72 | 11.32% |
| IGV | Tech-Software | | 84.27 | 59 | 0.20 | 3.54 | 3.87% |
| XSD | Semiconductor | | 238.61 | 88 | 0.06 | 4.04 | 6.15% |
| TQQQ | QQQ | | 62.94 | 78 | -0.22 | 6.37 | 24.14% |
| SQQQ | Short QQQ | | 9.97 | 17 | 0.30 | -6.03 | -25.87% |
| SOXL | Semicondct Bull 3X | | 45.40 | 78 | -1.86 | 10.65 | 44.59% |
| SOXS | Semicondct Bear 3X | | 29.69 | 43 | 5.10 | -10.46 | 410.14% |
| SOXX | PHLX Semiconductor | | 228.24 | 78 | -1.68 | 3.63 | 18.85% |
| QTEC | First -100-Tech | | 190.75 | 70 | -0.78 | 3.23 | 8.71% |
| SMH | Semiconductor | | 230.25 | 78 | -0.84 | 3.11 | 31.67% |
| 12Stocks.com: Charts, Trends, Fundamental Data and Performances of Tech Stocks | |
|
We now take in-depth look at all Tech stocks including charts, multi-period performances and overall trends (as measured by Smart Investing & Trading Score). One can sort Tech stocks (click link to choose) by Daily, Weekly and by Year-to-Date performances. Also, one can sort by size of the company or by market capitalization. |
| Select Your Default Chart Type: | |||||
| |||||
| Click on stock symbol or name for detailed view. Click on to add stock symbol to your watchlist and to view watchlist. Quick View: Move mouse or cursor over "Daily" to quickly view daily technical stock chart and over "Weekly" to view weekly technical stock chart. | |||||


 | NXPI NXP Semiconductors N.V. |
| Sector: Technology | |
| SubSector: Semiconductor - Broad Line | |
| MarketCap: 22497.9 Millions | |
| Recent Price: 267.72 Smart Investing & Trading Score: 76 | |
| Day Percent Change: -0.70% Day Change: -1.89 | |
| Week Change: 2.29% Year-to-date Change: 16.6% | |
| NXPI Links: Profile News Message Board | |
| Charts:- Daily , Weekly | |
| Add NXPI to Watchlist: View: Get Complete NXPI Trend Analysis ➞ | |
 | DASH DoorDash, Inc. |
| Sector: Technology | |
| SubSector: Internet Content & Information | |
| MarketCap: 59087 Millions | |
| Recent Price: 117.43 Smart Investing & Trading Score: 39 | |
| Day Percent Change: 1.09% Day Change: 1.27 | |
| Week Change: 2.26% Year-to-date Change: 18.8% | |
| DASH Links: Profile News Message Board | |
| Charts:- Daily , Weekly | |
| Add DASH to Watchlist: View: Get Complete DASH Trend Analysis ➞ | |
 | ADP Automatic Data Processing, Inc. |
| Sector: Technology | |
| SubSector: Business Software & Services | |
| MarketCap: 54966.5 Millions | |
| Recent Price: 252.33 Smart Investing & Trading Score: 87 | |
| Day Percent Change: 0.91% Day Change: 2.27 | |
| Week Change: 2.22% Year-to-date Change: 8.3% | |
| ADP Links: Profile News Message Board | |
| Charts:- Daily , Weekly | |
| Add ADP to Watchlist: View: Get Complete ADP Trend Analysis ➞ | |
 | FDS FactSet Research Systems Inc. |
| Sector: Technology | |
| SubSector: Information & Delivery Services | |
| MarketCap: 9024.37 Millions | |
| Recent Price: 448.88 Smart Investing & Trading Score: 59 | |
| Day Percent Change: 0.75% Day Change: 3.36 | |
| Week Change: 2.21% Year-to-date Change: -5.9% | |
| FDS Links: Profile News Message Board | |
| Charts:- Daily , Weekly | |
| Add FDS to Watchlist: View: Get Complete FDS Trend Analysis ➞ | |
 | TEF Telefonica, S.A. |
| Sector: Technology | |
| SubSector: Telecom Services - Foreign | |
| MarketCap: 26698.4 Millions | |
| Recent Price: 4.46 Smart Investing & Trading Score: 68 | |
| Day Percent Change: 0.68% Day Change: 0.03 | |
| Week Change: 2.06% Year-to-date Change: 14.4% | |
| TEF Links: Profile News Message Board | |
| Charts:- Daily , Weekly | |
| Add TEF to Watchlist: View: Get Complete TEF Trend Analysis ➞ | |
 | CHT Chunghwa Telecom Co., Ltd. |
| Sector: Technology | |
| SubSector: Telecom Services - Domestic | |
| MarketCap: 28101.3 Millions | |
| Recent Price: 39.16 Smart Investing & Trading Score: 100 | |
| Day Percent Change: 0.26% Day Change: 0.10 | |
| Week Change: 1.93% Year-to-date Change: 0.2% | |
| CHT Links: Profile News Message Board | |
| Charts:- Daily , Weekly | |
| Add CHT to Watchlist: View: Get Complete CHT Trend Analysis ➞ | |
 | ANET Arista Networks, Inc. |
| Sector: Technology | |
| SubSector: Diversified Computer Systems | |
| MarketCap: 14071.2 Millions | |
| Recent Price: 319.89 Smart Investing & Trading Score: 83 | |
| Day Percent Change: -0.06% Day Change: -0.20 | |
| Week Change: 1.87% Year-to-date Change: 35.8% | |
| ANET Links: Profile News Message Board | |
| Charts:- Daily , Weekly | |
| Add ANET to Watchlist: View: Get Complete ANET Trend Analysis ➞ | |
 | RELX RELX PLC |
| Sector: Technology | |
| SubSector: Information & Delivery Services | |
| MarketCap: 36730.7 Millions | |
| Recent Price: 44.07 Smart Investing & Trading Score: 77 | |
| Day Percent Change: 0.34% Day Change: 0.15 | |
| Week Change: 1.85% Year-to-date Change: 11.1% | |
| RELX Links: Profile News Message Board | |
| Charts:- Daily , Weekly | |
| Add RELX to Watchlist: View: Get Complete RELX Trend Analysis ➞ | |
 | DNB Dun & Bradstreet Holdings, Inc. |
| Sector: Technology | |
| SubSector: Information Technology Services | |
| MarketCap: 10887 Millions | |
| Recent Price: 10.65 Smart Investing & Trading Score: 43 | |
| Day Percent Change: -0.37% Day Change: -0.04 | |
| Week Change: 1.82% Year-to-date Change: -9.0% | |
| DNB Links: Profile News Message Board | |
| Charts:- Daily , Weekly | |
| Add DNB to Watchlist: View: Get Complete DNB Trend Analysis ➞ | |
 | NTAP NetApp, Inc. |
| Sector: Technology | |
| SubSector: Data Storage Devices | |
| MarketCap: 9028.89 Millions | |
| Recent Price: 110.47 Smart Investing & Trading Score: 90 | |
| Day Percent Change: 0.66% Day Change: 0.72 | |
| Week Change: 1.82% Year-to-date Change: 25.3% | |
| NTAP Links: Profile News Message Board | |
| Charts:- Daily , Weekly | |
| Add NTAP to Watchlist: View: Get Complete NTAP Trend Analysis ➞ | |
 | LHX L3Harris Technologies, Inc. |
| Sector: Technology | |
| SubSector: Communication Equipment | |
| MarketCap: 37906.1 Millions | |
| Recent Price: 223.57 Smart Investing & Trading Score: 88 | |
| Day Percent Change: 0.67% Day Change: 1.48 | |
| Week Change: 1.82% Year-to-date Change: 6.2% | |
| LHX Links: Profile News Message Board | |
| Charts:- Daily , Weekly | |
| Add LHX to Watchlist: View: Get Complete LHX Trend Analysis ➞ | |
 | SNPS Synopsys, Inc. |
| Sector: Technology | |
| SubSector: Semiconductor Equipment & Materials | |
| MarketCap: 18273.8 Millions | |
| Recent Price: 566.73 Smart Investing & Trading Score: 47 | |
| Day Percent Change: -0.45% Day Change: -2.54 | |
| Week Change: 1.8% Year-to-date Change: 10.1% | |
| SNPS Links: Profile News Message Board | |
| Charts:- Daily , Weekly | |
| Add SNPS to Watchlist: View: Get Complete SNPS Trend Analysis ➞ | |
 | BSY Bentley Systems, Incorporated |
| Sector: Technology | |
| SubSector: Software Application | |
| MarketCap: 98687 Millions | |
| Recent Price: 56.46 Smart Investing & Trading Score: 95 | |
| Day Percent Change: 0.68% Day Change: 0.38 | |
| Week Change: 1.77% Year-to-date Change: 8.2% | |
| BSY Links: Profile News Message Board | |
| Charts:- Daily , Weekly | |
| Add BSY to Watchlist: View: Get Complete BSY Trend Analysis ➞ | |
 | BIDU Baidu, Inc. |
| Sector: Technology | |
| SubSector: Internet Information Providers | |
| MarketCap: 33525.9 Millions | |
| Recent Price: 110.58 Smart Investing & Trading Score: 83 | |
| Day Percent Change: -1.79% Day Change: -2.01 | |
| Week Change: 1.77% Year-to-date Change: -7.2% | |
| BIDU Links: Profile News Message Board | |
| Charts:- Daily , Weekly | |
| Add BIDU to Watchlist: View: Get Complete BIDU Trend Analysis ➞ | |
 | PCOR Procore Technologies, Inc. |
| Sector: Technology | |
| SubSector: Software - Application | |
| MarketCap: 9180 Millions | |
| Recent Price: 69.46 Smart Investing & Trading Score: 42 | |
| Day Percent Change: 0.33% Day Change: 0.23 | |
| Week Change: 1.7% Year-to-date Change: -0.6% | |
| PCOR Links: Profile News Message Board | |
| Charts:- Daily , Weekly | |
| Add PCOR to Watchlist: View: Get Complete PCOR Trend Analysis ➞ | |
 | MTCH Match Group, Inc. |
| Sector: Technology | |
| SubSector: Internet Information Providers | |
| MarketCap: 14655.8 Millions | |
| Recent Price: 31.21 Smart Investing & Trading Score: 27 | |
| Day Percent Change: -0.48% Day Change: -0.15 | |
| Week Change: 1.69% Year-to-date Change: -14.5% | |
| MTCH Links: Profile News Message Board | |
| Charts:- Daily , Weekly | |
| Add MTCH to Watchlist: View: Get Complete MTCH Trend Analysis ➞ | |
 | NFLX Netflix, Inc. |
| Sector: Technology | |
| SubSector: CATV Systems | |
| MarketCap: 162108 Millions | |
| Recent Price: 621.10 Smart Investing & Trading Score: 90 | |
| Day Percent Change: 1.73% Day Change: 10.58 | |
| Week Change: 1.67% Year-to-date Change: 27.6% | |
| NFLX Links: Profile News Message Board | |
| Charts:- Daily , Weekly | |
| Add NFLX to Watchlist: View: Get Complete NFLX Trend Analysis ➞ | |
 | TSM Taiwan Semiconductor Manufacturing Company Limited |
| Sector: Technology | |
| SubSector: Semiconductor - Integrated Circuits | |
| MarketCap: 239384 Millions | |
| Recent Price: 151.68 Smart Investing & Trading Score: 76 | |
| Day Percent Change: -0.36% Day Change: -0.55 | |
| Week Change: 1.62% Year-to-date Change: 45.9% | |
| TSM Links: Profile News Message Board | |
| Charts:- Daily , Weekly | |
| Add TSM to Watchlist: View: Get Complete TSM Trend Analysis ➞ | |
 | LBRDA Liberty Broadband Corporation |
| Sector: Technology | |
| SubSector: CATV Systems | |
| MarketCap: 17001.5 Millions | |
| Recent Price: 53.68 Smart Investing & Trading Score: 50 | |
| Day Percent Change: -1.11% Day Change: -0.60 | |
| Week Change: 1.59% Year-to-date Change: -33.4% | |
| LBRDA Links: Profile News Message Board | |
| Charts:- Daily , Weekly | |
| Add LBRDA to Watchlist: View: Get Complete LBRDA Trend Analysis ➞ | |
 | ADSK Autodesk, Inc. |
| Sector: Technology | |
| SubSector: Technical & System Software | |
| MarketCap: 36975.8 Millions | |
| Recent Price: 221.21 Smart Investing & Trading Score: 59 | |
| Day Percent Change: 0.35% Day Change: 0.78 | |
| Week Change: 1.58% Year-to-date Change: -9.2% | |
| ADSK Links: Profile News Message Board | |
| Charts:- Daily , Weekly | |
| Add ADSK to Watchlist: View: Get Complete ADSK Trend Analysis ➞ | |
 | SWKS Skyworks Solutions, Inc. |
| Sector: Technology | |
| SubSector: Semiconductor - Integrated Circuits | |
| MarketCap: 13981 Millions | |
| Recent Price: 93.62 Smart Investing & Trading Score: 27 | |
| Day Percent Change: -0.50% Day Change: -0.47 | |
| Week Change: 1.54% Year-to-date Change: -16.7% | |
| SWKS Links: Profile News Message Board | |
| Charts:- Daily , Weekly | |
| Add SWKS to Watchlist: View: Get Complete SWKS Trend Analysis ➞ | |
 | INFY Infosys Limited |
| Sector: Technology | |
| SubSector: Information Technology Services | |
| MarketCap: 33819.1 Millions | |
| Recent Price: 17.13 Smart Investing & Trading Score: 52 | |
| Day Percent Change: -0.64% Day Change: -0.11 | |
| Week Change: 1.54% Year-to-date Change: -6.8% | |
| INFY Links: Profile News Message Board | |
| Charts:- Daily , Weekly | |
| Add INFY to Watchlist: View: Get Complete INFY Trend Analysis ➞ | |
 | SAP SAP SE |
| Sector: Technology | |
| SubSector: Application Software | |
| MarketCap: 129635 Millions | |
| Recent Price: 192.80 Smart Investing & Trading Score: 90 | |
| Day Percent Change: 1.12% Day Change: 2.13 | |
| Week Change: 1.45% Year-to-date Change: 24.7% | |
| SAP Links: Profile News Message Board | |
| Charts:- Daily , Weekly | |
| Add SAP to Watchlist: View: Get Complete SAP Trend Analysis ➞ | |
 | MSI Motorola Solutions, Inc. |
| Sector: Technology | |
| SubSector: Communication Equipment | |
| MarketCap: 26573.3 Millions | |
| Recent Price: 367.80 Smart Investing & Trading Score: 95 | |
| Day Percent Change: 0.38% Day Change: 1.39 | |
| Week Change: 1.36% Year-to-date Change: 17.5% | |
| MSI Links: Profile News Message Board | |
| Charts:- Daily , Weekly | |
| Add MSI to Watchlist: View: Get Complete MSI Trend Analysis ➞ | |
 | T AT&T Inc. |
| Sector: Technology | |
| SubSector: Telecom Services - Domestic | |
| MarketCap: 224847 Millions | |
| Recent Price: 17.40 Smart Investing & Trading Score: 83 | |
| Day Percent Change: 0.58% Day Change: 0.10 | |
| Week Change: 1.34% Year-to-date Change: 3.7% | |
| T Links: Profile News Message Board | |
| Charts:- Daily , Weekly | |
| Add T to Watchlist: View: Get Complete T Trend Analysis ➞ | |
| For tabular summary view of above stock list: Summary View ➞ 0 - 25 , 25 - 50 , 50 - 75 , 75 - 100 , 100 - 125 , 125 - 150 , 150 - 175 , 175 - 200 | ||
| Click To Change The Sort Order: By Market Cap or Company Size Performance: Year-to-date, Week and Day | |
| Select Chart Type: | ||
|
Best Stocks Today 12Stocks.com |
© 2024 12Stocks.com Terms & Conditions Privacy Contact Us
All Information Provided Only For Education And Not To Be Used For Investing or Trading. See Terms & Conditions


One More Thing ... Get Best Stocks Delivered Daily!
Never Ever Miss A Move With Our Top Ten Stocks Lists
Find Best Stocks In Any Market - Bull or Bear Market
Take A Peek At Our Top Ten Stocks Lists: Daily, Weekly, Year-to-Date & Top Trends
Find Best Stocks In Any Market - Bull or Bear Market
Take A Peek At Our Top Ten Stocks Lists: Daily, Weekly, Year-to-Date & Top Trends
Technology Stocks With Best Up Trends [0-bearish to 100-bullish]: Robinhood Markets[100], CommScope Holding[100], MicroStrategy [100], Full Truck[100], Sea [100], GDS [100], JD.com [100], UP Fintech[100], Bilibili [100], Turkcell Iletisim[100], EverCommerce [100]
Best Technology Stocks Year-to-Date:
MicroCloud Hologram[495.68%], Bakkt [413.9%], Uxin [355.06%], Smith Micro[229.3%], MediaCo Holding[223.94%], Super Micro[212.35%], MicroStrategy [150.86%], CXApp [136.29%], SoundHound AI[135.98%], AppLovin [107.29%], Cheetah Mobile[101.32%] Best Technology Stocks This Week:
Maxeon Solar[35.94%], MicroStrategy [34.23%], Presto Automation[29.52%], on [29.45%], LivePerson [27.75%], Viomi [27.4%], Uxin [27.09%], monday.com [25.9%], CommScope Holding[25.71%], SunPower [23.91%], Robinhood Markets[23.78%] Best Technology Stocks Daily:
Presto Automation[31.90%], Robinhood Markets[12.23%], CommScope Holding[11.86%], Ouster [11.23%], Arqit Quantum[10.89%], 36Kr [10.41%], Cheetah Mobile[10.34%], MicroStrategy [10.04%], Bakkt [9.25%], Amesite [8.96%], MicroCloud Hologram[8.38%]