
 Login Sign Up


| |||||
 |  | ||||

| 12Stocks.com Market Intelligence |
Best Tech Stocks
| In a hurry? Tech Stocks Lists: Performance & Trends, Stock Charts, FANG Stocks
Sort Tech stocks: Daily, Weekly, Year-to-Date, Market Cap & Trends. Filter Tech stocks list by size:All Tech Large Mid-Range Small and MicroCap |
| 12Stocks.com Tech Stocks Performances & Trends Daily | |||||||||
|
|  The overall Smart Investing & Trading Score is 78 (0-bearish to 100-bullish) which puts Technology sector in short term neutral to bullish trend. The Smart Investing & Trading Score from previous trading session is 90 and hence a deterioration of trend.
| ||||||||
Here are the Smart Investing & Trading Scores of the most requested Technology stocks at 12Stocks.com (click stock name for detailed review):
|


| 12Stocks.com: Investing in Technology sector with Stocks | |
|
The following table helps investors and traders sort through current performance and trends (as measured by Smart Investing & Trading Score) of various
stocks in the Tech sector. Quick View: Move mouse or cursor over stock symbol (ticker) to view short-term technical chart and over stock name to view long term chart. Click on  to add stock symbol to your watchlist and to add stock symbol to your watchlist and  to view watchlist. Click on any ticker or stock name for detailed market intelligence report for that stock. to view watchlist. Click on any ticker or stock name for detailed market intelligence report for that stock. |
12Stocks.com Performance of Stocks in Tech Sector
| Ticker | Stock Name | Watchlist | Category | Recent Price | Smart Investing & Trading Score | Change % | Weekly Change% |
| OTEX | Open Text |   | Software | 30.48 | 28 | -0.65% | 0.43% |
| FTV | Fortive | | Instruments | 77.16 | 45 | -0.22% | 0.36% |
| FROG | JFrog | | Software | 33.10 | 18 | 0.64% | 0.27% |
| SNAP | Snap | | Internet | 16.05 | 83 | 0.19% | 0.25% |
| ADBE | Adobe | | Software | 483.43 | 47 | 0.11% | 0.24% |
| CSCO | Cisco Systems | | Communication | 48.17 | 38 | -0.35% | 0.23% |
| IAC | IAC/InterActiveCorp | | Internet | 55.17 | 42 | -3.24% | 0.18% |
| WB | | Internet | 9.66 | 83 | -3.78% | 0.16% | |
| ASX | ASE | | Semiconductor | 10.52 | 61 | 0.19% | 0.00% |
| TEAM | Atlassian | | IT | 179.72 | 37 | -1.37% | -0.02% |
| U | Unity Software | | Software | 21.67 | 10 | -1.90% | -0.09% |
| TMUS | T-Mobile US | | Wireless | 164.00 | 70 | 0.26% | -0.12% |
| JKHY | Jack Henry | | IT | 168.99 | 62 | -0.23% | -0.15% |
| ANSS | ANSYS | | Software | 327.71 | 25 | 0.05% | -0.16% |
| VRSN | VeriSign | | Internet | 170.75 | 42 | -0.12% | -0.28% |
| CHKP | Check Point | | Security Software | 151.13 | 50 | 0.02% | -0.29% |
| MSGE | Madison Square | | Entertainment | 37.08 | 42 | 0.08% | -0.35% |
| LRCX | Lam Research | | Semiconductor | 912.07 | 15 | -3.27% | -0.37% |
| ABNB | Airbnb | | Internet Content & Information | 145.66 | 18 | -1.04% | -0.45% |
| ASML | ASML Holding | | Semiconductor | 924.97 | 40 | 0.59% | -0.57% |
| SHOP | Shopify | | Software | 58.53 | 18 | 1.25% | -0.70% |
| VZ | Verizon | | Telecom | 40.06 | 50 | -0.47% | -0.84% |
| ACN | Accenture | | IT | 303.59 | 10 | -1.43% | -0.89% |
| META | Meta Platforms | | Internet Content & Information | 471.91 | 33 | -0.28% | -0.90% |
| CHTR | Charter | | CATV | 273.02 | 39 | -1.63% | -0.92% |
| For chart view version of above stock list: Chart View ➞ 0 - 25 , 25 - 50 , 50 - 75 , 75 - 100 , 100 - 125 , 125 - 150 , 150 - 175 , 175 - 200 | ||
 | Click To Change The Sort Order: By Market Cap or Company Size Performance: Year-to-date, Week and Day |  |
|
Get the most comprehensive stock market coverage daily at 12Stocks.com ➞ Best Stocks Today ➞ Best Stocks Weekly ➞ Best Stocks Year-to-Date ➞ Best Stocks Trends ➞  Best Stocks Today 12Stocks.com Best Nasdaq Stocks ➞ Best S&P 500 Stocks ➞ Best Tech Stocks ➞ Best Biotech Stocks ➞ |
| Detailed Overview of Tech Stocks |
| Tech Technical Overview, Leaders & Laggards, Top Tech ETF Funds & Detailed Tech Stocks List, Charts, Trends & More |
| Tech Sector: Technical Analysis, Trends & YTD Performance | |
| Technology sector is composed of stocks
from semiconductors, software, web, social media
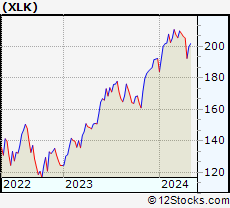
and services subsectors. Technology sector, as represented by XLK, an exchange-traded fund [ETF] that holds basket of tech stocks (e.g, Intel, Google) is up by 10.05% and is currently underperforming the overall market by -0.52% year-to-date. Below is a quick view of technical charts and trends: |
|
 XLK Weekly Chart |
|
| Long Term Trend: Very Good | |
| Medium Term Trend: Very Good | |
 XLK Daily Chart |
|
| Short Term Trend: Good | |
| Overall Trend Score: 78 | |
| YTD Performance: 10.05% | |
| **Trend Scores & Views Are Only For Educational Purposes And Not For Investing | |
| 12Stocks.com: Top Performing Technology Sector Stocks | ||||||||||||||||||||||||||||||||||||||||||||||||
 The top performing Technology sector stocks year to date are
Now, more recently, over last week, the top performing Technology sector stocks on the move are


|
||||||||||||||||||||||||||||||||||||||||||||||||
| 12Stocks.com: Investing in Tech Sector using Exchange Traded Funds | |
|
The following table shows list of key exchange traded funds (ETF) that
help investors track Tech Index. For detailed view, check out our ETF Funds section of our website. Quick View: Move mouse or cursor over ETF symbol (ticker) to view short-term technical chart and over ETF name to view long term chart. Click on ticker or stock name for detailed view. Click on to add stock symbol to your watchlist and to view watchlist. |
12Stocks.com List of ETFs that track Tech Index
| Ticker | ETF Name | Watchlist | Recent Price | Smart Investing & Trading Score | Change % | Week % | Year-to-date % |
| XLK | Technology | | 211.82 | 78 | -0.22 | 3.06 | 10.05% |
| QQQ | QQQ | | 451.76 | 78 | -0.62 | 2.19 | 10.31% |
| IYW | Technology | | 138.02 | 83 | -0.59 | 3.02 | 12.44% |
| VGT | Information Technology | | 532.55 | 78 | -1.02 | 3.16 | 10.03% |
| IXN | Global Tech | | 75.90 | 78 | -0.41 | 2.72 | 11.32% |
| IGV | Tech-Software | | 84.27 | 59 | 0.20 | 3.54 | 3.87% |
| XSD | Semiconductor | | 238.61 | 88 | 0.06 | 4.04 | 6.15% |
| TQQQ | QQQ | | 62.94 | 78 | -0.22 | 6.37 | 24.14% |
| SQQQ | Short QQQ | | 9.97 | 17 | 0.30 | -6.03 | -25.87% |
| SOXL | Semicondct Bull 3X | | 45.40 | 78 | -1.86 | 10.65 | 44.59% |
| SOXS | Semicondct Bear 3X | | 29.69 | 43 | 5.10 | -10.46 | 410.14% |
| SOXX | PHLX Semiconductor | | 228.24 | 78 | -1.68 | 3.63 | 18.85% |
| QTEC | First -100-Tech | | 190.75 | 70 | -0.78 | 3.23 | 8.71% |
| SMH | Semiconductor | | 230.25 | 78 | -0.84 | 3.11 | 31.67% |
| 12Stocks.com: Charts, Trends, Fundamental Data and Performances of Tech Stocks | |
|
We now take in-depth look at all Tech stocks including charts, multi-period performances and overall trends (as measured by Smart Investing & Trading Score). One can sort Tech stocks (click link to choose) by Daily, Weekly and by Year-to-Date performances. Also, one can sort by size of the company or by market capitalization. |
| Select Your Default Chart Type: | |||||
| |||||
| Click on stock symbol or name for detailed view. Click on to add stock symbol to your watchlist and to view watchlist. Quick View: Move mouse or cursor over "Daily" to quickly view daily technical stock chart and over "Weekly" to view weekly technical stock chart. | |||||


 | OTEX Open Text Corporation |
| Sector: Technology | |
| SubSector: Application Software | |
| MarketCap: 9291.92 Millions | |
| Recent Price: 30.48 Smart Investing & Trading Score: 28 | |
| Day Percent Change: -0.65% Day Change: -0.20 | |
| Week Change: 0.43% Year-to-date Change: -27.5% | |
| OTEX Links: Profile News Message Board | |
| Charts:- Daily , Weekly | |
| Add OTEX to Watchlist: View: Get Complete OTEX Trend Analysis ➞ | |
 | FTV Fortive Corporation |
| Sector: Technology | |
| SubSector: Scientific & Technical Instruments | |
| MarketCap: 16351.9 Millions | |
| Recent Price: 77.16 Smart Investing & Trading Score: 45 | |
| Day Percent Change: -0.22% Day Change: -0.17 | |
| Week Change: 0.36% Year-to-date Change: 4.8% | |
| FTV Links: Profile News Message Board | |
| Charts:- Daily , Weekly | |
| Add FTV to Watchlist: View: Get Complete FTV Trend Analysis ➞ | |
 | FROG JFrog Ltd. |
| Sector: Technology | |
| SubSector: Software Application | |
| MarketCap: 62287 Millions | |
| Recent Price: 33.10 Smart Investing & Trading Score: 18 | |
| Day Percent Change: 0.64% Day Change: 0.21 | |
| Week Change: 0.27% Year-to-date Change: -4.4% | |
| FROG Links: Profile News Message Board | |
| Charts:- Daily , Weekly | |
| Add FROG to Watchlist: View: Get Complete FROG Trend Analysis ➞ | |
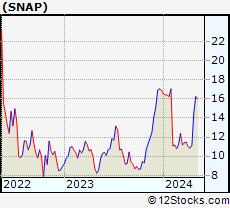 | SNAP Snap Inc. |
| Sector: Technology | |
| SubSector: Internet Software & Services | |
| MarketCap: 14866.1 Millions | |
| Recent Price: 16.05 Smart Investing & Trading Score: 83 | |
| Day Percent Change: 0.19% Day Change: 0.03 | |
| Week Change: 0.25% Year-to-date Change: -5.2% | |
| SNAP Links: Profile News Message Board | |
| Charts:- Daily , Weekly | |
| Add SNAP to Watchlist: View: Get Complete SNAP Trend Analysis ➞ | |
 | ADBE Adobe Inc. |
| Sector: Technology | |
| SubSector: Application Software | |
| MarketCap: 157868 Millions | |
| Recent Price: 483.43 Smart Investing & Trading Score: 47 | |
| Day Percent Change: 0.11% Day Change: 0.55 | |
| Week Change: 0.24% Year-to-date Change: -19.0% | |
| ADBE Links: Profile News Message Board | |
| Charts:- Daily , Weekly | |
| Add ADBE to Watchlist: View: Get Complete ADBE Trend Analysis ➞ | |
 | CSCO Cisco Systems, Inc. |
| Sector: Technology | |
| SubSector: Communication Equipment | |
| MarketCap: 168483 Millions | |
| Recent Price: 48.17 Smart Investing & Trading Score: 38 | |
| Day Percent Change: -0.35% Day Change: -0.17 | |
| Week Change: 0.23% Year-to-date Change: -4.7% | |
| CSCO Links: Profile News Message Board | |
| Charts:- Daily , Weekly | |
| Add CSCO to Watchlist: View: Get Complete CSCO Trend Analysis ➞ | |
 | IAC IAC/InterActiveCorp |
| Sector: Technology | |
| SubSector: Internet Information Providers | |
| MarketCap: 12561.2 Millions | |
| Recent Price: 55.17 Smart Investing & Trading Score: 42 | |
| Day Percent Change: -3.24% Day Change: -1.85 | |
| Week Change: 0.18% Year-to-date Change: 5.3% | |
| IAC Links: Profile News Message Board | |
| Charts:- Daily , Weekly | |
| Add IAC to Watchlist: View: Get Complete IAC Trend Analysis ➞ | |
 | WB Weibo Corporation |
| Sector: Technology | |
| SubSector: Internet Information Providers | |
| MarketCap: 8164.6 Millions | |
| Recent Price: 9.66 Smart Investing & Trading Score: 83 | |
| Day Percent Change: -3.78% Day Change: -0.38 | |
| Week Change: 0.16% Year-to-date Change: -11.8% | |
| WB Links: Profile News Message Board | |
| Charts:- Daily , Weekly | |
| Add WB to Watchlist: View: Get Complete WB Trend Analysis ➞ | |
 | ASX ASE Technology Holding Co., Ltd. |
| Sector: Technology | |
| SubSector: Semiconductor Equipment & Materials | |
| MarketCap: 8513.18 Millions | |
| Recent Price: 10.52 Smart Investing & Trading Score: 61 | |
| Day Percent Change: 0.19% Day Change: 0.02 | |
| Week Change: 0% Year-to-date Change: 11.8% | |
| ASX Links: Profile News Message Board | |
| Charts:- Daily , Weekly | |
| Add ASX to Watchlist: View: Get Complete ASX Trend Analysis ➞ | |
 | TEAM Atlassian Corporation Plc |
| Sector: Technology | |
| SubSector: Information Technology Services | |
| MarketCap: 32265.7 Millions | |
| Recent Price: 179.72 Smart Investing & Trading Score: 37 | |
| Day Percent Change: -1.37% Day Change: -2.49 | |
| Week Change: -0.02% Year-to-date Change: -24.4% | |
| TEAM Links: Profile News Message Board | |
| Charts:- Daily , Weekly | |
| Add TEAM to Watchlist: View: Get Complete TEAM Trend Analysis ➞ | |
 | U Unity Software Inc. |
| Sector: Technology | |
| SubSector: Software Application | |
| MarketCap: 42837 Millions | |
| Recent Price: 21.67 Smart Investing & Trading Score: 10 | |
| Day Percent Change: -1.90% Day Change: -0.42 | |
| Week Change: -0.09% Year-to-date Change: -47.0% | |
| U Links: Profile News Message Board | |
| Charts:- Daily , Weekly | |
| Add U to Watchlist: View: Get Complete U Trend Analysis ➞ | |
 | TMUS T-Mobile US, Inc. |
| Sector: Technology | |
| SubSector: Wireless Communications | |
| MarketCap: 71949 Millions | |
| Recent Price: 164.00 Smart Investing & Trading Score: 70 | |
| Day Percent Change: 0.26% Day Change: 0.42 | |
| Week Change: -0.12% Year-to-date Change: 2.3% | |
| TMUS Links: Profile News Message Board | |
| Charts:- Daily , Weekly | |
| Add TMUS to Watchlist: View: Get Complete TMUS Trend Analysis ➞ | |
 | JKHY Jack Henry & Associates, Inc. |
| Sector: Technology | |
| SubSector: Information Technology Services | |
| MarketCap: 10695.4 Millions | |
| Recent Price: 168.99 Smart Investing & Trading Score: 62 | |
| Day Percent Change: -0.23% Day Change: -0.39 | |
| Week Change: -0.15% Year-to-date Change: 3.4% | |
| JKHY Links: Profile News Message Board | |
| Charts:- Daily , Weekly | |
| Add JKHY to Watchlist: View: Get Complete JKHY Trend Analysis ➞ | |
 | ANSS ANSYS, Inc. |
| Sector: Technology | |
| SubSector: Application Software | |
| MarketCap: 19497.4 Millions | |
| Recent Price: 327.71 Smart Investing & Trading Score: 25 | |
| Day Percent Change: 0.05% Day Change: 0.18 | |
| Week Change: -0.16% Year-to-date Change: -9.7% | |
| ANSS Links: Profile News Message Board | |
| Charts:- Daily , Weekly | |
| Add ANSS to Watchlist: View: Get Complete ANSS Trend Analysis ➞ | |
 | VRSN VeriSign, Inc. |
| Sector: Technology | |
| SubSector: Internet Information Providers | |
| MarketCap: 19657 Millions | |
| Recent Price: 170.75 Smart Investing & Trading Score: 42 | |
| Day Percent Change: -0.12% Day Change: -0.21 | |
| Week Change: -0.28% Year-to-date Change: -17.1% | |
| VRSN Links: Profile News Message Board | |
| Charts:- Daily , Weekly | |
| Add VRSN to Watchlist: View: Get Complete VRSN Trend Analysis ➞ | |
 | CHKP Check Point Software Technologies Ltd. |
| Sector: Technology | |
| SubSector: Security Software & Services | |
| MarketCap: 15112.2 Millions | |
| Recent Price: 151.13 Smart Investing & Trading Score: 50 | |
| Day Percent Change: 0.02% Day Change: 0.03 | |
| Week Change: -0.29% Year-to-date Change: -1.1% | |
| CHKP Links: Profile News Message Board | |
| Charts:- Daily , Weekly | |
| Add CHKP to Watchlist: View: Get Complete CHKP Trend Analysis ➞ | |
 | MSGE Madison Square Garden Entertainment Corp. |
| Sector: Technology | |
| SubSector: Entertainment | |
| MarketCap: 18837 Millions | |
| Recent Price: 37.08 Smart Investing & Trading Score: 42 | |
| Day Percent Change: 0.08% Day Change: 0.03 | |
| Week Change: -0.35% Year-to-date Change: 16.6% | |
| MSGE Links: Profile News Message Board | |
| Charts:- Daily , Weekly | |
| Add MSGE to Watchlist: View: Get Complete MSGE Trend Analysis ➞ | |
 | LRCX Lam Research Corporation |
| Sector: Technology | |
| SubSector: Semiconductor Equipment & Materials | |
| MarketCap: 31806 Millions | |
| Recent Price: 912.07 Smart Investing & Trading Score: 15 | |
| Day Percent Change: -3.27% Day Change: -30.83 | |
| Week Change: -0.37% Year-to-date Change: 16.5% | |
| LRCX Links: Profile News Message Board | |
| Charts:- Daily , Weekly | |
| Add LRCX to Watchlist: View: Get Complete LRCX Trend Analysis ➞ | |
 | ABNB Airbnb, Inc. |
| Sector: Technology | |
| SubSector: Internet Content & Information | |
| MarketCap: 86237 Millions | |
| Recent Price: 145.66 Smart Investing & Trading Score: 18 | |
| Day Percent Change: -1.04% Day Change: -1.53 | |
| Week Change: -0.45% Year-to-date Change: 7.0% | |
| ABNB Links: Profile News Message Board | |
| Charts:- Daily , Weekly | |
| Add ABNB to Watchlist: View: Get Complete ABNB Trend Analysis ➞ | |
 | ASML ASML Holding N.V. |
| Sector: Technology | |
| SubSector: Semiconductor Equipment & Materials | |
| MarketCap: 102565 Millions | |
| Recent Price: 924.97 Smart Investing & Trading Score: 40 | |
| Day Percent Change: 0.59% Day Change: 5.43 | |
| Week Change: -0.57% Year-to-date Change: 22.2% | |
| ASML Links: Profile News Message Board | |
| Charts:- Daily , Weekly | |
| Add ASML to Watchlist: View: Get Complete ASML Trend Analysis ➞ | |
 | SHOP Shopify Inc. |
| Sector: Technology | |
| SubSector: Application Software | |
| MarketCap: 45164.2 Millions | |
| Recent Price: 58.53 Smart Investing & Trading Score: 18 | |
| Day Percent Change: 1.25% Day Change: 0.72 | |
| Week Change: -0.7% Year-to-date Change: -24.9% | |
| SHOP Links: Profile News Message Board | |
| Charts:- Daily , Weekly | |
| Add SHOP to Watchlist: View: Get Complete SHOP Trend Analysis ➞ | |
 | VZ Verizon Communications Inc. |
| Sector: Technology | |
| SubSector: Telecom Services - Domestic | |
| MarketCap: 229427 Millions | |
| Recent Price: 40.06 Smart Investing & Trading Score: 50 | |
| Day Percent Change: -0.47% Day Change: -0.19 | |
| Week Change: -0.84% Year-to-date Change: 6.3% | |
| VZ Links: Profile News Message Board | |
| Charts:- Daily , Weekly | |
| Add VZ to Watchlist: View: Get Complete VZ Trend Analysis ➞ | |
 | ACN Accenture plc |
| Sector: Technology | |
| SubSector: Information Technology Services | |
| MarketCap: 106627 Millions | |
| Recent Price: 303.59 Smart Investing & Trading Score: 10 | |
| Day Percent Change: -1.43% Day Change: -4.41 | |
| Week Change: -0.89% Year-to-date Change: -13.5% | |
| ACN Links: Profile News Message Board | |
| Charts:- Daily , Weekly | |
| Add ACN to Watchlist: View: Get Complete ACN Trend Analysis ➞ | |
 | META Meta Platforms, Inc. |
| Sector: Technology | |
| SubSector: Internet Content & Information | |
| MarketCap: 732990 Millions | |
| Recent Price: 471.91 Smart Investing & Trading Score: 33 | |
| Day Percent Change: -0.28% Day Change: -1.32 | |
| Week Change: -0.9% Year-to-date Change: 33.3% | |
| META Links: Profile News Message Board | |
| Charts:- Daily , Weekly | |
| Add META to Watchlist: View: Get Complete META Trend Analysis ➞ | |
 | CHTR Charter Communications, Inc. |
| Sector: Technology | |
| SubSector: CATV Systems | |
| MarketCap: 82268.3 Millions | |
| Recent Price: 273.02 Smart Investing & Trading Score: 39 | |
| Day Percent Change: -1.63% Day Change: -4.52 | |
| Week Change: -0.92% Year-to-date Change: -29.8% | |
| CHTR Links: Profile News Message Board | |
| Charts:- Daily , Weekly | |
| Add CHTR to Watchlist: View: Get Complete CHTR Trend Analysis ➞ | |
| For tabular summary view of above stock list: Summary View ➞ 0 - 25 , 25 - 50 , 50 - 75 , 75 - 100 , 100 - 125 , 125 - 150 , 150 - 175 , 175 - 200 | ||
| Click To Change The Sort Order: By Market Cap or Company Size Performance: Year-to-date, Week and Day | |
| Select Chart Type: | ||
|
Best Stocks Today 12Stocks.com |
© 2024 12Stocks.com Terms & Conditions Privacy Contact Us
All Information Provided Only For Education And Not To Be Used For Investing or Trading. See Terms & Conditions


One More Thing ... Get Best Stocks Delivered Daily!
Never Ever Miss A Move With Our Top Ten Stocks Lists
Find Best Stocks In Any Market - Bull or Bear Market
Take A Peek At Our Top Ten Stocks Lists: Daily, Weekly, Year-to-Date & Top Trends
Find Best Stocks In Any Market - Bull or Bear Market
Take A Peek At Our Top Ten Stocks Lists: Daily, Weekly, Year-to-Date & Top Trends
Technology Stocks With Best Up Trends [0-bearish to 100-bullish]: Robinhood Markets[100], CommScope Holding[100], MicroStrategy [100], Full Truck[100], Sea [100], GDS [100], JD.com [100], UP Fintech[100], Bilibili [100], Turkcell Iletisim[100], EverCommerce [100]
Best Technology Stocks Year-to-Date:
MicroCloud Hologram[495.68%], Bakkt [413.9%], Uxin [355.06%], Smith Micro[229.3%], MediaCo Holding[223.94%], Super Micro[212.35%], MicroStrategy [150.86%], CXApp [136.29%], SoundHound AI[135.98%], AppLovin [107.29%], Cheetah Mobile[101.32%] Best Technology Stocks This Week:
Maxeon Solar[35.94%], MicroStrategy [34.23%], Presto Automation[29.52%], on [29.45%], LivePerson [27.75%], Viomi [27.4%], Uxin [27.09%], monday.com [25.9%], CommScope Holding[25.71%], SunPower [23.91%], Robinhood Markets[23.78%] Best Technology Stocks Daily:
Presto Automation[31.90%], Robinhood Markets[12.23%], CommScope Holding[11.86%], Ouster [11.23%], Arqit Quantum[10.89%], 36Kr [10.41%], Cheetah Mobile[10.34%], MicroStrategy [10.04%], Bakkt [9.25%], Amesite [8.96%], MicroCloud Hologram[8.38%]