
 Login Sign Up


| |||||
 |  | ||||

| 12Stocks.com Market Intelligence |
Best Tech Stocks
| In a hurry? Tech Stocks Lists: Performance & Trends, Stock Charts, FANG Stocks
Sort Tech stocks: Daily, Weekly, Year-to-Date, Market Cap & Trends. Filter Tech stocks list by size:All Tech Large Mid-Range Small and MicroCap |
| 12Stocks.com Tech Stocks Performances & Trends Daily | |||||||||
|
|  The overall Smart Investing & Trading Score is 78 (0-bearish to 100-bullish) which puts Technology sector in short term neutral to bullish trend. The Smart Investing & Trading Score from previous trading session is 90 and hence a deterioration of trend.
| ||||||||
Here are the Smart Investing & Trading Scores of the most requested Technology stocks at 12Stocks.com (click stock name for detailed review):
|


| 12Stocks.com: Investing in Technology sector with Stocks | |
|
The following table helps investors and traders sort through current performance and trends (as measured by Smart Investing & Trading Score) of various
stocks in the Tech sector. Quick View: Move mouse or cursor over stock symbol (ticker) to view short-term technical chart and over stock name to view long term chart. Click on  to add stock symbol to your watchlist and to add stock symbol to your watchlist and  to view watchlist. Click on any ticker or stock name for detailed market intelligence report for that stock. to view watchlist. Click on any ticker or stock name for detailed market intelligence report for that stock. |
12Stocks.com Performance of Stocks in Tech Sector
| Ticker | Stock Name | Watchlist | Category | Recent Price | Smart Investing & Trading Score | Change % | Weekly Change% |
| AAPL | Apple |   | Electronic | 189.87 | 83 | 0.05% | 3.73% |
| GLW | Corning | | Electronics | 35.35 | 90 | 0.37% | 3.45% |
| APH | Amphenol | | Electronics | 131.91 | 83 | 0.15% | 3.40% |
| CCI | Crown Castle | | Communication | 102.89 | 57 | -1.09% | 3.40% |
| MU | Micron | | Semiconductor- | 125.29 | 71 | -2.03% | 3.34% |
| ADI | Analog Devices | | Semiconductor | 214.08 | 83 | -0.02% | 3.33% |
| TEL | TE Connectivity | | Electronics | 151.01 | 88 | -0.05% | 3.30% |
| TDY | Teledyne | | Instruments | 406.43 | 64 | 1.04% | 3.29% |
| TWLO | Twilio | | Software | 62.08 | 69 | 0.88% | 3.29% |
| WIMI | WiMi Hologram | | Advertising Agencies | 0.96 | 22 | 0.22% | 3.24% |
| CRM | salesforce.com | | Software | 285.61 | 52 | 0.33% | 3.23% |
| TU | TELUS | | Wireless | 16.62 | 74 | 0.97% | 3.23% |
| VEEV | Veeva Systems | | Healthcare Information | 210.27 | 52 | 0.30% | 3.18% |
| MCHP | Microchip | | Semiconductor | 94.33 | 76 | 0.10% | 3.09% |
| SNOW | Snowflake | | Software | 161.86 | 40 | -1.93% | 3.00% |
| ORAN | Orange S.A | | Telecom | 11.69 | 90 | -0.17% | 3.00% |
| VERX | Vertex | | Software | 32.63 | 69 | 1.02% | 2.93% |
| NVDA | NVIDIA | | Semiconductor | 924.79 | 78 | -1.99% | 2.89% |
| NCNO | nCino | | Software | 31.99 | 83 | 0.38% | 2.83% |
| STM | STMicroelectronics N.V | | Semiconductor | 41.64 | 32 | -0.69% | 2.79% |
| GIB | CGI | | IT | 105.14 | 64 | 0.69% | 2.74% |
| CTSH | Cognizant | | IT | 68.76 | 47 | -2.23% | 2.66% |
| IOT | Samsara | | Software - Infrastructure | 40.90 | 83 | 0.69% | 2.66% |
| ZI | ZoomInfo | | Software | 13.09 | 28 | -3.82% | 2.59% |
| EPAM | EPAM Systems | | IT | 187.80 | 18 | -0.71% | 2.40% |
| For chart view version of above stock list: Chart View ➞ 0 - 25 , 25 - 50 , 50 - 75 , 75 - 100 , 100 - 125 , 125 - 150 , 150 - 175 , 175 - 200 | ||
 | Click To Change The Sort Order: By Market Cap or Company Size Performance: Year-to-date, Week and Day |  |
|
Get the most comprehensive stock market coverage daily at 12Stocks.com ➞ Best Stocks Today ➞ Best Stocks Weekly ➞ Best Stocks Year-to-Date ➞ Best Stocks Trends ➞  Best Stocks Today 12Stocks.com Best Nasdaq Stocks ➞ Best S&P 500 Stocks ➞ Best Tech Stocks ➞ Best Biotech Stocks ➞ |
| Detailed Overview of Tech Stocks |
| Tech Technical Overview, Leaders & Laggards, Top Tech ETF Funds & Detailed Tech Stocks List, Charts, Trends & More |
| Tech Sector: Technical Analysis, Trends & YTD Performance | |
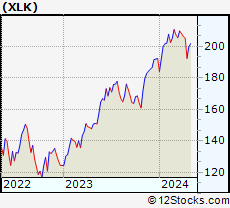
| Technology sector is composed of stocks
from semiconductors, software, web, social media
and services subsectors. Technology sector, as represented by XLK, an exchange-traded fund [ETF] that holds basket of tech stocks (e.g, Intel, Google) is up by 10.05% and is currently underperforming the overall market by -0.52% year-to-date. Below is a quick view of technical charts and trends: |
|
 XLK Weekly Chart |
|
| Long Term Trend: Very Good | |
| Medium Term Trend: Very Good | |
 XLK Daily Chart |
|
| Short Term Trend: Good | |
| Overall Trend Score: 78 | |
| YTD Performance: 10.05% | |
| **Trend Scores & Views Are Only For Educational Purposes And Not For Investing | |
| 12Stocks.com: Top Performing Technology Sector Stocks | ||||||||||||||||||||||||||||||||||||||||||||||||
 The top performing Technology sector stocks year to date are
Now, more recently, over last week, the top performing Technology sector stocks on the move are


|
||||||||||||||||||||||||||||||||||||||||||||||||
| 12Stocks.com: Investing in Tech Sector using Exchange Traded Funds | |
|
The following table shows list of key exchange traded funds (ETF) that
help investors track Tech Index. For detailed view, check out our ETF Funds section of our website. Quick View: Move mouse or cursor over ETF symbol (ticker) to view short-term technical chart and over ETF name to view long term chart. Click on ticker or stock name for detailed view. Click on to add stock symbol to your watchlist and to view watchlist. |
12Stocks.com List of ETFs that track Tech Index
| Ticker | ETF Name | Watchlist | Recent Price | Smart Investing & Trading Score | Change % | Week % | Year-to-date % |
| XLK | Technology | | 211.82 | 78 | -0.22 | 3.06 | 10.05% |
| QQQ | QQQ | | 451.76 | 78 | -0.62 | 2.19 | 10.31% |
| IYW | Technology | | 138.02 | 83 | -0.59 | 3.02 | 12.44% |
| VGT | Information Technology | | 532.55 | 78 | -1.02 | 3.16 | 10.03% |
| IXN | Global Tech | | 75.90 | 78 | -0.41 | 2.72 | 11.32% |
| IGV | Tech-Software | | 84.27 | 59 | 0.20 | 3.54 | 3.87% |
| XSD | Semiconductor | | 238.61 | 88 | 0.06 | 4.04 | 6.15% |
| TQQQ | QQQ | | 62.94 | 78 | -0.22 | 6.37 | 24.14% |
| SQQQ | Short QQQ | | 9.97 | 17 | 0.30 | -6.03 | -25.87% |
| SOXL | Semicondct Bull 3X | | 45.40 | 78 | -1.86 | 10.65 | 44.59% |
| SOXS | Semicondct Bear 3X | | 29.69 | 43 | 5.10 | -10.46 | 410.14% |
| SOXX | PHLX Semiconductor | | 228.24 | 78 | -1.68 | 3.63 | 18.85% |
| QTEC | First -100-Tech | | 190.75 | 70 | -0.78 | 3.23 | 8.71% |
| SMH | Semiconductor | | 230.25 | 78 | -0.84 | 3.11 | 31.67% |
| 12Stocks.com: Charts, Trends, Fundamental Data and Performances of Tech Stocks | |
|
We now take in-depth look at all Tech stocks including charts, multi-period performances and overall trends (as measured by Smart Investing & Trading Score). One can sort Tech stocks (click link to choose) by Daily, Weekly and by Year-to-Date performances. Also, one can sort by size of the company or by market capitalization. |
| Select Your Default Chart Type: | |||||
| |||||
| Click on stock symbol or name for detailed view. Click on to add stock symbol to your watchlist and to view watchlist. Quick View: Move mouse or cursor over "Daily" to quickly view daily technical stock chart and over "Weekly" to view weekly technical stock chart. | |||||


 | AAPL Apple Inc. |
| Sector: Technology | |
| SubSector: Electronic Equipment | |
| MarketCap: 1112940 Millions | |
| Recent Price: 189.87 Smart Investing & Trading Score: 83 | |
| Day Percent Change: 0.05% Day Change: 0.09 | |
| Week Change: 3.73% Year-to-date Change: -1.4% | |
| AAPL Links: Profile News Message Board | |
| Charts:- Daily , Weekly | |
| Add AAPL to Watchlist: View: Get Complete AAPL Trend Analysis ➞ | |
 | GLW Corning Incorporated |
| Sector: Technology | |
| SubSector: Diversified Electronics | |
| MarketCap: 16287.6 Millions | |
| Recent Price: 35.35 Smart Investing & Trading Score: 90 | |
| Day Percent Change: 0.37% Day Change: 0.13 | |
| Week Change: 3.45% Year-to-date Change: 16.1% | |
| GLW Links: Profile News Message Board | |
| Charts:- Daily , Weekly | |
| Add GLW to Watchlist: View: Get Complete GLW Trend Analysis ➞ | |
 | APH Amphenol Corporation |
| Sector: Technology | |
| SubSector: Diversified Electronics | |
| MarketCap: 23422 Millions | |
| Recent Price: 131.91 Smart Investing & Trading Score: 83 | |
| Day Percent Change: 0.15% Day Change: 0.20 | |
| Week Change: 3.4% Year-to-date Change: 33.1% | |
| APH Links: Profile News Message Board | |
| Charts:- Daily , Weekly | |
| Add APH to Watchlist: View: Get Complete APH Trend Analysis ➞ | |
 | CCI Crown Castle International Corp. (REIT) |
| Sector: Technology | |
| SubSector: Diversified Communication Services | |
| MarketCap: 57615.4 Millions | |
| Recent Price: 102.89 Smart Investing & Trading Score: 57 | |
| Day Percent Change: -1.09% Day Change: -1.13 | |
| Week Change: 3.4% Year-to-date Change: -10.7% | |
| CCI Links: Profile News Message Board | |
| Charts:- Daily , Weekly | |
| Add CCI to Watchlist: View: Get Complete CCI Trend Analysis ➞ | |
 | MU Micron Technology, Inc. |
| Sector: Technology | |
| SubSector: Semiconductor- Memory Chips | |
| MarketCap: 45188.4 Millions | |
| Recent Price: 125.29 Smart Investing & Trading Score: 71 | |
| Day Percent Change: -2.03% Day Change: -2.60 | |
| Week Change: 3.34% Year-to-date Change: 46.8% | |
| MU Links: Profile News Message Board | |
| Charts:- Daily , Weekly | |
| Add MU to Watchlist: View: Get Complete MU Trend Analysis ➞ | |
 | ADI Analog Devices, Inc. |
| Sector: Technology | |
| SubSector: Semiconductor - Integrated Circuits | |
| MarketCap: 32859 Millions | |
| Recent Price: 214.08 Smart Investing & Trading Score: 83 | |
| Day Percent Change: -0.02% Day Change: -0.04 | |
| Week Change: 3.33% Year-to-date Change: 7.8% | |
| ADI Links: Profile News Message Board | |
| Charts:- Daily , Weekly | |
| Add ADI to Watchlist: View: Get Complete ADI Trend Analysis ➞ | |
 | TEL TE Connectivity Ltd. |
| Sector: Technology | |
| SubSector: Diversified Electronics | |
| MarketCap: 20044.9 Millions | |
| Recent Price: 151.01 Smart Investing & Trading Score: 88 | |
| Day Percent Change: -0.05% Day Change: -0.08 | |
| Week Change: 3.3% Year-to-date Change: 7.5% | |
| TEL Links: Profile News Message Board | |
| Charts:- Daily , Weekly | |
| Add TEL to Watchlist: View: Get Complete TEL Trend Analysis ➞ | |
 | TDY Teledyne Technologies Incorporated |
| Sector: Technology | |
| SubSector: Scientific & Technical Instruments | |
| MarketCap: 9360.43 Millions | |
| Recent Price: 406.43 Smart Investing & Trading Score: 64 | |
| Day Percent Change: 1.04% Day Change: 4.17 | |
| Week Change: 3.29% Year-to-date Change: -8.9% | |
| TDY Links: Profile News Message Board | |
| Charts:- Daily , Weekly | |
| Add TDY to Watchlist: View: Get Complete TDY Trend Analysis ➞ | |
 | TWLO Twilio Inc. |
| Sector: Technology | |
| SubSector: Application Software | |
| MarketCap: 13055.8 Millions | |
| Recent Price: 62.08 Smart Investing & Trading Score: 69 | |
| Day Percent Change: 0.88% Day Change: 0.54 | |
| Week Change: 3.29% Year-to-date Change: -18.2% | |
| TWLO Links: Profile News Message Board | |
| Charts:- Daily , Weekly | |
| Add TWLO to Watchlist: View: Get Complete TWLO Trend Analysis ➞ | |
 | WIMI WiMi Hologram Cloud Inc. |
| Sector: Technology | |
| SubSector: Advertising Agencies | |
| MarketCap: 41837 Millions | |
| Recent Price: 0.96 Smart Investing & Trading Score: 22 | |
| Day Percent Change: 0.22% Day Change: 0.00 | |
| Week Change: 3.24% Year-to-date Change: 19.3% | |
| WIMI Links: Profile News Message Board | |
| Charts:- Daily , Weekly | |
| Add WIMI to Watchlist: View: Get Complete WIMI Trend Analysis ➞ | |
 | CRM salesforce.com, inc. |
| Sector: Technology | |
| SubSector: Application Software | |
| MarketCap: 137120 Millions | |
| Recent Price: 285.61 Smart Investing & Trading Score: 52 | |
| Day Percent Change: 0.33% Day Change: 0.93 | |
| Week Change: 3.23% Year-to-date Change: 8.5% | |
| CRM Links: Profile News Message Board | |
| Charts:- Daily , Weekly | |
| Add CRM to Watchlist: View: Get Complete CRM Trend Analysis ➞ | |
 | TU TELUS Corporation |
| Sector: Technology | |
| SubSector: Wireless Communications | |
| MarketCap: 10864.7 Millions | |
| Recent Price: 16.62 Smart Investing & Trading Score: 74 | |
| Day Percent Change: 0.97% Day Change: 0.16 | |
| Week Change: 3.23% Year-to-date Change: -6.6% | |
| TU Links: Profile News Message Board | |
| Charts:- Daily , Weekly | |
| Add TU to Watchlist: View: Get Complete TU Trend Analysis ➞ | |
 | VEEV Veeva Systems Inc. |
| Sector: Technology | |
| SubSector: Healthcare Information Services | |
| MarketCap: 21492.1 Millions | |
| Recent Price: 210.27 Smart Investing & Trading Score: 52 | |
| Day Percent Change: 0.30% Day Change: 0.62 | |
| Week Change: 3.18% Year-to-date Change: 9.2% | |
| VEEV Links: Profile News Message Board | |
| Charts:- Daily , Weekly | |
| Add VEEV to Watchlist: View: Get Complete VEEV Trend Analysis ➞ | |
 | MCHP Microchip Technology Incorporated |
| Sector: Technology | |
| SubSector: Semiconductor - Broad Line | |
| MarketCap: 16826.3 Millions | |
| Recent Price: 94.33 Smart Investing & Trading Score: 76 | |
| Day Percent Change: 0.10% Day Change: 0.09 | |
| Week Change: 3.09% Year-to-date Change: 4.6% | |
| MCHP Links: Profile News Message Board | |
| Charts:- Daily , Weekly | |
| Add MCHP to Watchlist: View: Get Complete MCHP Trend Analysis ➞ | |
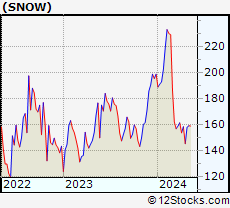 | SNOW Snowflake Inc. |
| Sector: Technology | |
| SubSector: Software Application | |
| MarketCap: 10567 Millions | |
| Recent Price: 161.86 Smart Investing & Trading Score: 40 | |
| Day Percent Change: -1.93% Day Change: -3.18 | |
| Week Change: 3% Year-to-date Change: -18.7% | |
| SNOW Links: Profile News Message Board | |
| Charts:- Daily , Weekly | |
| Add SNOW to Watchlist: View: Get Complete SNOW Trend Analysis ➞ | |
 | ORAN Orange S.A. |
| Sector: Technology | |
| SubSector: Telecom Services - Foreign | |
| MarketCap: 34948.2 Millions | |
| Recent Price: 11.69 Smart Investing & Trading Score: 90 | |
| Day Percent Change: -0.17% Day Change: -0.02 | |
| Week Change: 3% Year-to-date Change: 2.3% | |
| ORAN Links: Profile News Message Board | |
| Charts:- Daily , Weekly | |
| Add ORAN to Watchlist: View: Get Complete ORAN Trend Analysis ➞ | |
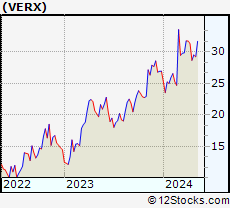 | VERX Vertex, Inc. |
| Sector: Technology | |
| SubSector: Software Application | |
| MarketCap: 39687 Millions | |
| Recent Price: 32.63 Smart Investing & Trading Score: 69 | |
| Day Percent Change: 1.02% Day Change: 0.33 | |
| Week Change: 2.93% Year-to-date Change: 21.0% | |
| VERX Links: Profile News Message Board | |
| Charts:- Daily , Weekly | |
| Add VERX to Watchlist: View: Get Complete VERX Trend Analysis ➞ | |
 | NVDA NVIDIA Corporation |
| Sector: Technology | |
| SubSector: Semiconductor - Specialized | |
| MarketCap: 143476 Millions | |
| Recent Price: 924.79 Smart Investing & Trading Score: 78 | |
| Day Percent Change: -1.99% Day Change: -18.80 | |
| Week Change: 2.89% Year-to-date Change: 86.7% | |
| NVDA Links: Profile News Message Board | |
| Charts:- Daily , Weekly | |
| Add NVDA to Watchlist: View: Get Complete NVDA Trend Analysis ➞ | |
 | NCNO nCino, Inc. |
| Sector: Technology | |
| SubSector: Software Application | |
| MarketCap: 74187 Millions | |
| Recent Price: 31.99 Smart Investing & Trading Score: 83 | |
| Day Percent Change: 0.38% Day Change: 0.12 | |
| Week Change: 2.83% Year-to-date Change: -4.9% | |
| NCNO Links: Profile News Message Board | |
| Charts:- Daily , Weekly | |
| Add NCNO to Watchlist: View: Get Complete NCNO Trend Analysis ➞ | |
 | STM STMicroelectronics N.V. |
| Sector: Technology | |
| SubSector: Semiconductor - Broad Line | |
| MarketCap: 17878.6 Millions | |
| Recent Price: 41.64 Smart Investing & Trading Score: 32 | |
| Day Percent Change: -0.69% Day Change: -0.29 | |
| Week Change: 2.79% Year-to-date Change: -16.9% | |
| STM Links: Profile News Message Board | |
| Charts:- Daily , Weekly | |
| Add STM to Watchlist: View: Get Complete STM Trend Analysis ➞ | |
 | GIB CGI Inc. |
| Sector: Technology | |
| SubSector: Information Technology Services | |
| MarketCap: 13185.3 Millions | |
| Recent Price: 105.14 Smart Investing & Trading Score: 64 | |
| Day Percent Change: 0.69% Day Change: 0.72 | |
| Week Change: 2.74% Year-to-date Change: -1.9% | |
| GIB Links: Profile News Message Board | |
| Charts:- Daily , Weekly | |
| Add GIB to Watchlist: View: Get Complete GIB Trend Analysis ➞ | |
 | CTSH Cognizant Technology Solutions Corporation |
| Sector: Technology | |
| SubSector: Information Technology Services | |
| MarketCap: 26249.7 Millions | |
| Recent Price: 68.76 Smart Investing & Trading Score: 47 | |
| Day Percent Change: -2.23% Day Change: -1.57 | |
| Week Change: 2.66% Year-to-date Change: -9.0% | |
| CTSH Links: Profile News Message Board | |
| Charts:- Daily , Weekly | |
| Add CTSH to Watchlist: View: Get Complete CTSH Trend Analysis ➞ | |
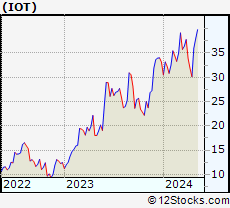 | IOT Samsara Inc. |
| Sector: Technology | |
| SubSector: Software - Infrastructure | |
| MarketCap: 14320 Millions | |
| Recent Price: 40.90 Smart Investing & Trading Score: 83 | |
| Day Percent Change: 0.69% Day Change: 0.28 | |
| Week Change: 2.66% Year-to-date Change: 23.3% | |
| IOT Links: Profile News Message Board | |
| Charts:- Daily , Weekly | |
| Add IOT to Watchlist: View: Get Complete IOT Trend Analysis ➞ | |
 | ZI ZoomInfo Technologies Inc. |
| Sector: Technology | |
| SubSector: Software Application | |
| MarketCap: 15937 Millions | |
| Recent Price: 13.09 Smart Investing & Trading Score: 28 | |
| Day Percent Change: -3.82% Day Change: -0.52 | |
| Week Change: 2.59% Year-to-date Change: -29.2% | |
| ZI Links: Profile News Message Board | |
| Charts:- Daily , Weekly | |
| Add ZI to Watchlist: View: Get Complete ZI Trend Analysis ➞ | |
 | EPAM EPAM Systems, Inc. |
| Sector: Technology | |
| SubSector: Information Technology Services | |
| MarketCap: 11519.6 Millions | |
| Recent Price: 187.80 Smart Investing & Trading Score: 18 | |
| Day Percent Change: -0.71% Day Change: -1.34 | |
| Week Change: 2.4% Year-to-date Change: -36.8% | |
| EPAM Links: Profile News Message Board | |
| Charts:- Daily , Weekly | |
| Add EPAM to Watchlist: View: Get Complete EPAM Trend Analysis ➞ | |
| For tabular summary view of above stock list: Summary View ➞ 0 - 25 , 25 - 50 , 50 - 75 , 75 - 100 , 100 - 125 , 125 - 150 , 150 - 175 , 175 - 200 | ||
| Click To Change The Sort Order: By Market Cap or Company Size Performance: Year-to-date, Week and Day | |
| Select Chart Type: | ||
|
Best Stocks Today 12Stocks.com |
© 2024 12Stocks.com Terms & Conditions Privacy Contact Us
All Information Provided Only For Education And Not To Be Used For Investing or Trading. See Terms & Conditions


One More Thing ... Get Best Stocks Delivered Daily!
Never Ever Miss A Move With Our Top Ten Stocks Lists
Find Best Stocks In Any Market - Bull or Bear Market
Take A Peek At Our Top Ten Stocks Lists: Daily, Weekly, Year-to-Date & Top Trends
Find Best Stocks In Any Market - Bull or Bear Market
Take A Peek At Our Top Ten Stocks Lists: Daily, Weekly, Year-to-Date & Top Trends
Technology Stocks With Best Up Trends [0-bearish to 100-bullish]: Robinhood Markets[100], CommScope Holding[100], MicroStrategy [100], Full Truck[100], Sea [100], GDS [100], JD.com [100], UP Fintech[100], Bilibili [100], Turkcell Iletisim[100], EverCommerce [100]
Best Technology Stocks Year-to-Date:
MicroCloud Hologram[495.68%], Bakkt [413.9%], Uxin [355.06%], Smith Micro[229.3%], MediaCo Holding[223.94%], Super Micro[212.35%], MicroStrategy [150.86%], CXApp [136.29%], SoundHound AI[135.98%], AppLovin [107.29%], Cheetah Mobile[101.32%] Best Technology Stocks This Week:
Maxeon Solar[35.94%], MicroStrategy [34.23%], Presto Automation[29.52%], on [29.45%], LivePerson [27.75%], Viomi [27.4%], Uxin [27.09%], monday.com [25.9%], CommScope Holding[25.71%], SunPower [23.91%], Robinhood Markets[23.78%] Best Technology Stocks Daily:
Presto Automation[31.90%], Robinhood Markets[12.23%], CommScope Holding[11.86%], Ouster [11.23%], Arqit Quantum[10.89%], 36Kr [10.41%], Cheetah Mobile[10.34%], MicroStrategy [10.04%], Bakkt [9.25%], Amesite [8.96%], MicroCloud Hologram[8.38%]