
 Login Sign Up


| |||||
 |  | ||||

| 12Stocks.com Market Intelligence |
Best Tech Stocks
| In a hurry? Tech Stocks Lists: Performance & Trends, Stock Charts, FANG Stocks
Sort Tech stocks: Daily, Weekly, Year-to-Date, Market Cap & Trends. Filter Tech stocks list by size:All Tech Large Mid-Range Small and MicroCap |
| 12Stocks.com Tech Stocks Performances & Trends Daily | |||||||||
|
|  The overall Smart Investing & Trading Score is 49 (0-bearish to 100-bullish) which puts Technology sector in short term neutral trend. The Smart Investing & Trading Score from previous trading session is 10 and hence an improvement of trend.
| ||||||||
Here are the Smart Investing & Trading Scores of the most requested Technology stocks at 12Stocks.com (click stock name for detailed review):
|


| 12Stocks.com: Investing in Technology sector with Stocks | |
|
The following table helps investors and traders sort through current performance and trends (as measured by Smart Investing & Trading Score) of various
stocks in the Tech sector. Quick View: Move mouse or cursor over stock symbol (ticker) to view short-term technical chart and over stock name to view long term chart. Click on  to add stock symbol to your watchlist and to add stock symbol to your watchlist and  to view watchlist. Click on any ticker or stock name for detailed market intelligence report for that stock. to view watchlist. Click on any ticker or stock name for detailed market intelligence report for that stock. |
12Stocks.com Performance of Stocks in Tech Sector
| Ticker | Stock Name | Watchlist | Category | Recent Price | Smart Investing & Trading Score | Change % | Weekly Change% |
| SNOW | Snowflake |   | Software | 159.32 | 52 | 0.98% | 0.75% |
| HPQ | HP | | Computer | 28.18 | 48 | 0.86% | 0.64% |
| T | AT&T | | Telecom | 16.85 | 58 | 0.18% | 0.60% |
| ERIC | Telefonaktiebolaget LM | | Communication | 5.21 | 57 | 1.17% | 0.58% |
| GIB | CGI | | IT | 103.68 | 50 | 1.54% | 0.52% |
| FOUR | Shift4 Payments | | Software Infrastructure | 59.38 | 42 | 1.77% | 0.52% |
| KEYS | Keysight | | Instruments | 149.18 | 49 | 1.49% | 0.42% |
| TMUS | T-Mobile US | | Wireless | 164.60 | 66 | -0.19% | 0.39% |
| AMAT | Applied Materials | | Semiconductor | 204.09 | 70 | 3.12% | 0.35% |
| HOOD | Robinhood Markets | | Software - Infrastructure | 17.95 | 78 | 4.63% | 0.34% |
| UBER | Uber | | Software | 69.23 | 32 | 0.96% | 0.26% |
| FTV | Fortive | | Instruments | 76.08 | 32 | -0.03% | 0.14% |
| MTCH | Match | | Internet | 31.93 | 37 | 2.05% | 0.13% |
| PATH | UiPath | | Software - Infrastructure | 19.48 | 49 | 1.30% | 0.10% |
| MSFT | Microsoft | | Software | 406.66 | 32 | 2.22% | 0.08% |
| DELL | Dell | | Personal Computers | 125.10 | 78 | 1.39% | 0.03% |
| CHKP | Check Point | | Security Software | 151.20 | 25 | 1.16% | 0.00% |
| VOD | Vodafone | | Wireless | 8.62 | 67 | 1.17% | 0.00% |
| INFY | Infosys | | IT | 16.93 | 42 | 0.36% | -0.06% |
| MU | Micron | | Semiconductor- | 114.70 | 70 | 2.11% | -0.12% |
| CRM | salesforce.com | | Software | 273.66 | 32 | 0.56% | -0.23% |
| CDNS | Cadence Design | | Software | 281.63 | 32 | 1.88% | -0.28% |
| ZM | Zoom Video | | Software | 61.82 | 45 | -1.61% | -0.29% |
| ALGM | Allegro MicroSystems | | Semiconductors | 30.00 | 69 | 1.33% | -0.35% |
| JKHY | Jack Henry | | IT | 164.18 | 32 | 1.03% | -0.42% |
| For chart view version of above stock list: Chart View ➞ 0 - 25 , 25 - 50 , 50 - 75 , 75 - 100 , 100 - 125 , 125 - 150 , 150 - 175 , 175 - 200 | ||
 | Click To Change The Sort Order: By Market Cap or Company Size Performance: Year-to-date, Week and Day |  |
|
Get the most comprehensive stock market coverage daily at 12Stocks.com ➞ Best Stocks Today ➞ Best Stocks Weekly ➞ Best Stocks Year-to-Date ➞ Best Stocks Trends ➞  Best Stocks Today 12Stocks.com Best Nasdaq Stocks ➞ Best S&P 500 Stocks ➞ Best Tech Stocks ➞ Best Biotech Stocks ➞ |
| Detailed Overview of Tech Stocks |
| Tech Technical Overview, Leaders & Laggards, Top Tech ETF Funds & Detailed Tech Stocks List, Charts, Trends & More |
| Tech Sector: Technical Analysis, Trends & YTD Performance | |
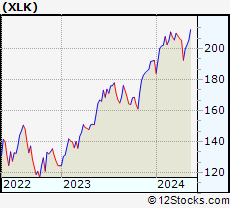
| Technology sector is composed of stocks
from semiconductors, software, web, social media
and services subsectors. Technology sector, as represented by XLK, an exchange-traded fund [ETF] that holds basket of tech stocks (e.g, Intel, Google) is up by 5.23% and is currently underperforming the overall market by -1.65% year-to-date. Below is a quick view of technical charts and trends: |
|
 XLK Weekly Chart |
|
| Long Term Trend: Not Good | |
| Medium Term Trend: Deteriorating | |
 XLK Daily Chart |
|
| Short Term Trend: Very Good | |
| Overall Trend Score: 49 | |
| YTD Performance: 5.23% | |
| **Trend Scores & Views Are Only For Educational Purposes And Not For Investing | |
| 12Stocks.com: Top Performing Technology Sector Stocks | ||||||||||||||||||||||||||||||||||||||||||||||||
 The top performing Technology sector stocks year to date are
Now, more recently, over last week, the top performing Technology sector stocks on the move are


|
||||||||||||||||||||||||||||||||||||||||||||||||
| 12Stocks.com: Investing in Tech Sector using Exchange Traded Funds | |
|
The following table shows list of key exchange traded funds (ETF) that
help investors track Tech Index. For detailed view, check out our ETF Funds section of our website. Quick View: Move mouse or cursor over ETF symbol (ticker) to view short-term technical chart and over ETF name to view long term chart. Click on ticker or stock name for detailed view. Click on to add stock symbol to your watchlist and to view watchlist. |
12Stocks.com List of ETFs that track Tech Index
| Ticker | ETF Name | Watchlist | Recent Price | Smart Investing & Trading Score | Change % | Week % | Year-to-date % |
| XLK | Technology | | 202.55 | 49 | 2.79 | 1.36 | 5.23% |
| QQQ | QQQ | | 435.48 | 57 | 2.01 | 1.04 | 6.34% |
| IYW | Technology | | 132.17 | 62 | 2.45 | 0.93 | 7.67% |
| VGT | Information Technology | | 509.46 | 49 | 2.70 | 1.1 | 5.26% |
| IXN | Global Tech | | 72.86 | 62 | 2.82 | 1.48 | 6.86% |
| IGV | Tech-Software | | 80.87 | 42 | 1.20 | -0.27 | -0.32% |
| XSD | Semiconductor | | 226.11 | 88 | 2.25 | 0.63 | 0.59% |
| TQQQ | QQQ | | 56.70 | 49 | 5.92 | 2.57 | 11.83% |
| SQQQ | Short QQQ | | 11.08 | 51 | -5.94 | -3.06 | -17.62% |
| SOXL | Semicondct Bull 3X | | 38.97 | 39 | 6.91 | -1.96 | 24.11% |
| SOXS | Semicondct Bear 3X | | 35.12 | 51 | -6.60 | 0.06 | 503.44% |
| SOXX | PHLX Semiconductor | | 216.17 | 52 | 2.25 | -0.34 | 12.57% |
| QTEC | First -100-Tech | | 182.75 | 42 | 1.45 | -0.67 | 4.15% |
| SMH | Semiconductor | | 217.73 | 65 | 2.69 | 0.04 | 24.51% |
| 12Stocks.com: Charts, Trends, Fundamental Data and Performances of Tech Stocks | |
|
We now take in-depth look at all Tech stocks including charts, multi-period performances and overall trends (as measured by Smart Investing & Trading Score). One can sort Tech stocks (click link to choose) by Daily, Weekly and by Year-to-Date performances. Also, one can sort by size of the company or by market capitalization. |
| Select Your Default Chart Type: | |||||
| |||||
| Click on stock symbol or name for detailed view. Click on to add stock symbol to your watchlist and to view watchlist. Quick View: Move mouse or cursor over "Daily" to quickly view daily technical stock chart and over "Weekly" to view weekly technical stock chart. | |||||


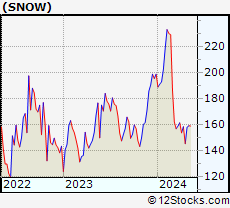 | SNOW Snowflake Inc. |
| Sector: Technology | |
| SubSector: Software Application | |
| MarketCap: 10567 Millions | |
| Recent Price: 159.32 Smart Investing & Trading Score: 52 | |
| Day Percent Change: 0.98% Day Change: 1.55 | |
| Week Change: 0.75% Year-to-date Change: -19.9% | |
| SNOW Links: Profile News Message Board | |
| Charts:- Daily , Weekly | |
| Add SNOW to Watchlist: View: Get Complete SNOW Trend Analysis ➞ | |
 | HPQ HP Inc. |
| Sector: Technology | |
| SubSector: Diversified Computer Systems | |
| MarketCap: 22107.8 Millions | |
| Recent Price: 28.18 Smart Investing & Trading Score: 48 | |
| Day Percent Change: 0.86% Day Change: 0.24 | |
| Week Change: 0.64% Year-to-date Change: -6.4% | |
| HPQ Links: Profile News Message Board | |
| Charts:- Daily , Weekly | |
| Add HPQ to Watchlist: View: Get Complete HPQ Trend Analysis ➞ | |
 | T AT&T Inc. |
| Sector: Technology | |
| SubSector: Telecom Services - Domestic | |
| MarketCap: 224847 Millions | |
| Recent Price: 16.85 Smart Investing & Trading Score: 58 | |
| Day Percent Change: 0.18% Day Change: 0.03 | |
| Week Change: 0.6% Year-to-date Change: 0.4% | |
| T Links: Profile News Message Board | |
| Charts:- Daily , Weekly | |
| Add T to Watchlist: View: Get Complete T Trend Analysis ➞ | |
 | ERIC Telefonaktiebolaget LM Ericsson (publ) |
| Sector: Technology | |
| SubSector: Communication Equipment | |
| MarketCap: 27041.1 Millions | |
| Recent Price: 5.21 Smart Investing & Trading Score: 57 | |
| Day Percent Change: 1.17% Day Change: 0.06 | |
| Week Change: 0.58% Year-to-date Change: -17.3% | |
| ERIC Links: Profile News Message Board | |
| Charts:- Daily , Weekly | |
| Add ERIC to Watchlist: View: Get Complete ERIC Trend Analysis ➞ | |
 | GIB CGI Inc. |
| Sector: Technology | |
| SubSector: Information Technology Services | |
| MarketCap: 13185.3 Millions | |
| Recent Price: 103.68 Smart Investing & Trading Score: 50 | |
| Day Percent Change: 1.54% Day Change: 1.57 | |
| Week Change: 0.52% Year-to-date Change: -3.3% | |
| GIB Links: Profile News Message Board | |
| Charts:- Daily , Weekly | |
| Add GIB to Watchlist: View: Get Complete GIB Trend Analysis ➞ | |
 | FOUR Shift4 Payments, Inc. |
| Sector: Technology | |
| SubSector: Software Infrastructure | |
| MarketCap: 49287 Millions | |
| Recent Price: 59.38 Smart Investing & Trading Score: 42 | |
| Day Percent Change: 1.77% Day Change: 1.03 | |
| Week Change: 0.52% Year-to-date Change: -20.1% | |
| FOUR Links: Profile News Message Board | |
| Charts:- Daily , Weekly | |
| Add FOUR to Watchlist: View: Get Complete FOUR Trend Analysis ➞ | |
 | KEYS Keysight Technologies, Inc. |
| Sector: Technology | |
| SubSector: Scientific & Technical Instruments | |
| MarketCap: 17355.1 Millions | |
| Recent Price: 149.18 Smart Investing & Trading Score: 49 | |
| Day Percent Change: 1.49% Day Change: 2.19 | |
| Week Change: 0.42% Year-to-date Change: -6.2% | |
| KEYS Links: Profile News Message Board | |
| Charts:- Daily , Weekly | |
| Add KEYS to Watchlist: View: Get Complete KEYS Trend Analysis ➞ | |
 | TMUS T-Mobile US, Inc. |
| Sector: Technology | |
| SubSector: Wireless Communications | |
| MarketCap: 71949 Millions | |
| Recent Price: 164.60 Smart Investing & Trading Score: 66 | |
| Day Percent Change: -0.19% Day Change: -0.31 | |
| Week Change: 0.39% Year-to-date Change: 2.7% | |
| TMUS Links: Profile News Message Board | |
| Charts:- Daily , Weekly | |
| Add TMUS to Watchlist: View: Get Complete TMUS Trend Analysis ➞ | |
 | AMAT Applied Materials, Inc. |
| Sector: Technology | |
| SubSector: Semiconductor Equipment & Materials | |
| MarketCap: 40593.8 Millions | |
| Recent Price: 204.09 Smart Investing & Trading Score: 70 | |
| Day Percent Change: 3.12% Day Change: 6.18 | |
| Week Change: 0.35% Year-to-date Change: 25.9% | |
| AMAT Links: Profile News Message Board | |
| Charts:- Daily , Weekly | |
| Add AMAT to Watchlist: View: Get Complete AMAT Trend Analysis ➞ | |
 | HOOD Robinhood Markets, Inc. |
| Sector: Technology | |
| SubSector: Software - Infrastructure | |
| MarketCap: 9200 Millions | |
| Recent Price: 17.95 Smart Investing & Trading Score: 78 | |
| Day Percent Change: 4.63% Day Change: 0.79 | |
| Week Change: 0.34% Year-to-date Change: 41.6% | |
| HOOD Links: Profile News Message Board | |
| Charts:- Daily , Weekly | |
| Add HOOD to Watchlist: View: Get Complete HOOD Trend Analysis ➞ | |
 | UBER Uber Technologies, Inc. |
| Sector: Technology | |
| SubSector: Application Software | |
| MarketCap: 42671.2 Millions | |
| Recent Price: 69.23 Smart Investing & Trading Score: 32 | |
| Day Percent Change: 0.96% Day Change: 0.66 | |
| Week Change: 0.26% Year-to-date Change: 12.4% | |
| UBER Links: Profile News Message Board | |
| Charts:- Daily , Weekly | |
| Add UBER to Watchlist: View: Get Complete UBER Trend Analysis ➞ | |
 | FTV Fortive Corporation |
| Sector: Technology | |
| SubSector: Scientific & Technical Instruments | |
| MarketCap: 16351.9 Millions | |
| Recent Price: 76.08 Smart Investing & Trading Score: 32 | |
| Day Percent Change: -0.03% Day Change: -0.02 | |
| Week Change: 0.14% Year-to-date Change: 3.3% | |
| FTV Links: Profile News Message Board | |
| Charts:- Daily , Weekly | |
| Add FTV to Watchlist: View: Get Complete FTV Trend Analysis ➞ | |
 | MTCH Match Group, Inc. |
| Sector: Technology | |
| SubSector: Internet Information Providers | |
| MarketCap: 14655.8 Millions | |
| Recent Price: 31.93 Smart Investing & Trading Score: 37 | |
| Day Percent Change: 2.05% Day Change: 0.64 | |
| Week Change: 0.13% Year-to-date Change: -12.5% | |
| MTCH Links: Profile News Message Board | |
| Charts:- Daily , Weekly | |
| Add MTCH to Watchlist: View: Get Complete MTCH Trend Analysis ➞ | |
 | PATH UiPath Inc. |
| Sector: Technology | |
| SubSector: Software - Infrastructure | |
| MarketCap: 9580 Millions | |
| Recent Price: 19.48 Smart Investing & Trading Score: 49 | |
| Day Percent Change: 1.30% Day Change: 0.25 | |
| Week Change: 0.1% Year-to-date Change: -21.6% | |
| PATH Links: Profile News Message Board | |
| Charts:- Daily , Weekly | |
| Add PATH to Watchlist: View: Get Complete PATH Trend Analysis ➞ | |
 | MSFT Microsoft Corporation |
| Sector: Technology | |
| SubSector: Business Software & Services | |
| MarketCap: 1154150 Millions | |
| Recent Price: 406.66 Smart Investing & Trading Score: 32 | |
| Day Percent Change: 2.22% Day Change: 8.82 | |
| Week Change: 0.08% Year-to-date Change: 8.1% | |
| MSFT Links: Profile News Message Board | |
| Charts:- Daily , Weekly | |
| Add MSFT to Watchlist: View: Get Complete MSFT Trend Analysis ➞ | |
 | DELL Dell Technologies Inc. |
| Sector: Technology | |
| SubSector: Personal Computers | |
| MarketCap: 26750.6 Millions | |
| Recent Price: 125.10 Smart Investing & Trading Score: 78 | |
| Day Percent Change: 1.39% Day Change: 1.71 | |
| Week Change: 0.03% Year-to-date Change: 63.5% | |
| DELL Links: Profile News Message Board | |
| Charts:- Daily , Weekly | |
| Add DELL to Watchlist: View: Get Complete DELL Trend Analysis ➞ | |
 | CHKP Check Point Software Technologies Ltd. |
| Sector: Technology | |
| SubSector: Security Software & Services | |
| MarketCap: 15112.2 Millions | |
| Recent Price: 151.20 Smart Investing & Trading Score: 25 | |
| Day Percent Change: 1.16% Day Change: 1.73 | |
| Week Change: 0% Year-to-date Change: -1.0% | |
| CHKP Links: Profile News Message Board | |
| Charts:- Daily , Weekly | |
| Add CHKP to Watchlist: View: Get Complete CHKP Trend Analysis ➞ | |
 | VOD Vodafone Group Plc |
| Sector: Technology | |
| SubSector: Wireless Communications | |
| MarketCap: 38154.7 Millions | |
| Recent Price: 8.62 Smart Investing & Trading Score: 67 | |
| Day Percent Change: 1.17% Day Change: 0.10 | |
| Week Change: 0% Year-to-date Change: -0.9% | |
| VOD Links: Profile News Message Board | |
| Charts:- Daily , Weekly | |
| Add VOD to Watchlist: View: Get Complete VOD Trend Analysis ➞ | |
 | INFY Infosys Limited |
| Sector: Technology | |
| SubSector: Information Technology Services | |
| MarketCap: 33819.1 Millions | |
| Recent Price: 16.93 Smart Investing & Trading Score: 42 | |
| Day Percent Change: 0.36% Day Change: 0.06 | |
| Week Change: -0.06% Year-to-date Change: -7.9% | |
| INFY Links: Profile News Message Board | |
| Charts:- Daily , Weekly | |
| Add INFY to Watchlist: View: Get Complete INFY Trend Analysis ➞ | |
 | MU Micron Technology, Inc. |
| Sector: Technology | |
| SubSector: Semiconductor- Memory Chips | |
| MarketCap: 45188.4 Millions | |
| Recent Price: 114.70 Smart Investing & Trading Score: 70 | |
| Day Percent Change: 2.11% Day Change: 2.37 | |
| Week Change: -0.12% Year-to-date Change: 34.4% | |
| MU Links: Profile News Message Board | |
| Charts:- Daily , Weekly | |
| Add MU to Watchlist: View: Get Complete MU Trend Analysis ➞ | |
 | CRM salesforce.com, inc. |
| Sector: Technology | |
| SubSector: Application Software | |
| MarketCap: 137120 Millions | |
| Recent Price: 273.66 Smart Investing & Trading Score: 32 | |
| Day Percent Change: 0.56% Day Change: 1.53 | |
| Week Change: -0.23% Year-to-date Change: 4.0% | |
| CRM Links: Profile News Message Board | |
| Charts:- Daily , Weekly | |
| Add CRM to Watchlist: View: Get Complete CRM Trend Analysis ➞ | |
 | CDNS Cadence Design Systems, Inc. |
| Sector: Technology | |
| SubSector: Application Software | |
| MarketCap: 16865.8 Millions | |
| Recent Price: 281.63 Smart Investing & Trading Score: 32 | |
| Day Percent Change: 1.88% Day Change: 5.19 | |
| Week Change: -0.28% Year-to-date Change: 3.4% | |
| CDNS Links: Profile News Message Board | |
| Charts:- Daily , Weekly | |
| Add CDNS to Watchlist: View: Get Complete CDNS Trend Analysis ➞ | |
 | ZM Zoom Video Communications, Inc. |
| Sector: Technology | |
| SubSector: Application Software | |
| MarketCap: 36358.1 Millions | |
| Recent Price: 61.82 Smart Investing & Trading Score: 45 | |
| Day Percent Change: -1.61% Day Change: -1.01 | |
| Week Change: -0.29% Year-to-date Change: -14.0% | |
| ZM Links: Profile News Message Board | |
| Charts:- Daily , Weekly | |
| Add ZM to Watchlist: View: Get Complete ZM Trend Analysis ➞ | |
 | ALGM Allegro MicroSystems, Inc. |
| Sector: Technology | |
| SubSector: Semiconductors | |
| MarketCap: 50287 Millions | |
| Recent Price: 30.00 Smart Investing & Trading Score: 69 | |
| Day Percent Change: 1.33% Day Change: 0.39 | |
| Week Change: -0.35% Year-to-date Change: -1.0% | |
| ALGM Links: Profile News Message Board | |
| Charts:- Daily , Weekly | |
| Add ALGM to Watchlist: View: Get Complete ALGM Trend Analysis ➞ | |
 | JKHY Jack Henry & Associates, Inc. |
| Sector: Technology | |
| SubSector: Information Technology Services | |
| MarketCap: 10695.4 Millions | |
| Recent Price: 164.18 Smart Investing & Trading Score: 32 | |
| Day Percent Change: 1.03% Day Change: 1.67 | |
| Week Change: -0.42% Year-to-date Change: 0.5% | |
| JKHY Links: Profile News Message Board | |
| Charts:- Daily , Weekly | |
| Add JKHY to Watchlist: View: Get Complete JKHY Trend Analysis ➞ | |
| For tabular summary view of above stock list: Summary View ➞ 0 - 25 , 25 - 50 , 50 - 75 , 75 - 100 , 100 - 125 , 125 - 150 , 150 - 175 , 175 - 200 | ||
| Click To Change The Sort Order: By Market Cap or Company Size Performance: Year-to-date, Week and Day | |
| Select Chart Type: | ||
|
Best Stocks Today 12Stocks.com |
© 2024 12Stocks.com Terms & Conditions Privacy Contact Us
All Information Provided Only For Education And Not To Be Used For Investing or Trading. See Terms & Conditions


One More Thing ... Get Best Stocks Delivered Daily!
Never Ever Miss A Move With Our Top Ten Stocks Lists
Find Best Stocks In Any Market - Bull or Bear Market
Take A Peek At Our Top Ten Stocks Lists: Daily, Weekly, Year-to-Date & Top Trends
Find Best Stocks In Any Market - Bull or Bear Market
Take A Peek At Our Top Ten Stocks Lists: Daily, Weekly, Year-to-Date & Top Trends
Technology Stocks With Best Up Trends [0-bearish to 100-bullish]: WideOpenWest [100], FTC Solar[100], Clearfield [100], OneSpan [100], Itron [100], Cardlytics [100], First Solar[100], Apple [100], Cricut [100], Motorola [100], Conduent [100]
Best Technology Stocks Year-to-Date:
MicroCloud Hologram[553.24%], MediaCo Holding[400%], Bakkt [199.55%], Uxin [188.16%], Smith Micro[183.29%], Super Micro[175.35%], CXApp [157.92%], CuriosityStream [109.22%], SoundHound AI[103.27%], NextNav [100.67%], MediaAlpha [99.64%] Best Technology Stocks This Week:
Bakkt [1571.25%], Luna Innovations[53.77%], SYLA [48.97%], 2U [41.49%], WideOpenWest [40.06%], FTC Solar[32.15%], Mitcham Industries[31.57%], Koninklijke Philips[27.29%], Conduent [26.47%], Cogint [25.08%], AXT [23.23%] Best Technology Stocks Daily:
Luna Innovations[36.00%], WideOpenWest [28.23%], Upland Software[28.22%], 2U [26.63%], FTC Solar[25.09%], Arteris [21.36%], AXT [20.79%], Aurora Innovation[18.09%], Clearfield [13.22%], OneSpan [13.15%], Paylocity Holding[12.05%]