
 Login Sign Up


| |||||
 |  | ||||

| 12Stocks.com Market Intelligence |
Best Tech Stocks
| In a hurry? Tech Stocks Lists: Performance & Trends, Stock Charts, FANG Stocks
Sort Tech stocks: Daily, Weekly, Year-to-Date, Market Cap & Trends. Filter Tech stocks list by size:All Tech Large Mid-Range Small and MicroCap |
| 12Stocks.com Tech Stocks Performances & Trends Daily | |||||||||
|
|  The overall Smart Investing & Trading Score is 20 (0-bearish to 100-bullish) which puts Technology sector in short term bearish trend. The Smart Investing & Trading Score from previous trading session is 30 and hence a deterioration of trend.
| ||||||||
Here are the Smart Investing & Trading Scores of the most requested Technology stocks at 12Stocks.com (click stock name for detailed review):
|


| 12Stocks.com: Investing in Technology sector with Stocks | |
|
The following table helps investors and traders sort through current performance and trends (as measured by Smart Investing & Trading Score) of various
stocks in the Tech sector. Quick View: Move mouse or cursor over stock symbol (ticker) to view short-term technical chart and over stock name to view long term chart. Click on  to add stock symbol to your watchlist and to add stock symbol to your watchlist and  to view watchlist. Click on any ticker or stock name for detailed market intelligence report for that stock. to view watchlist. Click on any ticker or stock name for detailed market intelligence report for that stock. |
12Stocks.com Performance of Stocks in Tech Sector
| Ticker | Stock Name | Watchlist | Category | Recent Price | Smart Investing & Trading Score | Change % | YTD Change% |
| RUN | Sunrun |   | Semiconductor | 15.97 | 70 | -4.72 | 59.35% |
| TEF | Telefonica S.A | | Telecom | 5.35 | 20 | -4.73 | 39.78% |
| GCT | GigaCloud | | Software - Infrastructure | 26.47 | 30 | -5.22 | 61.72% |
| KRKR | 36Kr | | Internet | 4.90 | 60 | -5.33 | 35.24% |
| GDS | GDS | | Data Storage | 34.56 | 40 | -5.60 | 34.68% |
| SEDG | SolarEdge | | Semiconductor | 33.82 | 50 | -5.77 | 122.13% |
| ARRY | Array | | Solar | 9.01 | 70 | -6.05 | 38.91% |
| BILI | Bilibili | | Internet | 23.26 | 20 | -6.11 | 31.20% |
| SCSC | ScanSource | | Software | 43.65 | 50 | -6.16 | -15.89% |
| SHLS | Shoals | | Solar | 6.51 | 100 | -6.34 | 4.16% |
| STEM | Stem | | Software - Infrastructure | 15.13 | 50 | -7.16 | 26.78% |
| UPLD | Upland Software | | Software | 2.83 | 60 | -7.39 | -39.40% |
| VNET | 21Vianet | | IT | 8.66 | 40 | -8.02 | 54.85% |
| GOGO | Gogo | | Communication | 10.98 | 20 | -9.28 | 37.82% |
| CSIQ | Canadian Solar | | Semiconductor | 9.78 | 10 | -18.55 | -6.61% |
| QH | Quhuo | | Software | 4.76 | 100 | -40.21 | -95.75% |
| INOV | Inovalon | | Healthcare Information | 32.88 | 30 | -100.00 | -100.00% |
| For chart view version of above stock list: Chart View ➞ 0 - 25 , 25 - 50 , 50 - 75 , 75 - 100 , 100 - 125 , 125 - 150 , 150 - 175 , 175 - 200 , 200 - 225 , 225 - 250 , 250 - 275 , 275 - 300 , 300 - 325 , 325 - 350 , 350 - 375 , 375 - 400 , 400 - 425 , 425 - 450 , 450 - 475 , 475 - 500 , 500 - 525 , 525 - 550 , 550 - 575 , 575 - 600 | ||
 | Click To Change The Sort Order: By Market Cap or Company Size Performance: Year-to-date, Week and Day |  |
|
Get the most comprehensive stock market coverage daily at 12Stocks.com ➞ Best Stocks Today ➞ Best Stocks Weekly ➞ Best Stocks Year-to-Date ➞ Best Stocks Trends ➞  Best Stocks Today 12Stocks.com Best Nasdaq Stocks ➞ Best S&P 500 Stocks ➞ Best Tech Stocks ➞ Best Biotech Stocks ➞ |
| Detailed Overview of Tech Stocks |
| Tech Technical Overview, Leaders & Laggards, Top Tech ETF Funds & Detailed Tech Stocks List, Charts, Trends & More |
| Tech Sector: Technical Analysis, Trends & YTD Performance | |
| Technology sector is composed of stocks
from semiconductors, software, web, social media
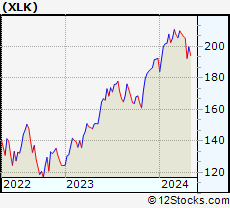
and services subsectors. Technology sector, as represented by XLK, an exchange-traded fund [ETF] that holds basket of tech stocks (e.g, Intel, Google) is up by 12.94% and is currently outperforming the overall market by 6.42% year-to-date. Below is a quick view of technical charts and trends: |
|
 XLK Weekly Chart |
|
| Long Term Trend: Very Good | |
| Medium Term Trend: Deteriorating | |
 XLK Daily Chart |
|
| Short Term Trend: Not Good | |
| Overall Trend Score: 20 | |
| YTD Performance: 12.94% | |
| **Trend Scores & Views Are Only For Educational Purposes And Not For Investing | |
| 12Stocks.com: Top Performing Technology Sector Stocks | ||||||||||||||||||||||||||||||||||||||||||||||||
 The top performing Technology sector stocks year to date are
Now, more recently, over last week, the top performing Technology sector stocks on the move are


|
||||||||||||||||||||||||||||||||||||||||||||||||
| 12Stocks.com: Investing in Tech Sector using Exchange Traded Funds | |
|
The following table shows list of key exchange traded funds (ETF) that
help investors track Tech Index. For detailed view, check out our ETF Funds section of our website. Quick View: Move mouse or cursor over ETF symbol (ticker) to view short-term technical chart and over ETF name to view long term chart. Click on ticker or stock name for detailed view. Click on to add stock symbol to your watchlist and to view watchlist. |
12Stocks.com List of ETFs that track Tech Index
| Ticker | ETF Name | Watchlist | Recent Price | Smart Investing & Trading Score | Change % | Week % | Year-to-date % |
| XLK | Technology | | 259.8 | 20 | -1.01 | -1.01 | 12.94% |
| QQQ | QQQ | | 565.62 | 30 | -0.84 | -0.84 | 8.58% |
| IYW | Technology | | 181.79 | 20 | -0.37 | -3.41 | 12.08% |
| VGT | Information Technology | | 697.02 | 30 | -0.26 | -3.18 | 9.95% |
| IXN | Global Tech | | 95.46 | 20 | -0.44 | -3.5 | 11.62% |
| IGV | Tech-Software | | 108.10 | 0 | -0.35 | -2.2 | 5.83% |
| XSD | Semiconductor | | 282.76 | 50 | -1.2 | -1.2 | 13.9% |
| TQQQ | QQQ | | 87.08 | 20 | -2.55 | -2.55 | 5.88% |
| SQQQ | Short QQQ | | 18.4 | 80 | 2.51 | 2.51 | -34.9% |
| SOXL | Semicondct Bull 3X | | 26.04 | 30 | 8.36 | 0.37 | 2.3% |
| SOXS | Semicondct Bear 3X | | 7.14 | 80 | 1.64 | 15.17 | -66.42% |
| SOXX | PHLX Semiconductor | | 245.32 | 30 | -0.57 | -4.64 | 12.86% |
| QTEC | First -100-Tech | | 212.86 | 10 | -0.36 | -2.77 | 10.98% |
| SMH | Semiconductor | | 290.29 | 30 | 2.19 | -0.64 | 20.58% |
| 12Stocks.com: Charts, Trends, Fundamental Data and Performances of Tech Stocks | |
|
We now take in-depth look at all Tech stocks including charts, multi-period performances and overall trends (as measured by Smart Investing & Trading Score). One can sort Tech stocks (click link to choose) by Daily, Weekly and by Year-to-Date performances. Also, one can sort by size of the company or by market capitalization. |
| Select Your Default Chart Type: | |||||
| |||||
| Click on stock symbol or name for detailed view. Click on to add stock symbol to your watchlist and to view watchlist. Quick View: Move mouse or cursor over "Daily" to quickly view daily technical stock chart and over "Weekly" to view weekly technical stock chart. | |||||


 | RUN Sunrun Inc. |
| Sector: Technology | |
| SubSector: Semiconductor - Specialized | |
| MarketCap: 1286.2 Millions | |
| Recent Price: 15.97 Smart Investing & Trading Score: 70 | |
| Day Percent Change: -4.72% Day Change: -0.73 | |
| Week Change: 40.65% Year-to-date Change: 59.4% | |
| RUN Links: Profile News Message Board | |
| Charts:- Daily , Weekly | |
| Add RUN to Watchlist: View: Get Complete RUN Trend Analysis ➞ | |
 | TEF Telefonica, S.A. |
| Sector: Technology | |
| SubSector: Telecom Services - Foreign | |
| MarketCap: 26698.4 Millions | |
| Recent Price: 5.35 Smart Investing & Trading Score: 20 | |
| Day Percent Change: -4.73% Day Change: -0.27 | |
| Week Change: -2.51% Year-to-date Change: 39.8% | |
| TEF Links: Profile News Message Board | |
| Charts:- Daily , Weekly | |
| Add TEF to Watchlist: View: Get Complete TEF Trend Analysis ➞ | |
 | GCT GigaCloud Technology Inc. |
| Sector: Technology | |
| SubSector: Software - Infrastructure | |
| MarketCap: 240 Millions | |
| Recent Price: 26.47 Smart Investing & Trading Score: 30 | |
| Day Percent Change: -5.22% Day Change: -1.65 | |
| Week Change: -6.2% Year-to-date Change: 61.7% | |
| GCT Links: Profile News Message Board | |
| Charts:- Daily , Weekly | |
| Add GCT to Watchlist: View: Get Complete GCT Trend Analysis ➞ | |
 | KRKR 36Kr Holdings Inc. |
| Sector: Technology | |
| SubSector: Internet Information Providers | |
| MarketCap: 173.18 Millions | |
| Recent Price: 4.90 Smart Investing & Trading Score: 60 | |
| Day Percent Change: -5.33% Day Change: -0.24 | |
| Week Change: -13.59% Year-to-date Change: 35.2% | |
| KRKR Links: Profile News Message Board | |
| Charts:- Daily , Weekly | |
| Add KRKR to Watchlist: View: Get Complete KRKR Trend Analysis ➞ | |
 | GDS GDS Holdings Limited |
| Sector: Technology | |
| SubSector: Data Storage Devices | |
| MarketCap: 8597.99 Millions | |
| Recent Price: 34.56 Smart Investing & Trading Score: 40 | |
| Day Percent Change: -5.6% Day Change: -1.9 | |
| Week Change: 0.5% Year-to-date Change: 34.7% | |
| GDS Links: Profile News Message Board | |
| Charts:- Daily , Weekly | |
| Add GDS to Watchlist: View: Get Complete GDS Trend Analysis ➞ | |
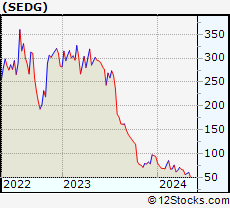 | SEDG SolarEdge Technologies, Inc. |
| Sector: Technology | |
| SubSector: Semiconductor - Specialized | |
| MarketCap: 4008.8 Millions | |
| Recent Price: 33.82 Smart Investing & Trading Score: 50 | |
| Day Percent Change: -5.77% Day Change: -1.85 | |
| Week Change: 17.69% Year-to-date Change: 122.1% | |
| SEDG Links: Profile News Message Board | |
| Charts:- Daily , Weekly | |
| Add SEDG to Watchlist: View: Get Complete SEDG Trend Analysis ➞ | |
 | ARRY Array Technologies, Inc. |
| Sector: Technology | |
| SubSector: Solar | |
| MarketCap: 45887 Millions | |
| Recent Price: 9.01 Smart Investing & Trading Score: 70 | |
| Day Percent Change: -6.05% Day Change: -0.54 | |
| Week Change: 37.99% Year-to-date Change: 38.9% | |
| ARRY Links: Profile News Message Board | |
| Charts:- Daily , Weekly | |
| Add ARRY to Watchlist: View: Get Complete ARRY Trend Analysis ➞ | |
 | BILI Bilibili Inc. |
| Sector: Technology | |
| SubSector: Internet Information Providers | |
| MarketCap: 7043.1 Millions | |
| Recent Price: 23.26 Smart Investing & Trading Score: 20 | |
| Day Percent Change: -6.11% Day Change: -1.54 | |
| Week Change: -0.25% Year-to-date Change: 31.2% | |
| BILI Links: Profile News Message Board | |
| Charts:- Daily , Weekly | |
| Add BILI to Watchlist: View: Get Complete BILI Trend Analysis ➞ | |
 | SCSC ScanSource, Inc. |
| Sector: Technology | |
| SubSector: Technical & System Software | |
| MarketCap: 541 Millions | |
| Recent Price: 43.65 Smart Investing & Trading Score: 50 | |
| Day Percent Change: -6.16% Day Change: -2.62 | |
| Week Change: -9.09% Year-to-date Change: -15.9% | |
| SCSC Links: Profile News Message Board | |
| Charts:- Daily , Weekly | |
| Add SCSC to Watchlist: View: Get Complete SCSC Trend Analysis ➞ | |
 | SHLS Shoals Technologies Group, Inc. |
| Sector: Technology | |
| SubSector: Solar | |
| MarketCap: 4360 Millions | |
| Recent Price: 6.51 Smart Investing & Trading Score: 100 | |
| Day Percent Change: -6.34% Day Change: -0.39 | |
| Week Change: 25.49% Year-to-date Change: 4.2% | |
| SHLS Links: Profile News Message Board | |
| Charts:- Daily , Weekly | |
| Add SHLS to Watchlist: View: Get Complete SHLS Trend Analysis ➞ | |
 | STEM Stem, Inc. |
| Sector: Technology | |
| SubSector: Software - Infrastructure | |
| MarketCap: 836 Millions | |
| Recent Price: 15.13 Smart Investing & Trading Score: 50 | |
| Day Percent Change: -7.16% Day Change: -1.18 | |
| Week Change: 4.01% Year-to-date Change: 26.8% | |
| STEM Links: Profile News Message Board | |
| Charts:- Daily , Weekly | |
| Add STEM to Watchlist: View: Get Complete STEM Trend Analysis ➞ | |
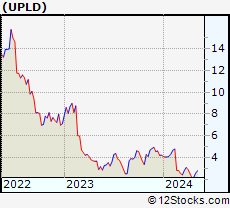 | UPLD Upland Software, Inc. |
| Sector: Technology | |
| SubSector: Application Software | |
| MarketCap: 654.562 Millions | |
| Recent Price: 2.83 Smart Investing & Trading Score: 60 | |
| Day Percent Change: -7.39% Day Change: -0.21 | |
| Week Change: 42.16% Year-to-date Change: -39.4% | |
| UPLD Links: Profile News Message Board | |
| Charts:- Daily , Weekly | |
| Add UPLD to Watchlist: View: Get Complete UPLD Trend Analysis ➞ | |
 | VNET 21Vianet Group, Inc. |
| Sector: Technology | |
| SubSector: Information Technology Services | |
| MarketCap: 1846.98 Millions | |
| Recent Price: 8.66 Smart Investing & Trading Score: 40 | |
| Day Percent Change: -8.02% Day Change: -0.64 | |
| Week Change: -7.67% Year-to-date Change: 54.9% | |
| VNET Links: Profile News Message Board | |
| Charts:- Daily , Weekly | |
| Add VNET to Watchlist: View: Get Complete VNET Trend Analysis ➞ | |
 | GOGO Gogo Inc. |
| Sector: Technology | |
| SubSector: Diversified Communication Services | |
| MarketCap: 307.064 Millions | |
| Recent Price: 10.98 Smart Investing & Trading Score: 20 | |
| Day Percent Change: -9.28% Day Change: -1.14 | |
| Week Change: -7.78% Year-to-date Change: 37.8% | |
| GOGO Links: Profile News Message Board | |
| Charts:- Daily , Weekly | |
| Add GOGO to Watchlist: View: Get Complete GOGO Trend Analysis ➞ | |
 | CSIQ Canadian Solar Inc. |
| Sector: Technology | |
| SubSector: Semiconductor - Specialized | |
| MarketCap: 957.96 Millions | |
| Recent Price: 9.78 Smart Investing & Trading Score: 10 | |
| Day Percent Change: -18.55% Day Change: -2.37 | |
| Week Change: -11.09% Year-to-date Change: -6.6% | |
| CSIQ Links: Profile News Message Board | |
| Charts:- Daily , Weekly | |
| Add CSIQ to Watchlist: View: Get Complete CSIQ Trend Analysis ➞ | |
 | QH Quhuo Limited |
| Sector: Technology | |
| SubSector: Software Application | |
| MarketCap: 37787 Millions | |
| Recent Price: 4.76 Smart Investing & Trading Score: 100 | |
| Day Percent Change: -40.21% Day Change: -0.04 | |
| Week Change: -45.57% Year-to-date Change: -95.8% | |
| QH Links: Profile News Message Board | |
| Charts:- Daily , Weekly | |
| Add QH to Watchlist: View: Get Complete QH Trend Analysis ➞ | |
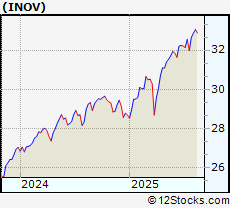 | INOV Inovalon Holdings, Inc. |
| Sector: Technology | |
| SubSector: Healthcare Information Services | |
| MarketCap: 2280.45 Millions | |
| Recent Price: 32.88 Smart Investing & Trading Score: 30 | |
| Day Percent Change: -100% Day Change: -32.94 | |
| Week Change: -100% Year-to-date Change: -100.0% | |
| INOV Links: Profile News Message Board | |
| Charts:- Daily , Weekly | |
| Add INOV to Watchlist: View: Get Complete INOV Trend Analysis ➞ | |
| For tabular summary view of above stock list: Summary View ➞ 0 - 25 , 25 - 50 , 50 - 75 , 75 - 100 , 100 - 125 , 125 - 150 , 150 - 175 , 175 - 200 , 200 - 225 , 225 - 250 , 250 - 275 , 275 - 300 , 300 - 325 , 325 - 350 , 350 - 375 , 375 - 400 , 400 - 425 , 425 - 450 , 450 - 475 , 475 - 500 , 500 - 525 , 525 - 550 , 550 - 575 , 575 - 600 | ||
| Click To Change The Sort Order: By Market Cap or Company Size Performance: Year-to-date, Week and Day | |
| Select Chart Type: | ||
|
Best Stocks Today 12Stocks.com |
© 2025 12Stocks.com Terms & Conditions Privacy Contact Us
All Information Provided Only For Education And Not To Be Used For Investing or Trading. See Terms & Conditions


One More Thing ... Get Best Stocks Delivered Daily!
Never Ever Miss A Move With Our Top Ten Stocks Lists
Find Best Stocks In Any Market - Bull or Bear Market
Take A Peek At Our Top Ten Stocks Lists: Daily, Weekly, Year-to-Date & Top Trends
Find Best Stocks In Any Market - Bull or Bear Market
Take A Peek At Our Top Ten Stocks Lists: Daily, Weekly, Year-to-Date & Top Trends
Technology Stocks With Best Up Trends [0-bearish to 100-bullish]: Full Truck[100], Inseego [100], Upwork [100], Globalstar [100], Rackspace [100], TELUS [100], Viavi [100], iQIYI [100], FiscalNote [100], Red Violet[100], Millicom [100]
Best Technology Stocks Year-to-Date:
So-Young [384.74%], Xunlei [264.32%], OptimizeRx [232.1%], Pagaya [220.45%], Viasat [212.75%], OneConnect Financial[205.35%], CommScope Holding[195.39%], Sify [187.76%], Robinhood Markets[185.29%], CuriosityStream [184.42%], nLIGHT [157.86%] Best Technology Stocks This Week:
Xunlei [43.56%], Upland Software[42.16%], Sunrun [40.65%], Array [37.99%], Shoals [25.49%], iQIYI [23.04%], Blend Labs[21.33%], Nextracker [18.61%], LivePerson [18.24%], SolarEdge [17.69%], Inseego [16.86%] Best Technology Stocks Daily:
Blend Labs[16.44%], Full Truck[9.81%], Viomi [9.39%], PubMatic [8.7%], Jiayin [8.41%], Applied Optoelectronics[8.07%], Hamilton Beach[7.24%], Gilat Satellite[6.85%], UP Fintech[6.65%], Alkami [6.33%], MaxLinear [6.17%]