
 Login Sign Up


| |||||
 |  | ||||

| 12Stocks.com Market Intelligence |
Best SmallCap Stocks
|
| In a hurry? Small Cap Stock Lists: Performance Trends Table, Stock Charts
Sort Small Cap stocks: Daily, Weekly, Year-to-Date, Market Cap & Trends. Filter Small Cap stocks list by sector: Show all, Tech, Finance, Energy, Staples, Retail, Industrial, Materials, Utilities and HealthCare Filter Small Cap stocks list by size: All Large Medium Small and MicroCap |
| 12Stocks.com Small Cap Stocks Performances & Trends Daily | |||||||||
|
|  The overall Smart Investing & Trading Score is 88 (0-bearish to 100-bullish) which puts Small Cap index in short term bullish trend. The Smart Investing & Trading Score from previous trading session is 70 and hence an improvement of trend.
| ||||||||
Here are the Smart Investing & Trading Scores of the most requested small cap stocks at 12Stocks.com (click stock name for detailed review):
|


| 12Stocks.com: Investing in Smallcap Index with Stocks | |
|
The following table helps investors and traders sort through current performance and trends (as measured by Smart Investing & Trading Score) of various
stocks in the Smallcap Index. Quick View: Move mouse or cursor over stock symbol (ticker) to view short-term technical chart and over stock name to view long term chart. Click on  to add stock symbol to your watchlist and to add stock symbol to your watchlist and  to view watchlist. Click on any ticker or stock name for detailed market intelligence report for that stock. to view watchlist. Click on any ticker or stock name for detailed market intelligence report for that stock. |
12Stocks.com Performance of Stocks in Smallcap Index
| Ticker | Stock Name | Watchlist | Category | Recent Price | Smart Investing & Trading Score | Change % | YTD Change% |
| KLTR | Kaltura |   | Technology | 1.25 | 27 | 3.75 | -36.48% |
| DAKT | Daktronics | | Technology | 11.65 | 95 | 3.56 | 37.38% |
| ARCT | Arcturus | | Health Care | 29.74 | 64 | 3.55 | -5.68% |
| RDW | Redwire | | Industrials | 5.00 | 73 | 3.52 | 75.44% |
| MHO | M/I Homes | | Industrials | 127.56 | 77 | 3.51 | -7.39% |
| LXFR | Luxfer | | Industrials | 12.15 | 95 | 3.49 | 35.91% |
| NN | NextNav | | Technology | 7.72 | 43 | 3.49 | 73.48% |
| BANC | Banc of California | | Financials | 13.99 | 5 | 3.48 | 4.17% |
| BSRR | Sierra Bancorp | | Financials | 22.57 | 75 | 3.44 | 0.09% |
| SNDX | Syndax | | Health Care | 21.68 | 8 | 3.41 | 0.35% |
| CATO | Cato | | Services & Goods | 5.17 | 62 | 3.40 | -27.59% |
| CIX | CompX | | Services & Goods | 22.00 | 0 | 3.38 | -12.97% |
| RBBN | Ribbon | | Technology | 3.23 | 71 | 3.35 | 11.55% |
| IPSC | Century | | Health Care | 3.10 | 35 | 3.33 | -6.06% |
| RC | Ready Capital | | Financials | 8.87 | 93 | 3.32 | -13.51% |
| PACK | Ranpak | | Industrials | 6.88 | 41 | 3.30 | 18.21% |
| NAUT | Nautilus | | Health Care | 2.82 | 58 | 3.30 | -14.29% |
| DSP | Viant | | Technology | 9.17 | 44 | 3.27 | 32.13% |
| VECO | Veeco Instruments | | Technology | 38.94 | 95 | 3.26 | 25.49% |
| HZO | MarineMax | | Services & Goods | 28.37 | 64 | 3.24 | -27.07% |
| VHI | Valhi | | Materials | 16.93 | 100 | 3.23 | 11.45% |
| BLBD | Blue Bird | | Consumer Staples | 50.33 | 100 | 3.22 | 86.68% |
| TDW | Tidewater | | Energy | 106.55 | 51 | 3.19 | 47.76% |
| VGAS | Verde Clean | | Utilities | 4.55 | 46 | 3.17 | 95.28% |
| LE | Lands | | Services & Goods | 13.93 | 51 | 3.11 | 45.71% |
| For chart view version of above stock list: Chart View ➞ 0 - 25 , 25 - 50 , 50 - 75 , 75 - 100 , 100 - 125 , 125 - 150 , 150 - 175 , 175 - 200 , 200 - 225 , 225 - 250 , 250 - 275 , 275 - 300 , 300 - 325 , 325 - 350 , 350 - 375 , 375 - 400 , 400 - 425 , 425 - 450 , 450 - 475 , 475 - 500 , 500 - 525 | ||
 | Click To Change The Sort Order: By Market Cap or Company Size Performance: Year-to-date, Week and Day |  |
| Too many stocks? View smallcap stocks filtered by marketcap & sector |
| Marketcap: All SmallCap Stocks (default-no microcap), Large, Mid-Range, Small |
| Smallcap Sector: Tech, Finance, Energy, Staples, Retail, Industrial, Materials, & Medical |
|
Get the most comprehensive stock market coverage daily at 12Stocks.com ➞ Best Stocks Today ➞ Best Stocks Weekly ➞ Best Stocks Year-to-Date ➞ Best Stocks Trends ➞  Best Stocks Today 12Stocks.com Best Nasdaq Stocks ➞ Best S&P 500 Stocks ➞ Best Tech Stocks ➞ Best Biotech Stocks ➞ |
| Detailed Overview of SmallCap Stocks |
| SmallCap Technical Overview, Leaders & Laggards, Top SmallCap ETF Funds & Detailed SmallCap Stocks List, Charts, Trends & More |
| Smallcap: Technical Analysis, Trends & YTD Performance | |
| SmallCap segment as represented by
IWM, an exchange-traded fund [ETF], holds basket of thousands of smallcap stocks from across all major sectors of the US stock market. The smallcap index (contains stocks like Riverbed & Sotheby's) is up by 3.06% and is currently underperforming the overall market by -6.31% year-to-date. Below is a quick view of technical charts and trends: | |
 IWM Weekly Chart |
|
| Long Term Trend: Very Good | |
| Medium Term Trend: Very Good | |
 IWM Daily Chart |
|
| Short Term Trend: Very Good | |
| Overall Trend Score: 88 | |
| YTD Performance: 3.06% | |
| **Trend Scores & Views Are Only For Educational Purposes And Not For Investing | |
| 12Stocks.com: Top Performing Small Cap Index Stocks | ||||||||||||||||||||||||||||||||||||||||||||||||
 The top performing Small Cap Index stocks year to date are
Now, more recently, over last week, the top performing Small Cap Index stocks on the move are


|
||||||||||||||||||||||||||||||||||||||||||||||||
| 12Stocks.com: Investing in Smallcap Index using Exchange Traded Funds | |
|
The following table shows list of key exchange traded funds (ETF) that
help investors track Smallcap index. The following list also includes leveraged ETF funds that track twice or thrice the daily returns of Smallcap indices. Short or inverse ETF funds move in the opposite direction to the index they track and are useful during market pullbacks or during bear markets. Quick View: Move mouse or cursor over ETF symbol (ticker) to view short-term technical chart and over ETF name to view long term chart. Click on ticker or stock name for detailed view. Click on to add stock symbol to your watchlist and to view watchlist. |
12Stocks.com List of ETFs that track Smallcap Index
| Ticker | ETF Name | Watchlist | Recent Price | Smart Investing & Trading Score | Change % | Week % | Year-to-date % |
| IWM | iShares Russell 2000 | | 206.86 | 88 | 1.04 | 1.25 | 3.06% |
| IJR | iShares Core S&P Small-Cap | | 110.40 | 95 | 1.00 | 1.3 | 1.99% |
| IWN | iShares Russell 2000 Value | | 157.81 | 88 | 0.97 | 1.04 | 1.6% |
| VTWO | Vanguard Russell 2000 ETF | | 83.50 | 70 | 0.89 | 1.06 | 2.96% |
| IWO | iShares Russell 2000 Growth | | 263.49 | 70 | 1.14 | 1.37 | 4.47% |
| IJS | iShares S&P Small-Cap 600 Value | | 102.21 | 100 | 1.25 | 1.68 | -0.83% |
| IJT | iShares S&P Small-Cap 600 Growth | | 130.72 | 83 | 0.58 | 0.66 | 4.46% |
| SMLV | SPDR SSGA US Small Cap Low Volatil ETF | | 111.65 | 76 | 0.22 | 0.39 | -0.77% |
| XSLV | PowerShares S&P SmallCap Low Volatil ETF | | 44.33 | 83 | -0.42 | 0.21 | 0.4% |
| SAA | ProShares Ultra SmallCap600 | | 24.98 | 90 | 1.50 | 2.59 | 0.12% |
| SBB | ProShares Short SmallCap600 | | 15.77 | 0 | -0.79 | -1.16 | -1% |
| SDD | ProShares UltraShort SmallCap600 | | 17.89 | 28 | -1.47 | -2.14 | -2.92% |
| 12Stocks.com: Charts, Trends, Fundamental Data and Performances of SmallCap Stocks | |
|
We now take in-depth look at all SmallCap stocks including charts, multi-period performances and overall trends (as measured by Smart Investing & Trading Score). One can sort SmallCap stocks (click link to choose) by Daily, Weekly and by Year-to-Date performances. Also, one can sort by size of the company or by market capitalization. |
| Select Your Default Chart Type: | |||||
| |||||
| Click on stock symbol or name for detailed view. Click on to add stock symbol to your watchlist and to view watchlist. Quick View: Move mouse or cursor over "Daily" to quickly view daily technical stock chart and over "Weekly" to view weekly technical stock chart. | |||||

 | KLTR Kaltura, Inc. |
| Sector: Technology | |
| SubSector: Software - Application | |
| MarketCap: 293 Millions | |
| Recent Price: 1.25 Smart Investing & Trading Score: 27 | |
| Day Percent Change: 3.75% Day Change: 0.05 | |
| Week Change: 3.75% Year-to-date Change: -36.5% | |
| KLTR Links: Profile News Message Board | |
| Charts:- Daily , Weekly | |
| Add KLTR to Watchlist: View: Get Complete KLTR Trend Analysis ➞ | |
 | DAKT Daktronics, Inc. |
| Sector: Technology | |
| SubSector: Computer Based Systems | |
| MarketCap: 223.539 Millions | |
| Recent Price: 11.65 Smart Investing & Trading Score: 95 | |
| Day Percent Change: 3.56% Day Change: 0.40 | |
| Week Change: 3.28% Year-to-date Change: 37.4% | |
| DAKT Links: Profile News Message Board | |
| Charts:- Daily , Weekly | |
| Add DAKT to Watchlist: View: Get Complete DAKT Trend Analysis ➞ | |
 | ARCT Arcturus Therapeutics Holdings Inc. |
| Sector: Health Care | |
| SubSector: Biotechnology | |
| MarketCap: 241.385 Millions | |
| Recent Price: 29.74 Smart Investing & Trading Score: 64 | |
| Day Percent Change: 3.55% Day Change: 1.02 | |
| Week Change: 9.1% Year-to-date Change: -5.7% | |
| ARCT Links: Profile News Message Board | |
| Charts:- Daily , Weekly | |
| Add ARCT to Watchlist: View: Get Complete ARCT Trend Analysis ➞ | |
 | RDW Redwire Corporation |
| Sector: Industrials | |
| SubSector: Aerospace & Defense | |
| MarketCap: 160 Millions | |
| Recent Price: 5.00 Smart Investing & Trading Score: 73 | |
| Day Percent Change: 3.52% Day Change: 0.17 | |
| Week Change: 7.07% Year-to-date Change: 75.4% | |
| RDW Links: Profile News Message Board | |
| Charts:- Daily , Weekly | |
| Add RDW to Watchlist: View: Get Complete RDW Trend Analysis ➞ | |
 | MHO M/I Homes, Inc. |
| Sector: Industrials | |
| SubSector: Residential Construction | |
| MarketCap: 437.106 Millions | |
| Recent Price: 127.56 Smart Investing & Trading Score: 77 | |
| Day Percent Change: 3.51% Day Change: 4.33 | |
| Week Change: 3.36% Year-to-date Change: -7.4% | |
| MHO Links: Profile News Message Board | |
| Charts:- Daily , Weekly | |
| Add MHO to Watchlist: View: Get Complete MHO Trend Analysis ➞ | |
 | LXFR Luxfer Holdings PLC |
| Sector: Industrials | |
| SubSector: Diversified Machinery | |
| MarketCap: 406.716 Millions | |
| Recent Price: 12.15 Smart Investing & Trading Score: 95 | |
| Day Percent Change: 3.49% Day Change: 0.41 | |
| Week Change: 4.74% Year-to-date Change: 35.9% | |
| LXFR Links: Profile News Message Board | |
| Charts:- Daily , Weekly | |
| Add LXFR to Watchlist: View: Get Complete LXFR Trend Analysis ➞ | |
 | NN NextNav Inc. |
| Sector: Technology | |
| SubSector: Software - Infrastructure | |
| MarketCap: 314 Millions | |
| Recent Price: 7.72 Smart Investing & Trading Score: 43 | |
| Day Percent Change: 3.49% Day Change: 0.26 | |
| Week Change: 3.07% Year-to-date Change: 73.5% | |
| NN Links: Profile News Message Board | |
| Charts:- Daily , Weekly | |
| Add NN to Watchlist: View: Get Complete NN Trend Analysis ➞ | |
 | BANC Banc of California, Inc. |
| Sector: Financials | |
| SubSector: Regional - Pacific Banks | |
| MarketCap: 459.929 Millions | |
| Recent Price: 13.99 Smart Investing & Trading Score: 5 | |
| Day Percent Change: 3.48% Day Change: 0.47 | |
| Week Change: -7.23% Year-to-date Change: 4.2% | |
| BANC Links: Profile News Message Board | |
| Charts:- Daily , Weekly | |
| Add BANC to Watchlist: View: Get Complete BANC Trend Analysis ➞ | |
 | BSRR Sierra Bancorp |
| Sector: Financials | |
| SubSector: Regional - Pacific Banks | |
| MarketCap: 256.929 Millions | |
| Recent Price: 22.57 Smart Investing & Trading Score: 75 | |
| Day Percent Change: 3.44% Day Change: 0.75 | |
| Week Change: 2.31% Year-to-date Change: 0.1% | |
| BSRR Links: Profile News Message Board | |
| Charts:- Daily , Weekly | |
| Add BSRR to Watchlist: View: Get Complete BSRR Trend Analysis ➞ | |
 | SNDX Syndax Pharmaceuticals, Inc. |
| Sector: Health Care | |
| SubSector: Biotechnology | |
| MarketCap: 365.985 Millions | |
| Recent Price: 21.68 Smart Investing & Trading Score: 8 | |
| Day Percent Change: 3.41% Day Change: 0.71 | |
| Week Change: -0.3% Year-to-date Change: 0.4% | |
| SNDX Links: Profile News Message Board | |
| Charts:- Daily , Weekly | |
| Add SNDX to Watchlist: View: Get Complete SNDX Trend Analysis ➞ | |
 | CATO The Cato Corporation |
| Sector: Services & Goods | |
| SubSector: Apparel Stores | |
| MarketCap: 305.208 Millions | |
| Recent Price: 5.17 Smart Investing & Trading Score: 62 | |
| Day Percent Change: 3.40% Day Change: 0.17 | |
| Week Change: 6.38% Year-to-date Change: -27.6% | |
| CATO Links: Profile News Message Board | |
| Charts:- Daily , Weekly | |
| Add CATO to Watchlist: View: Get Complete CATO Trend Analysis ➞ | |
 | CIX CompX International Inc. |
| Sector: Services & Goods | |
| SubSector: Security & Protection Services | |
| MarketCap: 189.603 Millions | |
| Recent Price: 22.00 Smart Investing & Trading Score: 0 | |
| Day Percent Change: 3.38% Day Change: 0.72 | |
| Week Change: -11.82% Year-to-date Change: -13.0% | |
| CIX Links: Profile News Message Board | |
| Charts:- Daily , Weekly | |
| Add CIX to Watchlist: View: Get Complete CIX Trend Analysis ➞ | |
 | RBBN Ribbon Communications Inc. |
| Sector: Technology | |
| SubSector: Telecom Services - Domestic | |
| MarketCap: 284.577 Millions | |
| Recent Price: 3.23 Smart Investing & Trading Score: 71 | |
| Day Percent Change: 3.35% Day Change: 0.10 | |
| Week Change: 2.37% Year-to-date Change: 11.6% | |
| RBBN Links: Profile News Message Board | |
| Charts:- Daily , Weekly | |
| Add RBBN to Watchlist: View: Get Complete RBBN Trend Analysis ➞ | |
 | IPSC Century Therapeutics, Inc. |
| Sector: Health Care | |
| SubSector: Biotechnology | |
| MarketCap: 187 Millions | |
| Recent Price: 3.10 Smart Investing & Trading Score: 35 | |
| Day Percent Change: 3.33% Day Change: 0.10 | |
| Week Change: -0.96% Year-to-date Change: -6.1% | |
| IPSC Links: Profile News Message Board | |
| Charts:- Daily , Weekly | |
| Add IPSC to Watchlist: View: Get Complete IPSC Trend Analysis ➞ | |
 | RC Ready Capital Corporation |
| Sector: Financials | |
| SubSector: Mortgage Investment | |
| MarketCap: 358.039 Millions | |
| Recent Price: 8.87 Smart Investing & Trading Score: 93 | |
| Day Percent Change: 3.32% Day Change: 0.29 | |
| Week Change: 5.91% Year-to-date Change: -13.5% | |
| RC Links: Profile News Message Board | |
| Charts:- Daily , Weekly | |
| Add RC to Watchlist: View: Get Complete RC Trend Analysis ➞ | |
 | PACK Ranpak Holdings Corp. |
| Sector: Industrials | |
| SubSector: Conglomerates | |
| MarketCap: 492.648 Millions | |
| Recent Price: 6.88 Smart Investing & Trading Score: 41 | |
| Day Percent Change: 3.30% Day Change: 0.22 | |
| Week Change: 1.78% Year-to-date Change: 18.2% | |
| PACK Links: Profile News Message Board | |
| Charts:- Daily , Weekly | |
| Add PACK to Watchlist: View: Get Complete PACK Trend Analysis ➞ | |
 | NAUT Nautilus Biotechnology, Inc. |
| Sector: Health Care | |
| SubSector: Biotechnology | |
| MarketCap: 458 Millions | |
| Recent Price: 2.82 Smart Investing & Trading Score: 58 | |
| Day Percent Change: 3.30% Day Change: 0.09 | |
| Week Change: 2.92% Year-to-date Change: -14.3% | |
| NAUT Links: Profile News Message Board | |
| Charts:- Daily , Weekly | |
| Add NAUT to Watchlist: View: Get Complete NAUT Trend Analysis ➞ | |
 | DSP Viant Technology Inc. |
| Sector: Technology | |
| SubSector: Software - Application | |
| MarketCap: 279 Millions | |
| Recent Price: 9.17 Smart Investing & Trading Score: 44 | |
| Day Percent Change: 3.27% Day Change: 0.29 | |
| Week Change: 5.4% Year-to-date Change: 32.1% | |
| DSP Links: Profile News Message Board | |
| Charts:- Daily , Weekly | |
| Add DSP to Watchlist: View: Get Complete DSP Trend Analysis ➞ | |
 | VECO Veeco Instruments Inc. |
| Sector: Technology | |
| SubSector: Semiconductor Equipment & Materials | |
| MarketCap: 450.718 Millions | |
| Recent Price: 38.94 Smart Investing & Trading Score: 95 | |
| Day Percent Change: 3.26% Day Change: 1.23 | |
| Week Change: 2.45% Year-to-date Change: 25.5% | |
| VECO Links: Profile News Message Board | |
| Charts:- Daily , Weekly | |
| Add VECO to Watchlist: View: Get Complete VECO Trend Analysis ➞ | |
 | HZO MarineMax, Inc. |
| Sector: Services & Goods | |
| SubSector: Specialty Retail, Other | |
| MarketCap: 234.744 Millions | |
| Recent Price: 28.37 Smart Investing & Trading Score: 64 | |
| Day Percent Change: 3.24% Day Change: 0.89 | |
| Week Change: 5.98% Year-to-date Change: -27.1% | |
| HZO Links: Profile News Message Board | |
| Charts:- Daily , Weekly | |
| Add HZO to Watchlist: View: Get Complete HZO Trend Analysis ➞ | |
 | VHI Valhi, Inc. |
| Sector: Materials | |
| SubSector: Chemicals - Major Diversified | |
| MarketCap: 394.336 Millions | |
| Recent Price: 16.93 Smart Investing & Trading Score: 100 | |
| Day Percent Change: 3.23% Day Change: 0.53 | |
| Week Change: 6.68% Year-to-date Change: 11.5% | |
| VHI Links: Profile News Message Board | |
| Charts:- Daily , Weekly | |
| Add VHI to Watchlist: View: Get Complete VHI Trend Analysis ➞ | |
 | BLBD Blue Bird Corporation |
| Sector: Consumer Staples | |
| SubSector: Auto Manufacturers - Major | |
| MarketCap: 345.371 Millions | |
| Recent Price: 50.33 Smart Investing & Trading Score: 100 | |
| Day Percent Change: 3.22% Day Change: 1.57 | |
| Week Change: 3.26% Year-to-date Change: 86.7% | |
| BLBD Links: Profile News Message Board | |
| Charts:- Daily , Weekly | |
| Add BLBD to Watchlist: View: Get Complete BLBD Trend Analysis ➞ | |
 | TDW Tidewater Inc. |
| Sector: Energy | |
| SubSector: Oil & Gas Equipment & Services | |
| MarketCap: 295.061 Millions | |
| Recent Price: 106.55 Smart Investing & Trading Score: 51 | |
| Day Percent Change: 3.19% Day Change: 3.29 | |
| Week Change: 1.71% Year-to-date Change: 47.8% | |
| TDW Links: Profile News Message Board | |
| Charts:- Daily , Weekly | |
| Add TDW to Watchlist: View: Get Complete TDW Trend Analysis ➞ | |
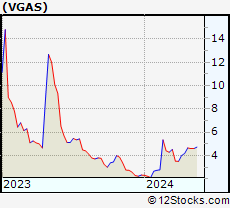 | VGAS Verde Clean Fuels, Inc. |
| Sector: Utilities | |
| SubSector: Utilities - Renewable | |
| MarketCap: 204 Millions | |
| Recent Price: 4.55 Smart Investing & Trading Score: 46 | |
| Day Percent Change: 3.17% Day Change: 0.14 | |
| Week Change: -0.87% Year-to-date Change: 95.3% | |
| VGAS Links: Profile News Message Board | |
| Charts:- Daily , Weekly | |
| Add VGAS to Watchlist: View: Get Complete VGAS Trend Analysis ➞ | |
 | LE Lands End, Inc. |
| Sector: Services & Goods | |
| SubSector: Catalog & Mail Order Houses | |
| MarketCap: 268.692 Millions | |
| Recent Price: 13.93 Smart Investing & Trading Score: 51 | |
| Day Percent Change: 3.11% Day Change: 0.42 | |
| Week Change: -6.89% Year-to-date Change: 45.7% | |
| LE Links: Profile News Message Board | |
| Charts:- Daily , Weekly | |
| Add LE to Watchlist: View: Get Complete LE Trend Analysis ➞ | |
| For tabular summary view of above stock list: Summary View ➞ 0 - 25 , 25 - 50 , 50 - 75 , 75 - 100 , 100 - 125 , 125 - 150 , 150 - 175 , 175 - 200 , 200 - 225 , 225 - 250 , 250 - 275 , 275 - 300 , 300 - 325 , 325 - 350 , 350 - 375 , 375 - 400 , 400 - 425 , 425 - 450 , 450 - 475 , 475 - 500 , 500 - 525 | ||
| Click To Change The Sort Order: By Market Cap or Company Size Performance: Year-to-date, Week and Day | |
| Select Chart Type: | ||
| Too many stocks? View smallcap stocks filtered by marketcap & sector |
| Marketcap: All SmallCap Stocks (default-no microcap), Large, Mid-Range, Small & MicroCap |
| Sector: Tech, Finance, Energy, Staples, Retail, Industrial, Materials, Utilities & Medical |
|
Best Stocks Today 12Stocks.com |
© 2024 12Stocks.com Terms & Conditions Privacy Contact Us
All Information Provided Only For Education And Not To Be Used For Investing or Trading. See Terms & Conditions


One More Thing ... Get Best Stocks Delivered Daily!
Never Ever Miss A Move With Our Top Ten Stocks Lists
Find Best Stocks In Any Market - Bull or Bear Market
Take A Peek At Our Top Ten Stocks Lists: Daily, Weekly, Year-to-Date & Top Trends
Find Best Stocks In Any Market - Bull or Bear Market
Take A Peek At Our Top Ten Stocks Lists: Daily, Weekly, Year-to-Date & Top Trends
Smallcap Stocks With Best Up Trends [0-bearish to 100-bullish]: SunPower [100], Harrow Health[100], ProKidney [100], Fossil Group[100], Infinera [100], Agilysys [100], Tucows [100], Actinium [100], Arbor Realty[100], Funko [100], Pitney Bowes[100]
Best Smallcap Stocks Year-to-Date:
CareMax [477.32%], Bakkt [400%], Janux [345.93%], Viking [289.47%], Alpine Immune[241.07%], Longboard [232.98%], Avidity Biosciences[219.69%], Super Micro[189.32%], Sweetgreen [182.92%], Novavax [181.04%], Vera [163.89%] Best Smallcap Stocks This Week:
SunPower [91.3%], Maxeon Solar[70.28%], Novavax [51.91%], ProKidney [45.91%], Harrow Health[40.09%], LivePerson [38.44%], Humacyte [36.17%], MacroGenics [34.44%], Big Lots[32.3%], Virgin Galactic[29.63%], Sunnova Energy[29.56%] Best Smallcap Stocks Daily:
SunPower [60.00%], Maxeon Solar[49.60%], Harrow Health[34.63%], ProKidney [33.12%], Sunnova Energy[27.39%], Big Lots[26.95%], Generation Bio[24.65%], FuelCell Energy[23.35%], Virgin Galactic[22.12%], Paysafe [20.23%], LivePerson [20.18%]