
 Login Sign Up


| |||||
 |  | ||||

| 12Stocks.com Market Intelligence |
Best SmallCap Stocks
|
| In a hurry? Small Cap Stock Lists: Performance Trends Table, Stock Charts
Sort Small Cap stocks: Daily, Weekly, Year-to-Date, Market Cap & Trends. Filter Small Cap stocks list by sector: Show all, Tech, Finance, Energy, Staples, Retail, Industrial, Materials, Utilities and HealthCare Filter Small Cap stocks list by size: All Large Medium Small and MicroCap |
| 12Stocks.com Small Cap Stocks Performances & Trends Daily | |||||||||
|
|  The overall Smart Investing & Trading Score is 70 (0-bearish to 100-bullish) which puts Small Cap index in short term neutral to bullish trend. The Smart Investing & Trading Score from previous trading session is 65 and hence an improvement of trend.
| ||||||||
Here are the Smart Investing & Trading Scores of the most requested small cap stocks at 12Stocks.com (click stock name for detailed review):
|


| 12Stocks.com: Investing in Smallcap Index with Stocks | |
|
The following table helps investors and traders sort through current performance and trends (as measured by Smart Investing & Trading Score) of various
stocks in the Smallcap Index. Quick View: Move mouse or cursor over stock symbol (ticker) to view short-term technical chart and over stock name to view long term chart. Click on  to add stock symbol to your watchlist and to add stock symbol to your watchlist and  to view watchlist. Click on any ticker or stock name for detailed market intelligence report for that stock. to view watchlist. Click on any ticker or stock name for detailed market intelligence report for that stock. |
12Stocks.com Performance of Stocks in Smallcap Index
| Ticker | Stock Name | Watchlist | Category | Recent Price | Smart Investing & Trading Score | Change % | YTD Change% |
| TSBK | Timberland Bancorp |   | Financials | 25.33 | 18 | -3.02 | -19.49% |
| VSTO | Vista Outdoor | | Consumer Staples | 34.47 | 36 | -3.17 | 16.57% |
| ATEC | Alphatec | | Health Care | 11.15 | 22 | -3.21 | -26.21% |
| TRUE | TrueCar | | Technology | 2.70 | 10 | -3.23 | -21.97% |
| GAMB | Gambling.com Group | | Services & Goods | 8.83 | 25 | -3.23 | -9.53% |
| KZR | Kezar Life | | Health Care | 0.75 | 10 | -3.26 | -21.10% |
| ACRV | Acrivon | | Health Care | 8.48 | 83 | -3.31 | 70.62% |
| MRSN | Mersana | | Health Care | 2.62 | 7 | -3.32 | 12.93% |
| AKYA | Akoya Biosciences | | Health Care | 4.12 | 43 | -3.40 | -15.75% |
| AVTE | Aerovate | | Health Care | 19.14 | 0 | -3.48 | -15.20% |
| SNDX | Syndax | | Health Care | 20.97 | 8 | -3.59 | -2.96% |
| SSBK | Southern States | | Financials | 25.90 | 61 | -3.86 | -12.02% |
| VGAS | Verde Clean | | Utilities | 4.41 | 36 | -3.92 | 89.27% |
| METCB | Ramaco Resources | | Materials | 10.76 | 0 | -3.93 | -18.79% |
| STRS | Stratus Properties | | Financials | 22.60 | 44 | -3.95 | -21.69% |
| BCBP | BCB Bancorp | | Financials | 10.09 | 42 | -4.00 | -21.48% |
| OPTN | OptiNose | | Health Care | 1.17 | 54 | -4.10 | -9.30% |
| IPSC | Century | | Health Care | 3.00 | 30 | -4.15 | -9.09% |
| VALU | Value Line | | Services & Goods | 38.02 | 50 | -4.45 | -22.01% |
| MYRG | MYR Group | | Industrials | 153.48 | 0 | -4.49 | 6.12% |
| BWMN | Bowman Consulting | | Industrials | 30.35 | 0 | -4.59 | -13.80% |
| POWL | Powell Industries | | Industrials | 160.42 | 42 | -4.64 | 81.47% |
| EWTX | Edgewise | | Health Care | 17.48 | 46 | -4.64 | 54.01% |
| PKE | Park Aerospace | | Technology | 14.08 | 0 | -4.74 | -4.22% |
| ODC | Oil-Dri | | Materials | 78.34 | 63 | -4.75 | 16.79% |
| For chart view version of above stock list: Chart View ➞ 0 - 25 , 25 - 50 , 50 - 75 , 75 - 100 , 100 - 125 , 125 - 150 , 150 - 175 , 175 - 200 , 200 - 225 , 225 - 250 , 250 - 275 , 275 - 300 , 300 - 325 , 325 - 350 , 350 - 375 , 375 - 400 , 400 - 425 , 425 - 450 , 450 - 475 , 475 - 500 , 500 - 525 | ||
 | Click To Change The Sort Order: By Market Cap or Company Size Performance: Year-to-date, Week and Day |  |
| Too many stocks? View smallcap stocks filtered by marketcap & sector |
| Marketcap: All SmallCap Stocks (default-no microcap), Large, Mid-Range, Small |
| Smallcap Sector: Tech, Finance, Energy, Staples, Retail, Industrial, Materials, & Medical |
|
Get the most comprehensive stock market coverage daily at 12Stocks.com ➞ Best Stocks Today ➞ Best Stocks Weekly ➞ Best Stocks Year-to-Date ➞ Best Stocks Trends ➞  Best Stocks Today 12Stocks.com Best Nasdaq Stocks ➞ Best S&P 500 Stocks ➞ Best Tech Stocks ➞ Best Biotech Stocks ➞ |
| Detailed Overview of SmallCap Stocks |
| SmallCap Technical Overview, Leaders & Laggards, Top SmallCap ETF Funds & Detailed SmallCap Stocks List, Charts, Trends & More |
| Smallcap: Technical Analysis, Trends & YTD Performance | |
| SmallCap segment as represented by
IWM, an exchange-traded fund [ETF], holds basket of thousands of smallcap stocks from across all major sectors of the US stock market. The smallcap index (contains stocks like Riverbed & Sotheby's) is up by 2.01% and is currently underperforming the overall market by -6.83% year-to-date. Below is a quick view of technical charts and trends: | |
 IWM Weekly Chart |
|
| Long Term Trend: Very Good | |
| Medium Term Trend: Very Good | |
 IWM Daily Chart |
|
| Short Term Trend: Good | |
| Overall Trend Score: 70 | |
| YTD Performance: 2.01% | |
| **Trend Scores & Views Are Only For Educational Purposes And Not For Investing | |
| 12Stocks.com: Top Performing Small Cap Index Stocks | ||||||||||||||||||||||||||||||||||||||||||||||||
 The top performing Small Cap Index stocks year to date are
Now, more recently, over last week, the top performing Small Cap Index stocks on the move are


|
||||||||||||||||||||||||||||||||||||||||||||||||
| 12Stocks.com: Investing in Smallcap Index using Exchange Traded Funds | |
|
The following table shows list of key exchange traded funds (ETF) that
help investors track Smallcap index. The following list also includes leveraged ETF funds that track twice or thrice the daily returns of Smallcap indices. Short or inverse ETF funds move in the opposite direction to the index they track and are useful during market pullbacks or during bear markets. Quick View: Move mouse or cursor over ETF symbol (ticker) to view short-term technical chart and over ETF name to view long term chart. Click on ticker or stock name for detailed view. Click on to add stock symbol to your watchlist and to view watchlist. |
12Stocks.com List of ETFs that track Smallcap Index
| Ticker | ETF Name | Watchlist | Recent Price | Smart Investing & Trading Score | Change % | Week % | Year-to-date % |
| IWM | iShares Russell 2000 | | 204.74 | 70 | 0.21 | 0.21 | 2.01% |
| IJR | iShares Core S&P Small-Cap | | 109.31 | 90 | 0.30 | 0.3 | 0.98% |
| VTWO | Vanguard Russell 2000 ETF | | 82.76 | 65 | 0.16 | 0.16 | 2.05% |
| IWN | iShares Russell 2000 Value | | 156.30 | 83 | 0.07 | 0.07 | 0.62% |
| IWO | iShares Russell 2000 Growth | | 260.53 | 52 | 0.23 | 0.23 | 3.29% |
| IJS | iShares S&P Small-Cap 600 Value | | 100.95 | 77 | 0.43 | 0.43 | -2.06% |
| IJT | iShares S&P Small-Cap 600 Growth | | 129.96 | 85 | 0.08 | 0.08 | 3.85% |
| XSLV | PowerShares S&P SmallCap Low Volatil ETF | | 44.51 | 95 | 0.63 | 0.63 | 0.82% |
| SMLV | SPDR SSGA US Small Cap Low Volatil ETF | | 111.41 | 90 | 0.17 | 0.17 | -0.99% |
| SDD | ProShares UltraShort SmallCap600 | | 18.16 | 20 | -0.68 | -0.68 | -1.47% |
| SAA | ProShares Ultra SmallCap600 | | 24.61 | 90 | 1.07 | 1.07 | -1.36% |
| SBB | ProShares Short SmallCap600 | | 15.90 | 10 | -0.37 | -0.37 | -0.21% |
| 12Stocks.com: Charts, Trends, Fundamental Data and Performances of SmallCap Stocks | |
|
We now take in-depth look at all SmallCap stocks including charts, multi-period performances and overall trends (as measured by Smart Investing & Trading Score). One can sort SmallCap stocks (click link to choose) by Daily, Weekly and by Year-to-Date performances. Also, one can sort by size of the company or by market capitalization. |
| Select Your Default Chart Type: | |||||
| |||||
| Click on stock symbol or name for detailed view. Click on to add stock symbol to your watchlist and to view watchlist. Quick View: Move mouse or cursor over "Daily" to quickly view daily technical stock chart and over "Weekly" to view weekly technical stock chart. | |||||

 | TSBK Timberland Bancorp, Inc. |
| Sector: Financials | |
| SubSector: Savings & Loans | |
| MarketCap: 155.03 Millions | |
| Recent Price: 25.33 Smart Investing & Trading Score: 18 | |
| Day Percent Change: -3.02% Day Change: -0.79 | |
| Week Change: -3.02% Year-to-date Change: -19.5% | |
| TSBK Links: Profile News Message Board | |
| Charts:- Daily , Weekly | |
| Add TSBK to Watchlist: View: Get Complete TSBK Trend Analysis ➞ | |
 | VSTO Vista Outdoor Inc. |
| Sector: Consumer Staples | |
| SubSector: Sporting Goods | |
| MarketCap: 405.144 Millions | |
| Recent Price: 34.47 Smart Investing & Trading Score: 36 | |
| Day Percent Change: -3.17% Day Change: -1.13 | |
| Week Change: -3.17% Year-to-date Change: 16.6% | |
| VSTO Links: Profile News Message Board | |
| Charts:- Daily , Weekly | |
| Add VSTO to Watchlist: View: Get Complete VSTO Trend Analysis ➞ | |
 | ATEC Alphatec Holdings, Inc. |
| Sector: Health Care | |
| SubSector: Medical Instruments & Supplies | |
| MarketCap: 181.16 Millions | |
| Recent Price: 11.15 Smart Investing & Trading Score: 22 | |
| Day Percent Change: -3.21% Day Change: -0.37 | |
| Week Change: -3.21% Year-to-date Change: -26.2% | |
| ATEC Links: Profile News Message Board | |
| Charts:- Daily , Weekly | |
| Add ATEC to Watchlist: View: Get Complete ATEC Trend Analysis ➞ | |
 | TRUE TrueCar, Inc. |
| Sector: Technology | |
| SubSector: Internet Service Providers | |
| MarketCap: 244.18 Millions | |
| Recent Price: 2.70 Smart Investing & Trading Score: 10 | |
| Day Percent Change: -3.23% Day Change: -0.09 | |
| Week Change: -3.23% Year-to-date Change: -22.0% | |
| TRUE Links: Profile News Message Board | |
| Charts:- Daily , Weekly | |
| Add TRUE to Watchlist: View: Get Complete TRUE Trend Analysis ➞ | |
 | GAMB Gambling.com Group Limited |
| Sector: Services & Goods | |
| SubSector: Gambling | |
| MarketCap: 376 Millions | |
| Recent Price: 8.83 Smart Investing & Trading Score: 25 | |
| Day Percent Change: -3.23% Day Change: -0.29 | |
| Week Change: -3.23% Year-to-date Change: -9.5% | |
| GAMB Links: Profile News Message Board | |
| Charts:- Daily , Weekly | |
| Add GAMB to Watchlist: View: Get Complete GAMB Trend Analysis ➞ | |
 | KZR Kezar Life Sciences, Inc. |
| Sector: Health Care | |
| SubSector: Biotechnology | |
| MarketCap: 174.885 Millions | |
| Recent Price: 0.75 Smart Investing & Trading Score: 10 | |
| Day Percent Change: -3.26% Day Change: -0.03 | |
| Week Change: -3.26% Year-to-date Change: -21.1% | |
| KZR Links: Profile News Message Board | |
| Charts:- Daily , Weekly | |
| Add KZR to Watchlist: View: Get Complete KZR Trend Analysis ➞ | |
 | ACRV Acrivon Therapeutics, Inc. |
| Sector: Health Care | |
| SubSector: Biotechnology | |
| MarketCap: 286 Millions | |
| Recent Price: 8.48 Smart Investing & Trading Score: 83 | |
| Day Percent Change: -3.31% Day Change: -0.29 | |
| Week Change: -3.31% Year-to-date Change: 70.6% | |
| ACRV Links: Profile News Message Board | |
| Charts:- Daily , Weekly | |
| Add ACRV to Watchlist: View: Get Complete ACRV Trend Analysis ➞ | |
 | MRSN Mersana Therapeutics, Inc. |
| Sector: Health Care | |
| SubSector: Biotechnology | |
| MarketCap: 224.385 Millions | |
| Recent Price: 2.62 Smart Investing & Trading Score: 7 | |
| Day Percent Change: -3.32% Day Change: -0.09 | |
| Week Change: -3.32% Year-to-date Change: 12.9% | |
| MRSN Links: Profile News Message Board | |
| Charts:- Daily , Weekly | |
| Add MRSN to Watchlist: View: Get Complete MRSN Trend Analysis ➞ | |
 | AKYA Akoya Biosciences, Inc. |
| Sector: Health Care | |
| SubSector: Medical Instruments & Supplies | |
| MarketCap: 340 Millions | |
| Recent Price: 4.12 Smart Investing & Trading Score: 43 | |
| Day Percent Change: -3.40% Day Change: -0.14 | |
| Week Change: -3.4% Year-to-date Change: -15.8% | |
| AKYA Links: Profile News Message Board | |
| Charts:- Daily , Weekly | |
| Add AKYA to Watchlist: View: Get Complete AKYA Trend Analysis ➞ | |
 | AVTE Aerovate Therapeutics, Inc. |
| Sector: Health Care | |
| SubSector: Biotechnology | |
| MarketCap: 478 Millions | |
| Recent Price: 19.14 Smart Investing & Trading Score: 0 | |
| Day Percent Change: -3.48% Day Change: -0.69 | |
| Week Change: -3.48% Year-to-date Change: -15.2% | |
| AVTE Links: Profile News Message Board | |
| Charts:- Daily , Weekly | |
| Add AVTE to Watchlist: View: Get Complete AVTE Trend Analysis ➞ | |
 | SNDX Syndax Pharmaceuticals, Inc. |
| Sector: Health Care | |
| SubSector: Biotechnology | |
| MarketCap: 365.985 Millions | |
| Recent Price: 20.97 Smart Investing & Trading Score: 8 | |
| Day Percent Change: -3.59% Day Change: -0.78 | |
| Week Change: -3.59% Year-to-date Change: -3.0% | |
| SNDX Links: Profile News Message Board | |
| Charts:- Daily , Weekly | |
| Add SNDX to Watchlist: View: Get Complete SNDX Trend Analysis ➞ | |
 | SSBK Southern States Bancshares, Inc. |
| Sector: Financials | |
| SubSector: Banks - Regional | |
| MarketCap: 187 Millions | |
| Recent Price: 25.90 Smart Investing & Trading Score: 61 | |
| Day Percent Change: -3.86% Day Change: -1.04 | |
| Week Change: -3.86% Year-to-date Change: -12.0% | |
| SSBK Links: Profile News Message Board | |
| Charts:- Daily , Weekly | |
| Add SSBK to Watchlist: View: Get Complete SSBK Trend Analysis ➞ | |
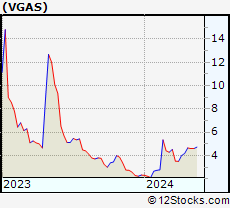 | VGAS Verde Clean Fuels, Inc. |
| Sector: Utilities | |
| SubSector: Utilities - Renewable | |
| MarketCap: 204 Millions | |
| Recent Price: 4.41 Smart Investing & Trading Score: 36 | |
| Day Percent Change: -3.92% Day Change: -0.18 | |
| Week Change: -3.92% Year-to-date Change: 89.3% | |
| VGAS Links: Profile News Message Board | |
| Charts:- Daily , Weekly | |
| Add VGAS to Watchlist: View: Get Complete VGAS Trend Analysis ➞ | |
 | METCB Ramaco Resources, Inc. |
| Sector: Materials | |
| SubSector: Coking Coal | |
| MarketCap: 469 Millions | |
| Recent Price: 10.76 Smart Investing & Trading Score: 0 | |
| Day Percent Change: -3.93% Day Change: -0.44 | |
| Week Change: -3.93% Year-to-date Change: -18.8% | |
| METCB Links: Profile News Message Board | |
| Charts:- Daily , Weekly | |
| Add METCB to Watchlist: View: Get Complete METCB Trend Analysis ➞ | |
 | STRS Stratus Properties Inc. |
| Sector: Financials | |
| SubSector: Real Estate Development | |
| MarketCap: 167.819 Millions | |
| Recent Price: 22.60 Smart Investing & Trading Score: 44 | |
| Day Percent Change: -3.95% Day Change: -0.93 | |
| Week Change: -3.95% Year-to-date Change: -21.7% | |
| STRS Links: Profile News Message Board | |
| Charts:- Daily , Weekly | |
| Add STRS to Watchlist: View: Get Complete STRS Trend Analysis ➞ | |
 | BCBP BCB Bancorp, Inc. |
| Sector: Financials | |
| SubSector: Regional - Northeast Banks | |
| MarketCap: 196.799 Millions | |
| Recent Price: 10.09 Smart Investing & Trading Score: 42 | |
| Day Percent Change: -4.00% Day Change: -0.42 | |
| Week Change: -4% Year-to-date Change: -21.5% | |
| BCBP Links: Profile News Message Board | |
| Charts:- Daily , Weekly | |
| Add BCBP to Watchlist: View: Get Complete BCBP Trend Analysis ➞ | |
 | OPTN OptiNose, Inc. |
| Sector: Health Care | |
| SubSector: Drugs - Generic | |
| MarketCap: 183.385 Millions | |
| Recent Price: 1.17 Smart Investing & Trading Score: 54 | |
| Day Percent Change: -4.10% Day Change: -0.05 | |
| Week Change: -4.1% Year-to-date Change: -9.3% | |
| OPTN Links: Profile News Message Board | |
| Charts:- Daily , Weekly | |
| Add OPTN to Watchlist: View: Get Complete OPTN Trend Analysis ➞ | |
 | IPSC Century Therapeutics, Inc. |
| Sector: Health Care | |
| SubSector: Biotechnology | |
| MarketCap: 187 Millions | |
| Recent Price: 3.00 Smart Investing & Trading Score: 30 | |
| Day Percent Change: -4.15% Day Change: -0.13 | |
| Week Change: -4.15% Year-to-date Change: -9.1% | |
| IPSC Links: Profile News Message Board | |
| Charts:- Daily , Weekly | |
| Add IPSC to Watchlist: View: Get Complete IPSC Trend Analysis ➞ | |
 | VALU Value Line, Inc. |
| Sector: Services & Goods | |
| SubSector: Publishing - Periodicals | |
| MarketCap: 254.3 Millions | |
| Recent Price: 38.02 Smart Investing & Trading Score: 50 | |
| Day Percent Change: -4.45% Day Change: -1.77 | |
| Week Change: -4.45% Year-to-date Change: -22.0% | |
| VALU Links: Profile News Message Board | |
| Charts:- Daily , Weekly | |
| Add VALU to Watchlist: View: Get Complete VALU Trend Analysis ➞ | |
 | MYRG MYR Group Inc. |
| Sector: Industrials | |
| SubSector: General Contractors | |
| MarketCap: 405.363 Millions | |
| Recent Price: 153.48 Smart Investing & Trading Score: 0 | |
| Day Percent Change: -4.49% Day Change: -7.22 | |
| Week Change: -4.49% Year-to-date Change: 6.1% | |
| MYRG Links: Profile News Message Board | |
| Charts:- Daily , Weekly | |
| Add MYRG to Watchlist: View: Get Complete MYRG Trend Analysis ➞ | |
 | BWMN Bowman Consulting Group Ltd. |
| Sector: Industrials | |
| SubSector: Engineering & Construction | |
| MarketCap: 443 Millions | |
| Recent Price: 30.35 Smart Investing & Trading Score: 0 | |
| Day Percent Change: -4.59% Day Change: -1.46 | |
| Week Change: -4.59% Year-to-date Change: -13.8% | |
| BWMN Links: Profile News Message Board | |
| Charts:- Daily , Weekly | |
| Add BWMN to Watchlist: View: Get Complete BWMN Trend Analysis ➞ | |
 | POWL Powell Industries, Inc. |
| Sector: Industrials | |
| SubSector: Diversified Machinery | |
| MarketCap: 257.216 Millions | |
| Recent Price: 160.42 Smart Investing & Trading Score: 42 | |
| Day Percent Change: -4.64% Day Change: -7.81 | |
| Week Change: -4.64% Year-to-date Change: 81.5% | |
| POWL Links: Profile News Message Board | |
| Charts:- Daily , Weekly | |
| Add POWL to Watchlist: View: Get Complete POWL Trend Analysis ➞ | |
 | EWTX Edgewise Therapeutics, Inc. |
| Sector: Health Care | |
| SubSector: Biotechnology | |
| MarketCap: 492 Millions | |
| Recent Price: 17.48 Smart Investing & Trading Score: 46 | |
| Day Percent Change: -4.64% Day Change: -0.85 | |
| Week Change: -4.64% Year-to-date Change: 54.0% | |
| EWTX Links: Profile News Message Board | |
| Charts:- Daily , Weekly | |
| Add EWTX to Watchlist: View: Get Complete EWTX Trend Analysis ➞ | |
 | PKE Park Aerospace Corp. |
| Sector: Technology | |
| SubSector: Semiconductor Equipment & Materials | |
| MarketCap: 229.018 Millions | |
| Recent Price: 14.08 Smart Investing & Trading Score: 0 | |
| Day Percent Change: -4.74% Day Change: -0.70 | |
| Week Change: -4.74% Year-to-date Change: -4.2% | |
| PKE Links: Profile News Message Board | |
| Charts:- Daily , Weekly | |
| Add PKE to Watchlist: View: Get Complete PKE Trend Analysis ➞ | |
 | ODC Oil-Dri Corporation of America |
| Sector: Materials | |
| SubSector: Specialty Chemicals | |
| MarketCap: 249.857 Millions | |
| Recent Price: 78.34 Smart Investing & Trading Score: 63 | |
| Day Percent Change: -4.75% Day Change: -3.91 | |
| Week Change: -4.75% Year-to-date Change: 16.8% | |
| ODC Links: Profile News Message Board | |
| Charts:- Daily , Weekly | |
| Add ODC to Watchlist: View: Get Complete ODC Trend Analysis ➞ | |
| For tabular summary view of above stock list: Summary View ➞ 0 - 25 , 25 - 50 , 50 - 75 , 75 - 100 , 100 - 125 , 125 - 150 , 150 - 175 , 175 - 200 , 200 - 225 , 225 - 250 , 250 - 275 , 275 - 300 , 300 - 325 , 325 - 350 , 350 - 375 , 375 - 400 , 400 - 425 , 425 - 450 , 450 - 475 , 475 - 500 , 500 - 525 | ||
| Click To Change The Sort Order: By Market Cap or Company Size Performance: Year-to-date, Week and Day | |
| Select Chart Type: | ||
| Too many stocks? View smallcap stocks filtered by marketcap & sector |
| Marketcap: All SmallCap Stocks (default-no microcap), Large, Mid-Range, Small & MicroCap |
| Sector: Tech, Finance, Energy, Staples, Retail, Industrial, Materials, Utilities & Medical |
|
Best Stocks Today 12Stocks.com |
© 2024 12Stocks.com Terms & Conditions Privacy Contact Us
All Information Provided Only For Education And Not To Be Used For Investing or Trading. See Terms & Conditions


One More Thing ... Get Best Stocks Delivered Daily!
Never Ever Miss A Move With Our Top Ten Stocks Lists
Find Best Stocks In Any Market - Bull or Bear Market
Take A Peek At Our Top Ten Stocks Lists: Daily, Weekly, Year-to-Date & Top Trends
Find Best Stocks In Any Market - Bull or Bear Market
Take A Peek At Our Top Ten Stocks Lists: Daily, Weekly, Year-to-Date & Top Trends
Smallcap Stocks With Best Up Trends [0-bearish to 100-bullish]: Novavax [100], Emergent BioSolutions[100], Verrica [100], iRobot [100], Trupanion [100], Humacyte [100], AMC s[100], Squarespace [100], Twist Bioscience[100], Redfin [100], Guardant Health[100]
Best Smallcap Stocks Year-to-Date:
CareMax [500%], Janux [365.24%], Bakkt [347.53%], Viking [288.82%], Alpine Immune[241.12%], Longboard [226.19%], Avidity Biosciences[187.83%], Sweetgreen [186.37%], Super Micro[175.37%], Novavax [173.13%], Vera [163.24%] Best Smallcap Stocks This Week:
Novavax [47.64%], MacroGenics [32.33%], Emergent BioSolutions[23.22%], Allbirds [20.23%], Omega [20.15%], SunPower [19.57%], Verrica [19.5%], iRobot [19.43%], Trupanion [19.26%], Humacyte [16.6%], FiscalNote [16.54%] Best Smallcap Stocks Daily:
Novavax [47.64%], MacroGenics [32.33%], Emergent BioSolutions[23.22%], Allbirds [20.23%], Omega [20.15%], SunPower [19.57%], Verrica [19.50%], iRobot [19.43%], Trupanion [19.26%], Humacyte [16.60%], FiscalNote [16.54%]