
 Login Sign Up


| |||||
 |  | ||||

| 12Stocks.com Market Intelligence |
Best SmallCap Stocks
|
| In a hurry? Small Cap Stock Lists: Performance Trends Table, Stock Charts
Sort Small Cap stocks: Daily, Weekly, Year-to-Date, Market Cap & Trends. Filter Small Cap stocks list by sector: Show all, Tech, Finance, Energy, Staples, Retail, Industrial, Materials, Utilities and HealthCare Filter Small Cap stocks list by size: All Large Medium Small and MicroCap |
| 12Stocks.com Small Cap Stocks Performances & Trends Daily | |||||||||
|
|  The overall Smart Investing & Trading Score is 63 (0-bearish to 100-bullish) which puts Small Cap index in short term neutral to bullish trend. The Smart Investing & Trading Score from previous trading session is 58 and hence an improvement of trend.
| ||||||||
Here are the Smart Investing & Trading Scores of the most requested small cap stocks at 12Stocks.com (click stock name for detailed review):
|


| 12Stocks.com: Investing in Smallcap Index with Stocks | |
|
The following table helps investors and traders sort through current performance and trends (as measured by Smart Investing & Trading Score) of various
stocks in the Smallcap Index. Quick View: Move mouse or cursor over stock symbol (ticker) to view short-term technical chart and over stock name to view long term chart. Click on  to add stock symbol to your watchlist and to add stock symbol to your watchlist and  to view watchlist. Click on any ticker or stock name for detailed market intelligence report for that stock. to view watchlist. Click on any ticker or stock name for detailed market intelligence report for that stock. |
12Stocks.com Performance of Stocks in Smallcap Index
| Ticker | Stock Name | Watchlist | Category | Recent Price | Smart Investing & Trading Score | Change % | YTD Change% |
| JANX | Janux |   | Health Care | 49.99 | 73 | 2.27% | 365.24% |
| VKTX | Viking | | Health Care | 66.79 | 63 | 6.46% | 258.89% |
| LBPH | Longboard | | Health Care | 19.53 | 64 | 4.61% | 219.64% |
| HIPO | Hippo | | Financials | 20.93 | 61 | 1.87% | 129.80% |
| VGAS | Verde Clean | | Utilities | 4.59 | 51 | 0.00% | 97.00% |
| ACRV | Acrivon | | Health Care | 9.43 | 56 | -0.84% | 89.74% |
| NN | NextNav | | Technology | 8.44 | 100 | 0.48% | 89.66% |
| FIP | FTAI Infrastructure | | Industrials | 7.14 | 95 | 0.71% | 83.55% |
| NUVB | Nuvation Bio | | Health Care | 2.76 | 68 | 2.99% | 82.18% |
| GERN | Geron | | Health Care | 3.71 | 58 | -0.67% | 75.59% |
| MGNX | MacroGenics | | Health Care | 16.17 | 56 | 4.93% | 68.09% |
| PEPG | PepGen | | Health Care | 11.39 | 46 | 0.00% | 66.52% |
| POWL | Powell Industries | | Industrials | 142.46 | 90 | 4.65% | 61.15% |
| SIGA | SIGA | | Health Care | 8.77 | 68 | 4.97% | 56.52% |
| IESC | IES | | Industrials | 122.50 | 68 | 4.10% | 54.63% |
| CGEM | Cullinan Oncology | | Health Care | 15.77 | 31 | 0.86% | 54.63% |
| DXPE | DXP Enterprises | | Services & Goods | 51.35 | 68 | 2.61% | 52.39% |
| TPC | Tutor Perini | | Industrials | 13.78 | 68 | 1.92% | 51.43% |
| CRAI | CRA | | Services & Goods | 148.97 | 90 | 1.17% | 50.70% |
| DSGN | Design | | Health Care | 3.96 | 95 | 1.93% | 49.34% |
| SMMT | Summit | | Health Care | 3.81 | 49 | 9.31% | 46.17% |
| MOD | Modine | | Consumer Staples | 86.85 | 58 | 0.38% | 45.48% |
| ADMA | ADMA Biologics | | Health Care | 6.50 | 90 | 4.92% | 43.92% |
| TNYA | Tenaya | | Health Care | 4.58 | 63 | 3.27% | 43.87% |
| CENX | Century Aluminum | | Materials | 17.43 | 70 | -3.11% | 43.57% |
| For chart view version of above stock list: Chart View ➞ 0 - 25 , 25 - 50 , 50 - 75 , 75 - 100 , 100 - 125 , 125 - 150 , 150 - 175 , 175 - 200 , 200 - 225 , 225 - 250 , 250 - 275 , 275 - 300 , 300 - 325 , 325 - 350 , 350 - 375 , 375 - 400 , 400 - 425 , 425 - 450 | ||
 | Click To Change The Sort Order: By Market Cap or Company Size Performance: Year-to-date, Week and Day |  |
| Too many stocks? View smallcap stocks filtered by marketcap & sector |
| Marketcap: All SmallCap Stocks (default-no microcap), Large, Mid-Range, Small |
| Smallcap Sector: Tech, Finance, Energy, Staples, Retail, Industrial, Materials, & Medical |
|
Get the most comprehensive stock market coverage daily at 12Stocks.com ➞ Best Stocks Today ➞ Best Stocks Weekly ➞ Best Stocks Year-to-Date ➞ Best Stocks Trends ➞  Best Stocks Today 12Stocks.com Best Nasdaq Stocks ➞ Best S&P 500 Stocks ➞ Best Tech Stocks ➞ Best Biotech Stocks ➞ |
| Detailed Overview of SmallCap Stocks |
| SmallCap Technical Overview, Leaders & Laggards, Top SmallCap ETF Funds & Detailed SmallCap Stocks List, Charts, Trends & More |
| Smallcap: Technical Analysis, Trends & YTD Performance | |
| SmallCap segment as represented by
IWM, an exchange-traded fund [ETF], holds basket of thousands of smallcap stocks from across all major sectors of the US stock market. The smallcap index (contains stocks like Riverbed & Sotheby's) is down by -1.27% and is currently underperforming the overall market by -6.76% year-to-date. Below is a quick view of technical charts and trends: | |
 IWM Weekly Chart |
|
| Long Term Trend: Good | |
| Medium Term Trend: Not Good | |
 IWM Daily Chart |
|
| Short Term Trend: Very Good | |
| Overall Trend Score: 63 | |
| YTD Performance: -1.27% | |
| **Trend Scores & Views Are Only For Educational Purposes And Not For Investing | |
| 12Stocks.com: Top Performing Small Cap Index Stocks | ||||||||||||||||||||||||||||||||||||||||||||||||
 The top performing Small Cap Index stocks year to date are
Now, more recently, over last week, the top performing Small Cap Index stocks on the move are


|
||||||||||||||||||||||||||||||||||||||||||||||||
| 12Stocks.com: Investing in Smallcap Index using Exchange Traded Funds | |
|
The following table shows list of key exchange traded funds (ETF) that
help investors track Smallcap index. The following list also includes leveraged ETF funds that track twice or thrice the daily returns of Smallcap indices. Short or inverse ETF funds move in the opposite direction to the index they track and are useful during market pullbacks or during bear markets. Quick View: Move mouse or cursor over ETF symbol (ticker) to view short-term technical chart and over ETF name to view long term chart. Click on ticker or stock name for detailed view. Click on to add stock symbol to your watchlist and to view watchlist. |
12Stocks.com List of ETFs that track Smallcap Index
| Ticker | ETF Name | Watchlist | Recent Price | Smart Investing & Trading Score | Change % | Week % | Year-to-date % |
| IWM | iShares Russell 2000 | | 198.16 | 63 | 1.46 | 2.6 | -1.27% |
| VTWO | Vanguard Russell 2000 ETF | | 80.14 | 70 | 1.54 | 2.63 | -1.19% |
| IJR | iShares Core S&P Small-Cap | | 105.44 | 75 | 1.91 | 2.16 | -2.59% |
| IWN | iShares Russell 2000 Value | | 151.50 | 68 | 1.33 | 2.52 | -2.47% |
| IWO | iShares Russell 2000 Growth | | 252.16 | 58 | 1.71 | 2.8 | -0.02% |
| IJS | iShares S&P Small-Cap 600 Value | | 97.77 | 67 | 1.39 | 2.26 | -5.14% |
| IJT | iShares S&P Small-Cap 600 Growth | | 123.36 | 70 | 0.00 | 0.94 | -1.42% |
| XSLV | PowerShares S&P SmallCap Low Volatil ETF | | 42.95 | 80 | 1.21 | 1.84 | -2.71% |
| SMLV | SPDR SSGA US Small Cap Low Volatil ETF | | 107.10 | 65 | -0.35 | 0.95 | -4.82% |
| 12Stocks.com: Charts, Trends, Fundamental Data and Performances of SmallCap Stocks | |
|
We now take in-depth look at all SmallCap stocks including charts, multi-period performances and overall trends (as measured by Smart Investing & Trading Score). One can sort SmallCap stocks (click link to choose) by Daily, Weekly and by Year-to-Date performances. Also, one can sort by size of the company or by market capitalization. |
| Select Your Default Chart Type: | |||||
| |||||
| Click on stock symbol or name for detailed view. Click on to add stock symbol to your watchlist and to view watchlist. Quick View: Move mouse or cursor over "Daily" to quickly view daily technical stock chart and over "Weekly" to view weekly technical stock chart. | |||||

 | JANX Janux Therapeutics, Inc. |
| Sector: Health Care | |
| SubSector: Biotechnology | |
| MarketCap: 496 Millions | |
| Recent Price: 49.99 Smart Investing & Trading Score: 73 | |
| Day Percent Change: 2.27% Day Change: 1.11 | |
| Week Change: 2.67% Year-to-date Change: 365.2% | |
| JANX Links: Profile News Message Board | |
| Charts:- Daily , Weekly | |
| Add JANX to Watchlist: View: Get Complete JANX Trend Analysis ➞ | |
 | VKTX Viking Therapeutics, Inc. |
| Sector: Health Care | |
| SubSector: Biotechnology | |
| MarketCap: 388.585 Millions | |
| Recent Price: 66.79 Smart Investing & Trading Score: 63 | |
| Day Percent Change: 6.46% Day Change: 4.05 | |
| Week Change: 5.31% Year-to-date Change: 258.9% | |
| VKTX Links: Profile News Message Board | |
| Charts:- Daily , Weekly | |
| Add VKTX to Watchlist: View: Get Complete VKTX Trend Analysis ➞ | |
 | LBPH Longboard Pharmaceuticals, Inc. |
| Sector: Health Care | |
| SubSector: Biotechnology | |
| MarketCap: 169 Millions | |
| Recent Price: 19.53 Smart Investing & Trading Score: 64 | |
| Day Percent Change: 4.61% Day Change: 0.86 | |
| Week Change: 11.98% Year-to-date Change: 219.6% | |
| LBPH Links: Profile News Message Board | |
| Charts:- Daily , Weekly | |
| Add LBPH to Watchlist: View: Get Complete LBPH Trend Analysis ➞ | |
 | HIPO Hippo Holdings Inc. |
| Sector: Financials | |
| SubSector: Insurance - Specialty | |
| MarketCap: 377 Millions | |
| Recent Price: 20.93 Smart Investing & Trading Score: 61 | |
| Day Percent Change: 1.87% Day Change: 0.38 | |
| Week Change: 4.57% Year-to-date Change: 129.8% | |
| HIPO Links: Profile News Message Board | |
| Charts:- Daily , Weekly | |
| Add HIPO to Watchlist: View: Get Complete HIPO Trend Analysis ➞ | |
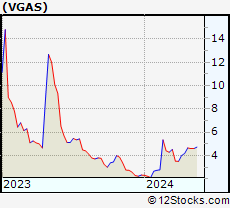 | VGAS Verde Clean Fuels, Inc. |
| Sector: Utilities | |
| SubSector: Utilities - Renewable | |
| MarketCap: 204 Millions | |
| Recent Price: 4.59 Smart Investing & Trading Score: 51 | |
| Day Percent Change: 0.00% Day Change: 0.00 | |
| Week Change: -0.22% Year-to-date Change: 97.0% | |
| VGAS Links: Profile News Message Board | |
| Charts:- Daily , Weekly | |
| Add VGAS to Watchlist: View: Get Complete VGAS Trend Analysis ➞ | |
 | ACRV Acrivon Therapeutics, Inc. |
| Sector: Health Care | |
| SubSector: Biotechnology | |
| MarketCap: 286 Millions | |
| Recent Price: 9.43 Smart Investing & Trading Score: 56 | |
| Day Percent Change: -0.84% Day Change: -0.08 | |
| Week Change: 0.43% Year-to-date Change: 89.7% | |
| ACRV Links: Profile News Message Board | |
| Charts:- Daily , Weekly | |
| Add ACRV to Watchlist: View: Get Complete ACRV Trend Analysis ➞ | |
 | NN NextNav Inc. |
| Sector: Technology | |
| SubSector: Software - Infrastructure | |
| MarketCap: 314 Millions | |
| Recent Price: 8.44 Smart Investing & Trading Score: 100 | |
| Day Percent Change: 0.48% Day Change: 0.04 | |
| Week Change: 3.43% Year-to-date Change: 89.7% | |
| NN Links: Profile News Message Board | |
| Charts:- Daily , Weekly | |
| Add NN to Watchlist: View: Get Complete NN Trend Analysis ➞ | |
 | FIP FTAI Infrastructure Inc. |
| Sector: Industrials | |
| SubSector: Industrials | |
| MarketCap: 368 Millions | |
| Recent Price: 7.14 Smart Investing & Trading Score: 95 | |
| Day Percent Change: 0.71% Day Change: 0.05 | |
| Week Change: 7.05% Year-to-date Change: 83.6% | |
| FIP Links: Profile News Message Board | |
| Charts:- Daily , Weekly | |
| Add FIP to Watchlist: View: Get Complete FIP Trend Analysis ➞ | |
 | NUVB Nuvation Bio Inc. |
| Sector: Health Care | |
| SubSector: Biotechnology | |
| MarketCap: 381 Millions | |
| Recent Price: 2.76 Smart Investing & Trading Score: 68 | |
| Day Percent Change: 2.99% Day Change: 0.08 | |
| Week Change: 6.15% Year-to-date Change: 82.2% | |
| NUVB Links: Profile News Message Board | |
| Charts:- Daily , Weekly | |
| Add NUVB to Watchlist: View: Get Complete NUVB Trend Analysis ➞ | |
 | GERN Geron Corporation |
| Sector: Health Care | |
| SubSector: Biotechnology | |
| MarketCap: 228.685 Millions | |
| Recent Price: 3.71 Smart Investing & Trading Score: 58 | |
| Day Percent Change: -0.67% Day Change: -0.02 | |
| Week Change: 0.41% Year-to-date Change: 75.6% | |
| GERN Links: Profile News Message Board | |
| Charts:- Daily , Weekly | |
| Add GERN to Watchlist: View: Get Complete GERN Trend Analysis ➞ | |
 | MGNX MacroGenics, Inc. |
| Sector: Health Care | |
| SubSector: Biotechnology | |
| MarketCap: 262.785 Millions | |
| Recent Price: 16.17 Smart Investing & Trading Score: 56 | |
| Day Percent Change: 4.93% Day Change: 0.76 | |
| Week Change: 3.59% Year-to-date Change: 68.1% | |
| MGNX Links: Profile News Message Board | |
| Charts:- Daily , Weekly | |
| Add MGNX to Watchlist: View: Get Complete MGNX Trend Analysis ➞ | |
 | PEPG PepGen Inc. |
| Sector: Health Care | |
| SubSector: Biotechnology | |
| MarketCap: 216 Millions | |
| Recent Price: 11.39 Smart Investing & Trading Score: 46 | |
| Day Percent Change: 0.00% Day Change: 0.00 | |
| Week Change: 8.12% Year-to-date Change: 66.5% | |
| PEPG Links: Profile News Message Board | |
| Charts:- Daily , Weekly | |
| Add PEPG to Watchlist: View: Get Complete PEPG Trend Analysis ➞ | |
 | POWL Powell Industries, Inc. |
| Sector: Industrials | |
| SubSector: Diversified Machinery | |
| MarketCap: 257.216 Millions | |
| Recent Price: 142.46 Smart Investing & Trading Score: 90 | |
| Day Percent Change: 4.65% Day Change: 6.33 | |
| Week Change: 9.3% Year-to-date Change: 61.2% | |
| POWL Links: Profile News Message Board | |
| Charts:- Daily , Weekly | |
| Add POWL to Watchlist: View: Get Complete POWL Trend Analysis ➞ | |
 | SIGA SIGA Technologies, Inc. |
| Sector: Health Care | |
| SubSector: Biotechnology | |
| MarketCap: 424.285 Millions | |
| Recent Price: 8.77 Smart Investing & Trading Score: 68 | |
| Day Percent Change: 4.97% Day Change: 0.42 | |
| Week Change: 5.1% Year-to-date Change: 56.5% | |
| SIGA Links: Profile News Message Board | |
| Charts:- Daily , Weekly | |
| Add SIGA to Watchlist: View: Get Complete SIGA Trend Analysis ➞ | |
 | IESC IES Holdings, Inc. |
| Sector: Industrials | |
| SubSector: General Contractors | |
| MarketCap: 380.963 Millions | |
| Recent Price: 122.50 Smart Investing & Trading Score: 68 | |
| Day Percent Change: 4.10% Day Change: 4.82 | |
| Week Change: 6.05% Year-to-date Change: 54.6% | |
| IESC Links: Profile News Message Board | |
| Charts:- Daily , Weekly | |
| Add IESC to Watchlist: View: Get Complete IESC Trend Analysis ➞ | |
 | CGEM Cullinan Oncology, Inc. |
| Sector: Health Care | |
| SubSector: Biotechnology | |
| MarketCap: 433 Millions | |
| Recent Price: 15.77 Smart Investing & Trading Score: 31 | |
| Day Percent Change: 0.86% Day Change: 0.13 | |
| Week Change: 0.67% Year-to-date Change: 54.6% | |
| CGEM Links: Profile News Message Board | |
| Charts:- Daily , Weekly | |
| Add CGEM to Watchlist: View: Get Complete CGEM Trend Analysis ➞ | |
 | DXPE DXP Enterprises, Inc. |
| Sector: Services & Goods | |
| SubSector: Industrial Equipment Wholesale | |
| MarketCap: 243.758 Millions | |
| Recent Price: 51.35 Smart Investing & Trading Score: 68 | |
| Day Percent Change: 2.61% Day Change: 1.30 | |
| Week Change: 1.75% Year-to-date Change: 52.4% | |
| DXPE Links: Profile News Message Board | |
| Charts:- Daily , Weekly | |
| Add DXPE to Watchlist: View: Get Complete DXPE Trend Analysis ➞ | |
 | TPC Tutor Perini Corporation |
| Sector: Industrials | |
| SubSector: Heavy Construction | |
| MarketCap: 382.595 Millions | |
| Recent Price: 13.78 Smart Investing & Trading Score: 68 | |
| Day Percent Change: 1.92% Day Change: 0.26 | |
| Week Change: 3.77% Year-to-date Change: 51.4% | |
| TPC Links: Profile News Message Board | |
| Charts:- Daily , Weekly | |
| Add TPC to Watchlist: View: Get Complete TPC Trend Analysis ➞ | |
 | CRAI CRA International, Inc. |
| Sector: Services & Goods | |
| SubSector: Management Services | |
| MarketCap: 209.645 Millions | |
| Recent Price: 148.97 Smart Investing & Trading Score: 90 | |
| Day Percent Change: 1.17% Day Change: 1.72 | |
| Week Change: 2.28% Year-to-date Change: 50.7% | |
| CRAI Links: Profile News Message Board | |
| Charts:- Daily , Weekly | |
| Add CRAI to Watchlist: View: Get Complete CRAI Trend Analysis ➞ | |
 | DSGN Design Therapeutics, Inc. |
| Sector: Health Care | |
| SubSector: Biotechnology | |
| MarketCap: 367 Millions | |
| Recent Price: 3.96 Smart Investing & Trading Score: 95 | |
| Day Percent Change: 1.93% Day Change: 0.07 | |
| Week Change: 7.16% Year-to-date Change: 49.3% | |
| DSGN Links: Profile News Message Board | |
| Charts:- Daily , Weekly | |
| Add DSGN to Watchlist: View: Get Complete DSGN Trend Analysis ➞ | |
 | SMMT Summit Therapeutics plc |
| Sector: Health Care | |
| SubSector: Biotechnology | |
| MarketCap: 156.985 Millions | |
| Recent Price: 3.81 Smart Investing & Trading Score: 49 | |
| Day Percent Change: 9.31% Day Change: 0.32 | |
| Week Change: 9% Year-to-date Change: 46.2% | |
| SMMT Links: Profile News Message Board | |
| Charts:- Daily , Weekly | |
| Add SMMT to Watchlist: View: Get Complete SMMT Trend Analysis ➞ | |
 | MOD Modine Manufacturing Company |
| Sector: Consumer Staples | |
| SubSector: Auto Parts | |
| MarketCap: 177.339 Millions | |
| Recent Price: 86.85 Smart Investing & Trading Score: 58 | |
| Day Percent Change: 0.38% Day Change: 0.33 | |
| Week Change: 3.78% Year-to-date Change: 45.5% | |
| MOD Links: Profile News Message Board | |
| Charts:- Daily , Weekly | |
| Add MOD to Watchlist: View: Get Complete MOD Trend Analysis ➞ | |
 | ADMA ADMA Biologics, Inc. |
| Sector: Health Care | |
| SubSector: Biotechnology | |
| MarketCap: 204.985 Millions | |
| Recent Price: 6.50 Smart Investing & Trading Score: 90 | |
| Day Percent Change: 4.92% Day Change: 0.30 | |
| Week Change: 3.75% Year-to-date Change: 43.9% | |
| ADMA Links: Profile News Message Board | |
| Charts:- Daily , Weekly | |
| Add ADMA to Watchlist: View: Get Complete ADMA Trend Analysis ➞ | |
 | TNYA Tenaya Therapeutics, Inc. |
| Sector: Health Care | |
| SubSector: Biotechnology | |
| MarketCap: 395 Millions | |
| Recent Price: 4.58 Smart Investing & Trading Score: 63 | |
| Day Percent Change: 3.27% Day Change: 0.15 | |
| Week Change: 5.9% Year-to-date Change: 43.9% | |
| TNYA Links: Profile News Message Board | |
| Charts:- Daily , Weekly | |
| Add TNYA to Watchlist: View: Get Complete TNYA Trend Analysis ➞ | |
 | CENX Century Aluminum Company |
| Sector: Materials | |
| SubSector: Aluminum | |
| MarketCap: 266.408 Millions | |
| Recent Price: 17.43 Smart Investing & Trading Score: 70 | |
| Day Percent Change: -3.11% Day Change: -0.56 | |
| Week Change: -2.57% Year-to-date Change: 43.6% | |
| CENX Links: Profile News Message Board | |
| Charts:- Daily , Weekly | |
| Add CENX to Watchlist: View: Get Complete CENX Trend Analysis ➞ | |
| For tabular summary view of above stock list: Summary View ➞ 0 - 25 , 25 - 50 , 50 - 75 , 75 - 100 , 100 - 125 , 125 - 150 , 150 - 175 , 175 - 200 , 200 - 225 , 225 - 250 , 250 - 275 , 275 - 300 , 300 - 325 , 325 - 350 , 350 - 375 , 375 - 400 , 400 - 425 , 425 - 450 | ||
| Click To Change The Sort Order: By Market Cap or Company Size Performance: Year-to-date, Week and Day | |
| Select Chart Type: | ||
| Too many stocks? View smallcap stocks filtered by marketcap & sector |
| Marketcap: All SmallCap Stocks (default-no microcap), Large, Mid-Range, Small & MicroCap |
| Sector: Tech, Finance, Energy, Staples, Retail, Industrial, Materials, Utilities & Medical |
|
Best Stocks Today 12Stocks.com |
© 2024 12Stocks.com Terms & Conditions Privacy Contact Us
All Information Provided Only For Education And Not To Be Used For Investing or Trading. See Terms & Conditions


One More Thing ... Get Best Stocks Delivered Daily!
Never Ever Miss A Move With Our Top Ten Stocks Lists
Find Best Stocks In Any Market - Bull or Bear Market
Take A Peek At Our Top Ten Stocks Lists: Daily, Weekly, Year-to-Date & Top Trends
Find Best Stocks In Any Market - Bull or Bear Market
Take A Peek At Our Top Ten Stocks Lists: Daily, Weekly, Year-to-Date & Top Trends
Smallcap Stocks With Best Up Trends [0-bearish to 100-bullish]: Hibbett Sports[100], BioLife Solutions[100], AZZ [100], Mueller Industries[100], Oscar Health[100], Boot Barn[100], Calavo Growers[100], NBT Bancorp[100], Peoples Bancorp[100], Riot Blockchain[100], Piedmont Office[100]
Best Smallcap Stocks Year-to-Date:
Janux [365.24%], Viking [258.89%], Longboard [219.64%], Super Micro[175.13%], Vera [163.02%], Hippo [129.8%], MicroStrategy [115.12%], Sana [99.88%], SoundHound AI[97.2%], Verde Clean[97%], Dyne [96.24%] Best Smallcap Stocks This Week:
Matterport [164.08%], Riot Blockchain[28.59%], ProKidney [25.74%], Cipher Mining[23.83%], Seres [21.4%], Hibbett Sports[21.34%], SoundHound AI[18.87%], BigBear.ai [18.62%], Marathon Patent[15.94%], MicroStrategy [15.73%], Heron [15.72%] Best Smallcap Stocks Daily:
Hibbett Sports[19.08%], Marathon Patent[18.12%], Heron [17.95%], SES AI[16.52%], SoundHound AI[11.64%], FuelCell Energy[10.86%], BigBear.ai [10.26%], Summit [9.31%], HealthStream [9.25%], Super Micro[9.07%], Seres [8.82%]