
 Login Sign Up


| |||||
 |  | ||||

| 12Stocks.com Market Intelligence |
Best SmallCap Stocks
|
| In a hurry? Small Cap Stock Lists: Performance Trends Table, Stock Charts
Sort Small Cap stocks: Daily, Weekly, Year-to-Date, Market Cap & Trends. Filter Small Cap stocks list by sector: Show all, Tech, Finance, Energy, Staples, Retail, Industrial, Materials, Utilities and HealthCare Filter Small Cap stocks list by size: All Large Medium Small and MicroCap |
| 12Stocks.com Small Cap Stocks Performances & Trends Daily | |||||||||
|
|  The overall Smart Investing & Trading Score is 56 (0-bearish to 100-bullish) which puts Small Cap index in short term neutral trend. The Smart Investing & Trading Score from previous trading session is 44 and hence an improvement of trend.
| ||||||||
Here are the Smart Investing & Trading Scores of the most requested small cap stocks at 12Stocks.com (click stock name for detailed review):
|


| 12Stocks.com: Investing in Smallcap Index with Stocks | |
|
The following table helps investors and traders sort through current performance and trends (as measured by Smart Investing & Trading Score) of various
stocks in the Smallcap Index. Quick View: Move mouse or cursor over stock symbol (ticker) to view short-term technical chart and over stock name to view long term chart. Click on  to add stock symbol to your watchlist and to add stock symbol to your watchlist and  to view watchlist. Click on any ticker or stock name for detailed market intelligence report for that stock. to view watchlist. Click on any ticker or stock name for detailed market intelligence report for that stock. |
12Stocks.com Performance of Stocks in Smallcap Index
| Ticker | Stock Name | Watchlist | Category | Recent Price | Smart Investing & Trading Score | Change % | YTD Change% |
| SITM | SiTime |   | Technology | 88.79 | 74 | 7.03 | -27.27% |
| BHIL | Benson Hill | | Materials | 0.20 | 62 | 6.85 | 11.84% |
| FTCI | FTC Solar | | Technology | 0.43 | 25 | 6.77 | -37.84% |
| RSVR | Reservoir Media | | Services & Goods | 9.10 | 100 | 6.56 | 27.81% |
| PACB | Pacific Biosciences | | Health Care | 1.47 | 27 | 6.52 | -85.02% |
| GERN | Geron | | Health Care | 3.79 | 73 | 6.46 | 79.62% |
| GRTS | Gritstone Oncology | | Health Care | 0.81 | 32 | 6.40 | -60.13% |
| RILY | B. Riley | | Financials | 36.82 | 100 | 6.14 | 75.42% |
| LOCO | El Pollo | | Services & Goods | 8.91 | 59 | 6.07 | 1.02% |
| VGAS | Verde Clean | | Utilities | 4.60 | 58 | 5.99 | 97.42% |
| CIX | CompX | | Services & Goods | 34.27 | 83 | 5.74 | 35.56% |
| RUSHB | Rush Enterprises | | Services & Goods | 44.54 | 17 | 5.72 | -15.93% |
| NAUT | Nautilus | | Health Care | 2.49 | 20 | 5.51 | -24.32% |
| SKYT | SkyWater | | Technology | 9.74 | 75 | 5.30 | 1.04% |
| DC | Dakota Gold | | Materials | 2.57 | 68 | 5.11 | -1.15% |
| VIGL | Vigil Neuroscience | | Health Care | 2.71 | 20 | 5.04 | -20.99% |
| FMAO | Farmers & Merchants Bancorp | | Financials | 21.72 | 67 | 4.93 | -12.42% |
| HIPO | Hippo | | Financials | 21.82 | 68 | 4.65 | 139.52% |
| VHI | Valhi | | Materials | 15.00 | 53 | 4.46 | -1.25% |
| CYH | Community Health | | Health Care | 3.39 | 74 | 4.31 | 8.31% |
| SLDP | Solid Power | | Industrials | 1.71 | 75 | 4.27 | 20.00% |
| MOD | Modine | | Consumer Staples | 96.74 | 70 | 4.21 | 62.04% |
| RDW | Redwire | | Industrials | 3.96 | 75 | 4.21 | 38.95% |
| KLTR | Kaltura | | Technology | 1.25 | 20 | 4.17 | -36.22% |
| CPS | Cooper-Standard | | Consumer Staples | 16.00 | 42 | 4.10 | -18.12% |
| For chart view version of above stock list: Chart View ➞ 0 - 25 , 25 - 50 , 50 - 75 , 75 - 100 , 100 - 125 , 125 - 150 , 150 - 175 , 175 - 200 , 200 - 225 , 225 - 250 , 250 - 275 , 275 - 300 , 300 - 325 , 325 - 350 , 350 - 375 , 375 - 400 , 400 - 425 , 425 - 450 , 450 - 475 , 475 - 500 , 500 - 525 | ||
 | Click To Change The Sort Order: By Market Cap or Company Size Performance: Year-to-date, Week and Day |  |
| Too many stocks? View smallcap stocks filtered by marketcap & sector |
| Marketcap: All SmallCap Stocks (default-no microcap), Large, Mid-Range, Small |
| Smallcap Sector: Tech, Finance, Energy, Staples, Retail, Industrial, Materials, & Medical |
|
Get the most comprehensive stock market coverage daily at 12Stocks.com ➞ Best Stocks Today ➞ Best Stocks Weekly ➞ Best Stocks Year-to-Date ➞ Best Stocks Trends ➞  Best Stocks Today 12Stocks.com Best Nasdaq Stocks ➞ Best S&P 500 Stocks ➞ Best Tech Stocks ➞ Best Biotech Stocks ➞ |
| Detailed Overview of SmallCap Stocks |
| SmallCap Technical Overview, Leaders & Laggards, Top SmallCap ETF Funds & Detailed SmallCap Stocks List, Charts, Trends & More |
| Smallcap: Technical Analysis, Trends & YTD Performance | |
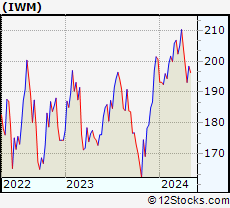
| SmallCap segment as represented by
IWM, an exchange-traded fund [ETF], holds basket of thousands of smallcap stocks from across all major sectors of the US stock market. The smallcap index (contains stocks like Riverbed & Sotheby's) is down by -1.16% and is currently underperforming the overall market by -7.3% year-to-date. Below is a quick view of technical charts and trends: | |
 IWM Weekly Chart |
|
| Long Term Trend: Good | |
| Medium Term Trend: Not Good | |
 IWM Daily Chart |
|
| Short Term Trend: Very Good | |
| Overall Trend Score: 56 | |
| YTD Performance: -1.16% | |
| **Trend Scores & Views Are Only For Educational Purposes And Not For Investing | |
| 12Stocks.com: Top Performing Small Cap Index Stocks | ||||||||||||||||||||||||||||||||||||||||||||||||
 The top performing Small Cap Index stocks year to date are
Now, more recently, over last week, the top performing Small Cap Index stocks on the move are


|
||||||||||||||||||||||||||||||||||||||||||||||||
| 12Stocks.com: Investing in Smallcap Index using Exchange Traded Funds | |
|
The following table shows list of key exchange traded funds (ETF) that
help investors track Smallcap index. The following list also includes leveraged ETF funds that track twice or thrice the daily returns of Smallcap indices. Short or inverse ETF funds move in the opposite direction to the index they track and are useful during market pullbacks or during bear markets. Quick View: Move mouse or cursor over ETF symbol (ticker) to view short-term technical chart and over ETF name to view long term chart. Click on ticker or stock name for detailed view. Click on to add stock symbol to your watchlist and to view watchlist. |
12Stocks.com List of ETFs that track Smallcap Index
| Ticker | ETF Name | Watchlist | Recent Price | Smart Investing & Trading Score | Change % | Week % | Year-to-date % |
| IWM | iShares Russell 2000 | | 198.39 | 56 | 0.97 | 2.72 | -1.16% |
| IJR | iShares Core S&P Small-Cap | | 105.65 | 75 | 0.75 | 2.35 | -2.4% |
| VTWO | Vanguard Russell 2000 ETF | | 80.22 | 63 | 0.97 | 2.74 | -1.09% |
| IWN | iShares Russell 2000 Value | | 151.14 | 68 | 0.64 | 2.27 | -2.7% |
| IWO | iShares Russell 2000 Growth | | 253.09 | 58 | 1.29 | 3.18 | 0.34% |
| IJS | iShares S&P Small-Cap 600 Value | | 97.19 | 60 | 0.52 | 1.65 | -5.7% |
| IJT | iShares S&P Small-Cap 600 Growth | | 126.09 | 70 | 0.82 | 3.17 | 0.76% |
| XSLV | PowerShares S&P SmallCap Low Volatil ETF | | 42.72 | 72 | 0.42 | 1.28 | -3.24% |
| SAA | ProShares Ultra SmallCap600 | | 23.04 | 80 | 1.68 | 5.69 | -7.66% |
| SBB | ProShares Short SmallCap600 | | 16.39 | 20 | -0.70 | -2.7 | 2.86% |
| SDD | ProShares UltraShort SmallCap600 | | 19.35 | 38 | -1.17 | -4.87 | 5.01% |
| SMLV | SPDR SSGA US Small Cap Low Volatil ETF | | 107.52 | 60 | 0.18 | 1.35 | -4.44% |
| 12Stocks.com: Charts, Trends, Fundamental Data and Performances of SmallCap Stocks | |
|
We now take in-depth look at all SmallCap stocks including charts, multi-period performances and overall trends (as measured by Smart Investing & Trading Score). One can sort SmallCap stocks (click link to choose) by Daily, Weekly and by Year-to-Date performances. Also, one can sort by size of the company or by market capitalization. |
| Select Your Default Chart Type: | |||||
| |||||
| Click on stock symbol or name for detailed view. Click on to add stock symbol to your watchlist and to view watchlist. Quick View: Move mouse or cursor over "Daily" to quickly view daily technical stock chart and over "Weekly" to view weekly technical stock chart. | |||||

 | SITM SiTime Corporation |
| Sector: Technology | |
| SubSector: Semiconductor - Specialized | |
| MarketCap: 403.76 Millions | |
| Recent Price: 88.79 Smart Investing & Trading Score: 74 | |
| Day Percent Change: 7.03% Day Change: 5.83 | |
| Week Change: 20.93% Year-to-date Change: -27.3% | |
| SITM Links: Profile News Message Board | |
| Charts:- Daily , Weekly | |
| Add SITM to Watchlist: View: Get Complete SITM Trend Analysis ➞ | |
 | BHIL Benson Hill, Inc. |
| Sector: Materials | |
| SubSector: Agricultural Inputs | |
| MarketCap: 236 Millions | |
| Recent Price: 0.20 Smart Investing & Trading Score: 62 | |
| Day Percent Change: 6.85% Day Change: 0.01 | |
| Week Change: 19.45% Year-to-date Change: 11.8% | |
| BHIL Links: Profile News Message Board | |
| Charts:- Daily , Weekly | |
| Add BHIL to Watchlist: View: Get Complete BHIL Trend Analysis ➞ | |
 | FTCI FTC Solar, Inc. |
| Sector: Technology | |
| SubSector: Solar | |
| MarketCap: 345 Millions | |
| Recent Price: 0.43 Smart Investing & Trading Score: 25 | |
| Day Percent Change: 6.77% Day Change: 0.03 | |
| Week Change: 9.78% Year-to-date Change: -37.8% | |
| FTCI Links: Profile News Message Board | |
| Charts:- Daily , Weekly | |
| Add FTCI to Watchlist: View: Get Complete FTCI Trend Analysis ➞ | |
 | RSVR Reservoir Media, Inc. |
| Sector: Services & Goods | |
| SubSector: Entertainment | |
| MarketCap: 389 Millions | |
| Recent Price: 9.10 Smart Investing & Trading Score: 100 | |
| Day Percent Change: 6.56% Day Change: 0.56 | |
| Week Change: 13.75% Year-to-date Change: 27.8% | |
| RSVR Links: Profile News Message Board | |
| Charts:- Daily , Weekly | |
| Add RSVR to Watchlist: View: Get Complete RSVR Trend Analysis ➞ | |
 | PACB Pacific Biosciences of California, Inc. |
| Sector: Health Care | |
| SubSector: Biotechnology | |
| MarketCap: 470.685 Millions | |
| Recent Price: 1.47 Smart Investing & Trading Score: 27 | |
| Day Percent Change: 6.52% Day Change: 0.09 | |
| Week Change: -5.16% Year-to-date Change: -85.0% | |
| PACB Links: Profile News Message Board | |
| Charts:- Daily , Weekly | |
| Add PACB to Watchlist: View: Get Complete PACB Trend Analysis ➞ | |
 | GERN Geron Corporation |
| Sector: Health Care | |
| SubSector: Biotechnology | |
| MarketCap: 228.685 Millions | |
| Recent Price: 3.79 Smart Investing & Trading Score: 73 | |
| Day Percent Change: 6.46% Day Change: 0.23 | |
| Week Change: 2.71% Year-to-date Change: 79.6% | |
| GERN Links: Profile News Message Board | |
| Charts:- Daily , Weekly | |
| Add GERN to Watchlist: View: Get Complete GERN Trend Analysis ➞ | |
 | GRTS Gritstone Oncology, Inc. |
| Sector: Health Care | |
| SubSector: Biotechnology | |
| MarketCap: 240.085 Millions | |
| Recent Price: 0.81 Smart Investing & Trading Score: 32 | |
| Day Percent Change: 6.40% Day Change: 0.05 | |
| Week Change: 9.71% Year-to-date Change: -60.1% | |
| GRTS Links: Profile News Message Board | |
| Charts:- Daily , Weekly | |
| Add GRTS to Watchlist: View: Get Complete GRTS Trend Analysis ➞ | |
 | RILY B. Riley Financial, Inc. |
| Sector: Financials | |
| SubSector: Asset Management | |
| MarketCap: 443.703 Millions | |
| Recent Price: 36.82 Smart Investing & Trading Score: 100 | |
| Day Percent Change: 6.14% Day Change: 2.13 | |
| Week Change: 84.19% Year-to-date Change: 75.4% | |
| RILY Links: Profile News Message Board | |
| Charts:- Daily , Weekly | |
| Add RILY to Watchlist: View: Get Complete RILY Trend Analysis ➞ | |
 | LOCO El Pollo Loco Holdings, Inc. |
| Sector: Services & Goods | |
| SubSector: Restaurants | |
| MarketCap: 296.97 Millions | |
| Recent Price: 8.91 Smart Investing & Trading Score: 59 | |
| Day Percent Change: 6.07% Day Change: 0.51 | |
| Week Change: 7.09% Year-to-date Change: 1.0% | |
| LOCO Links: Profile News Message Board | |
| Charts:- Daily , Weekly | |
| Add LOCO to Watchlist: View: Get Complete LOCO Trend Analysis ➞ | |
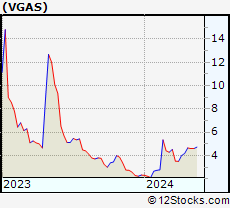 | VGAS Verde Clean Fuels, Inc. |
| Sector: Utilities | |
| SubSector: Utilities - Renewable | |
| MarketCap: 204 Millions | |
| Recent Price: 4.60 Smart Investing & Trading Score: 58 | |
| Day Percent Change: 5.99% Day Change: 0.26 | |
| Week Change: 0% Year-to-date Change: 97.4% | |
| VGAS Links: Profile News Message Board | |
| Charts:- Daily , Weekly | |
| Add VGAS to Watchlist: View: Get Complete VGAS Trend Analysis ➞ | |
 | CIX CompX International Inc. |
| Sector: Services & Goods | |
| SubSector: Security & Protection Services | |
| MarketCap: 189.603 Millions | |
| Recent Price: 34.27 Smart Investing & Trading Score: 83 | |
| Day Percent Change: 5.74% Day Change: 1.86 | |
| Week Change: 9.28% Year-to-date Change: 35.6% | |
| CIX Links: Profile News Message Board | |
| Charts:- Daily , Weekly | |
| Add CIX to Watchlist: View: Get Complete CIX Trend Analysis ➞ | |
 | RUSHB Rush Enterprises, Inc. |
| Sector: Services & Goods | |
| SubSector: Auto Dealerships | |
| MarketCap: 203.221 Millions | |
| Recent Price: 44.54 Smart Investing & Trading Score: 17 | |
| Day Percent Change: 5.72% Day Change: 2.41 | |
| Week Change: -4.26% Year-to-date Change: -15.9% | |
| RUSHB Links: Profile News Message Board | |
| Charts:- Daily , Weekly | |
| Add RUSHB to Watchlist: View: Get Complete RUSHB Trend Analysis ➞ | |
 | NAUT Nautilus Biotechnology, Inc. |
| Sector: Health Care | |
| SubSector: Biotechnology | |
| MarketCap: 458 Millions | |
| Recent Price: 2.49 Smart Investing & Trading Score: 20 | |
| Day Percent Change: 5.51% Day Change: 0.13 | |
| Week Change: 1.22% Year-to-date Change: -24.3% | |
| NAUT Links: Profile News Message Board | |
| Charts:- Daily , Weekly | |
| Add NAUT to Watchlist: View: Get Complete NAUT Trend Analysis ➞ | |
 | SKYT SkyWater Technology, Inc. |
| Sector: Technology | |
| SubSector: Semiconductors | |
| MarketCap: 394 Millions | |
| Recent Price: 9.74 Smart Investing & Trading Score: 75 | |
| Day Percent Change: 5.30% Day Change: 0.49 | |
| Week Change: 16.09% Year-to-date Change: 1.0% | |
| SKYT Links: Profile News Message Board | |
| Charts:- Daily , Weekly | |
| Add SKYT to Watchlist: View: Get Complete SKYT Trend Analysis ➞ | |
 | DC Dakota Gold Corp. |
| Sector: Materials | |
| SubSector: Gold | |
| MarketCap: 218 Millions | |
| Recent Price: 2.57 Smart Investing & Trading Score: 68 | |
| Day Percent Change: 5.11% Day Change: 0.13 | |
| Week Change: 1.98% Year-to-date Change: -1.2% | |
| DC Links: Profile News Message Board | |
| Charts:- Daily , Weekly | |
| Add DC to Watchlist: View: Get Complete DC Trend Analysis ➞ | |
 | VIGL Vigil Neuroscience, Inc. |
| Sector: Health Care | |
| SubSector: Biotechnology | |
| MarketCap: 339 Millions | |
| Recent Price: 2.71 Smart Investing & Trading Score: 20 | |
| Day Percent Change: 5.04% Day Change: 0.13 | |
| Week Change: -3.9% Year-to-date Change: -21.0% | |
| VIGL Links: Profile News Message Board | |
| Charts:- Daily , Weekly | |
| Add VIGL to Watchlist: View: Get Complete VIGL Trend Analysis ➞ | |
 | FMAO Farmers & Merchants Bancorp, Inc. |
| Sector: Financials | |
| SubSector: Regional - Midwest Banks | |
| MarketCap: 280.27 Millions | |
| Recent Price: 21.72 Smart Investing & Trading Score: 67 | |
| Day Percent Change: 4.93% Day Change: 1.02 | |
| Week Change: 5.13% Year-to-date Change: -12.4% | |
| FMAO Links: Profile News Message Board | |
| Charts:- Daily , Weekly | |
| Add FMAO to Watchlist: View: Get Complete FMAO Trend Analysis ➞ | |
 | HIPO Hippo Holdings Inc. |
| Sector: Financials | |
| SubSector: Insurance - Specialty | |
| MarketCap: 377 Millions | |
| Recent Price: 21.82 Smart Investing & Trading Score: 68 | |
| Day Percent Change: 4.65% Day Change: 0.97 | |
| Week Change: 8.99% Year-to-date Change: 139.5% | |
| HIPO Links: Profile News Message Board | |
| Charts:- Daily , Weekly | |
| Add HIPO to Watchlist: View: Get Complete HIPO Trend Analysis ➞ | |
 | VHI Valhi, Inc. |
| Sector: Materials | |
| SubSector: Chemicals - Major Diversified | |
| MarketCap: 394.336 Millions | |
| Recent Price: 15.00 Smart Investing & Trading Score: 53 | |
| Day Percent Change: 4.46% Day Change: 0.64 | |
| Week Change: -3.23% Year-to-date Change: -1.3% | |
| VHI Links: Profile News Message Board | |
| Charts:- Daily , Weekly | |
| Add VHI to Watchlist: View: Get Complete VHI Trend Analysis ➞ | |
 | CYH Community Health Systems, Inc. |
| Sector: Health Care | |
| SubSector: Hospitals | |
| MarketCap: 371.546 Millions | |
| Recent Price: 3.39 Smart Investing & Trading Score: 74 | |
| Day Percent Change: 4.31% Day Change: 0.14 | |
| Week Change: 18.53% Year-to-date Change: 8.3% | |
| CYH Links: Profile News Message Board | |
| Charts:- Daily , Weekly | |
| Add CYH to Watchlist: View: Get Complete CYH Trend Analysis ➞ | |
 | SLDP Solid Power, Inc. |
| Sector: Industrials | |
| SubSector: Electrical Equipment & Parts | |
| MarketCap: 445 Millions | |
| Recent Price: 1.71 Smart Investing & Trading Score: 75 | |
| Day Percent Change: 4.27% Day Change: 0.07 | |
| Week Change: 4.27% Year-to-date Change: 20.0% | |
| SLDP Links: Profile News Message Board | |
| Charts:- Daily , Weekly | |
| Add SLDP to Watchlist: View: Get Complete SLDP Trend Analysis ➞ | |
 | MOD Modine Manufacturing Company |
| Sector: Consumer Staples | |
| SubSector: Auto Parts | |
| MarketCap: 177.339 Millions | |
| Recent Price: 96.74 Smart Investing & Trading Score: 70 | |
| Day Percent Change: 4.21% Day Change: 3.91 | |
| Week Change: 15.59% Year-to-date Change: 62.0% | |
| MOD Links: Profile News Message Board | |
| Charts:- Daily , Weekly | |
| Add MOD to Watchlist: View: Get Complete MOD Trend Analysis ➞ | |
 | RDW Redwire Corporation |
| Sector: Industrials | |
| SubSector: Aerospace & Defense | |
| MarketCap: 160 Millions | |
| Recent Price: 3.96 Smart Investing & Trading Score: 75 | |
| Day Percent Change: 4.21% Day Change: 0.16 | |
| Week Change: 11.86% Year-to-date Change: 39.0% | |
| RDW Links: Profile News Message Board | |
| Charts:- Daily , Weekly | |
| Add RDW to Watchlist: View: Get Complete RDW Trend Analysis ➞ | |
 | KLTR Kaltura, Inc. |
| Sector: Technology | |
| SubSector: Software - Application | |
| MarketCap: 293 Millions | |
| Recent Price: 1.25 Smart Investing & Trading Score: 20 | |
| Day Percent Change: 4.17% Day Change: 0.05 | |
| Week Change: 4.17% Year-to-date Change: -36.2% | |
| KLTR Links: Profile News Message Board | |
| Charts:- Daily , Weekly | |
| Add KLTR to Watchlist: View: Get Complete KLTR Trend Analysis ➞ | |
 | CPS Cooper-Standard Holdings Inc. |
| Sector: Consumer Staples | |
| SubSector: Auto Parts | |
| MarketCap: 184.339 Millions | |
| Recent Price: 16.00 Smart Investing & Trading Score: 42 | |
| Day Percent Change: 4.10% Day Change: 0.63 | |
| Week Change: 1.59% Year-to-date Change: -18.1% | |
| CPS Links: Profile News Message Board | |
| Charts:- Daily , Weekly | |
| Add CPS to Watchlist: View: Get Complete CPS Trend Analysis ➞ | |
| For tabular summary view of above stock list: Summary View ➞ 0 - 25 , 25 - 50 , 50 - 75 , 75 - 100 , 100 - 125 , 125 - 150 , 150 - 175 , 175 - 200 , 200 - 225 , 225 - 250 , 250 - 275 , 275 - 300 , 300 - 325 , 325 - 350 , 350 - 375 , 375 - 400 , 400 - 425 , 425 - 450 , 450 - 475 , 475 - 500 , 500 - 525 | ||
| Click To Change The Sort Order: By Market Cap or Company Size Performance: Year-to-date, Week and Day | |
| Select Chart Type: | ||
| Too many stocks? View smallcap stocks filtered by marketcap & sector |
| Marketcap: All SmallCap Stocks (default-no microcap), Large, Mid-Range, Small & MicroCap |
| Sector: Tech, Finance, Energy, Staples, Retail, Industrial, Materials, Utilities & Medical |
|
Best Stocks Today 12Stocks.com |
© 2024 12Stocks.com Terms & Conditions Privacy Contact Us
All Information Provided Only For Education And Not To Be Used For Investing or Trading. See Terms & Conditions


One More Thing ... Get Best Stocks Delivered Daily!
Never Ever Miss A Move With Our Top Ten Stocks Lists
Find Best Stocks In Any Market - Bull or Bear Market
Take A Peek At Our Top Ten Stocks Lists: Daily, Weekly, Year-to-Date & Top Trends
Find Best Stocks In Any Market - Bull or Bear Market
Take A Peek At Our Top Ten Stocks Lists: Daily, Weekly, Year-to-Date & Top Trends
Smallcap Stocks With Best Up Trends [0-bearish to 100-bullish]: Universal Logistics[100], Cullinan Oncology[100], Tutor Perini[100], Zura Bio[100], U.S. Silica[100], Exponent [100], NextNav [100], Solaris Oilfield[100], PTC [100], Rogers [100], Sonic Automotive[100]
Best Smallcap Stocks Year-to-Date:
CareMax [543.3%], Janux [341.65%], Viking [299.3%], Alpine Immune[239.08%], Longboard [222.75%], Super Micro[201.64%], Avidity Biosciences[169.47%], Arcutis Bio[162.23%], Vera [156.27%], Cullinan Oncology[148.16%], Hippo [139.52%] Best Smallcap Stocks This Week:
Matterport [170.98%], B. Riley[84.19%], Cullinan Oncology[61.56%], Seres [47.35%], Universal Logistics[36.84%], Tutor Perini[33.89%], Zura Bio[33.23%], Riot Blockchain[30.67%], IGM Biosciences[30.56%], Impinj [29.74%], Sonic Automotive[28.14%] Best Smallcap Stocks Daily:
Universal Logistics[39.37%], Cullinan Oncology[31.43%], Tutor Perini[28.01%], Zura Bio[26.72%], IGM Biosciences[23.36%], U.S. Silica[21.67%], Maxeon Solar[20.46%], Exponent [19.49%], TPI Composites[16.32%], OptimizeRx [15.07%], NextNav [13.97%]