
 Login Sign Up


| |||||
 |  | ||||

| 12Stocks.com Market Intelligence |
Best SmallCap Stocks
|
| In a hurry? Small Cap Stock Lists: Performance Trends Table, Stock Charts
Sort Small Cap stocks: Daily, Weekly, Year-to-Date, Market Cap & Trends. Filter Small Cap stocks list by sector: Show all, Tech, Finance, Energy, Staples, Retail, Industrial, Materials, Utilities and HealthCare Filter Small Cap stocks list by size: All Large Medium Small and MicroCap |
| 12Stocks.com Small Cap Stocks Performances & Trends Daily | |||||||||
|
|  The overall Smart Investing & Trading Score is 88 (0-bearish to 100-bullish) which puts Small Cap index in short term bullish trend. The Smart Investing & Trading Score from previous trading session is 70 and hence an improvement of trend.
| ||||||||
Here are the Smart Investing & Trading Scores of the most requested small cap stocks at 12Stocks.com (click stock name for detailed review):
|


| 12Stocks.com: Investing in Smallcap Index with Stocks | |
|
The following table helps investors and traders sort through current performance and trends (as measured by Smart Investing & Trading Score) of various
stocks in the Smallcap Index. Quick View: Move mouse or cursor over stock symbol (ticker) to view short-term technical chart and over stock name to view long term chart. Click on  to add stock symbol to your watchlist and to add stock symbol to your watchlist and  to view watchlist. Click on any ticker or stock name for detailed market intelligence report for that stock. to view watchlist. Click on any ticker or stock name for detailed market intelligence report for that stock. |
12Stocks.com Performance of Stocks in Smallcap Index
| Ticker | Stock Name | Watchlist | Category | Recent Price | Smart Investing & Trading Score | Change % | YTD Change% |
| ORGO | Organogenesis |   | Health Care | 2.88 | 55 | -2.53 | -29.46% |
| RIGL | Rigel | | Health Care | 0.96 | 0 | -2.69 | -34.08% |
| RILY | B. Riley | | Financials | 34.03 | 70 | -2.72 | 62.12% |
| DOMO | Domo | | Technology | 7.14 | 33 | -2.86 | -30.61% |
| MITK | Mitek Systems | | Technology | 13.76 | 85 | -3.00 | 5.48% |
| CENX | Century Aluminum | | Materials | 17.23 | 68 | -3.07 | 41.97% |
| VLD | Velo3D | | Technology | 0.23 | 10 | -3.30 | -41.77% |
| VMD | Viemed Healthcare | | Health Care | 6.79 | 0 | -3.69 | -13.50% |
| BCRX | BioCryst | | Health Care | 5.42 | 82 | -3.82 | -9.60% |
| JANX | Janux | | Health Care | 48.00 | 61 | -3.98 | 346.72% |
| PNTG | Pennant Group | | Health Care | 22.43 | 88 | -4.10 | 61.14% |
| CUE | Cue Biopharma | | Health Care | 1.58 | 25 | -4.24 | -40.15% |
| WOW | WideOpenWest | | Technology | 4.76 | 90 | -4.42 | 17.53% |
| OPTN | OptiNose | | Health Care | 1.12 | 32 | -4.70 | -13.57% |
| AIRS | AirSculpt | | Health Care | 4.44 | 10 | -4.93 | -40.72% |
| PRST | Presto Automation | | Technology | 0.16 | 25 | -6.19 | -70.48% |
| AVD | American Vanguard | | Materials | 8.67 | 10 | -6.47 | -20.97% |
| ACET | Aceto | | Materials | 1.35 | 50 | -6.60 | -28.84% |
| MCRB | Seres | | Health Care | 0.89 | 30 | -8.27 | -36.76% |
| RAPT | RAPT | | Health Care | 4.03 | 10 | -8.52 | -83.80% |
| LLAP | Terran Orbital | | Industrials | 0.89 | 0 | -15.24 | -22.27% |
| AKYA | Akoya Biosciences | | Health Care | 2.87 | 40 | -30.46 | -41.41% |
| For chart view version of above stock list: Chart View ➞ 0 - 25 , 25 - 50 , 50 - 75 , 75 - 100 , 100 - 125 , 125 - 150 , 150 - 175 , 175 - 200 , 200 - 225 , 225 - 250 , 250 - 275 , 275 - 300 , 300 - 325 , 325 - 350 , 350 - 375 , 375 - 400 , 400 - 425 , 425 - 450 , 450 - 475 , 475 - 500 , 500 - 525 | ||
 | Click To Change The Sort Order: By Market Cap or Company Size Performance: Year-to-date, Week and Day |  |
| Too many stocks? View smallcap stocks filtered by marketcap & sector |
| Marketcap: All SmallCap Stocks (default-no microcap), Large, Mid-Range, Small |
| Smallcap Sector: Tech, Finance, Energy, Staples, Retail, Industrial, Materials, & Medical |
|
Get the most comprehensive stock market coverage daily at 12Stocks.com ➞ Best Stocks Today ➞ Best Stocks Weekly ➞ Best Stocks Year-to-Date ➞ Best Stocks Trends ➞  Best Stocks Today 12Stocks.com Best Nasdaq Stocks ➞ Best S&P 500 Stocks ➞ Best Tech Stocks ➞ Best Biotech Stocks ➞ |
| Detailed Overview of SmallCap Stocks |
| SmallCap Technical Overview, Leaders & Laggards, Top SmallCap ETF Funds & Detailed SmallCap Stocks List, Charts, Trends & More |
| Smallcap: Technical Analysis, Trends & YTD Performance | |
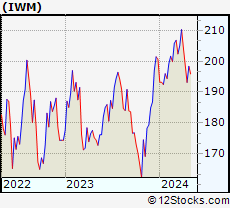
| SmallCap segment as represented by
IWM, an exchange-traded fund [ETF], holds basket of thousands of smallcap stocks from across all major sectors of the US stock market. The smallcap index (contains stocks like Riverbed & Sotheby's) is up by 2.98% and is currently underperforming the overall market by -6.32% year-to-date. Below is a quick view of technical charts and trends: | |
 IWM Weekly Chart |
|
| Long Term Trend: Very Good | |
| Medium Term Trend: Very Good | |
 IWM Daily Chart |
|
| Short Term Trend: Very Good | |
| Overall Trend Score: 88 | |
| YTD Performance: 2.98% | |
| **Trend Scores & Views Are Only For Educational Purposes And Not For Investing | |
| 12Stocks.com: Top Performing Small Cap Index Stocks | ||||||||||||||||||||||||||||||||||||||||||||||||
 The top performing Small Cap Index stocks year to date are
Now, more recently, over last week, the top performing Small Cap Index stocks on the move are


|
||||||||||||||||||||||||||||||||||||||||||||||||
| 12Stocks.com: Investing in Smallcap Index using Exchange Traded Funds | |
|
The following table shows list of key exchange traded funds (ETF) that
help investors track Smallcap index. The following list also includes leveraged ETF funds that track twice or thrice the daily returns of Smallcap indices. Short or inverse ETF funds move in the opposite direction to the index they track and are useful during market pullbacks or during bear markets. Quick View: Move mouse or cursor over ETF symbol (ticker) to view short-term technical chart and over ETF name to view long term chart. Click on ticker or stock name for detailed view. Click on to add stock symbol to your watchlist and to view watchlist. |
12Stocks.com List of ETFs that track Smallcap Index
| Ticker | ETF Name | Watchlist | Recent Price | Smart Investing & Trading Score | Change % | Week % | Year-to-date % |
| IWM | iShares Russell 2000 | | 206.69 | 88 | 0.95 | 1.16 | 2.98% |
| VTWO | Vanguard Russell 2000 ETF | | 83.50 | 70 | 0.89 | 1.06 | 2.96% |
| IJR | iShares Core S&P Small-Cap | | 110.39 | 95 | 0.99 | 1.29 | 1.98% |
| IWN | iShares Russell 2000 Value | | 157.80 | 88 | 0.96 | 1.03 | 1.59% |
| IWO | iShares Russell 2000 Growth | | 263.58 | 70 | 1.17 | 1.41 | 4.5% |
| IJS | iShares S&P Small-Cap 600 Value | | 102.21 | 100 | 1.25 | 1.68 | -0.83% |
| IJT | iShares S&P Small-Cap 600 Growth | | 130.72 | 83 | 0.58 | 0.66 | 4.46% |
| SMLV | SPDR SSGA US Small Cap Low Volatil ETF | | 111.65 | 76 | 0.22 | 0.39 | -0.77% |
| XSLV | PowerShares S&P SmallCap Low Volatil ETF | | 44.33 | 83 | -0.42 | 0.21 | 0.4% |
| SAA | ProShares Ultra SmallCap600 | | 24.98 | 90 | 1.50 | 2.59 | 0.12% |
| SBB | ProShares Short SmallCap600 | | 15.76 | 0 | -0.86 | -1.22 | -1.07% |
| SDD | ProShares UltraShort SmallCap600 | | 17.89 | 28 | -1.47 | -2.14 | -2.92% |
| 12Stocks.com: Charts, Trends, Fundamental Data and Performances of SmallCap Stocks | |
|
We now take in-depth look at all SmallCap stocks including charts, multi-period performances and overall trends (as measured by Smart Investing & Trading Score). One can sort SmallCap stocks (click link to choose) by Daily, Weekly and by Year-to-Date performances. Also, one can sort by size of the company or by market capitalization. |
| Select Your Default Chart Type: | |||||
| |||||
| Click on stock symbol or name for detailed view. Click on to add stock symbol to your watchlist and to view watchlist. Quick View: Move mouse or cursor over "Daily" to quickly view daily technical stock chart and over "Weekly" to view weekly technical stock chart. | |||||

 | ORGO Organogenesis Holdings Inc. |
| Sector: Health Care | |
| SubSector: Drugs - Generic | |
| MarketCap: 239.685 Millions | |
| Recent Price: 2.88 Smart Investing & Trading Score: 55 | |
| Day Percent Change: -2.53% Day Change: -0.08 | |
| Week Change: -4.79% Year-to-date Change: -29.5% | |
| ORGO Links: Profile News Message Board | |
| Charts:- Daily , Weekly | |
| Add ORGO to Watchlist: View: Get Complete ORGO Trend Analysis ➞ | |
 | RIGL Rigel Pharmaceuticals, Inc. |
| Sector: Health Care | |
| SubSector: Biotechnology | |
| MarketCap: 256.585 Millions | |
| Recent Price: 0.96 Smart Investing & Trading Score: 0 | |
| Day Percent Change: -2.69% Day Change: -0.03 | |
| Week Change: -2.91% Year-to-date Change: -34.1% | |
| RIGL Links: Profile News Message Board | |
| Charts:- Daily , Weekly | |
| Add RIGL to Watchlist: View: Get Complete RIGL Trend Analysis ➞ | |
 | RILY B. Riley Financial, Inc. |
| Sector: Financials | |
| SubSector: Asset Management | |
| MarketCap: 443.703 Millions | |
| Recent Price: 34.03 Smart Investing & Trading Score: 70 | |
| Day Percent Change: -2.72% Day Change: -0.95 | |
| Week Change: 5.88% Year-to-date Change: 62.1% | |
| RILY Links: Profile News Message Board | |
| Charts:- Daily , Weekly | |
| Add RILY to Watchlist: View: Get Complete RILY Trend Analysis ➞ | |
 | DOMO Domo, Inc. |
| Sector: Technology | |
| SubSector: Application Software | |
| MarketCap: 247.062 Millions | |
| Recent Price: 7.14 Smart Investing & Trading Score: 33 | |
| Day Percent Change: -2.86% Day Change: -0.21 | |
| Week Change: -0.42% Year-to-date Change: -30.6% | |
| DOMO Links: Profile News Message Board | |
| Charts:- Daily , Weekly | |
| Add DOMO to Watchlist: View: Get Complete DOMO Trend Analysis ➞ | |
 | MITK Mitek Systems, Inc. |
| Sector: Technology | |
| SubSector: Application Software | |
| MarketCap: 265.962 Millions | |
| Recent Price: 13.76 Smart Investing & Trading Score: 85 | |
| Day Percent Change: -3.00% Day Change: -0.42 | |
| Week Change: 2.88% Year-to-date Change: 5.5% | |
| MITK Links: Profile News Message Board | |
| Charts:- Daily , Weekly | |
| Add MITK to Watchlist: View: Get Complete MITK Trend Analysis ➞ | |
 | CENX Century Aluminum Company |
| Sector: Materials | |
| SubSector: Aluminum | |
| MarketCap: 266.408 Millions | |
| Recent Price: 17.23 Smart Investing & Trading Score: 68 | |
| Day Percent Change: -3.07% Day Change: -0.55 | |
| Week Change: 0.55% Year-to-date Change: 42.0% | |
| CENX Links: Profile News Message Board | |
| Charts:- Daily , Weekly | |
| Add CENX to Watchlist: View: Get Complete CENX Trend Analysis ➞ | |
 | VLD Velo3D, Inc. |
| Sector: Technology | |
| SubSector: Computer Hardware | |
| MarketCap: 404 Millions | |
| Recent Price: 0.23 Smart Investing & Trading Score: 10 | |
| Day Percent Change: -3.30% Day Change: -0.01 | |
| Week Change: 3.58% Year-to-date Change: -41.8% | |
| VLD Links: Profile News Message Board | |
| Charts:- Daily , Weekly | |
| Add VLD to Watchlist: View: Get Complete VLD Trend Analysis ➞ | |
 | VMD Viemed Healthcare, Inc. |
| Sector: Health Care | |
| SubSector: Medical Appliances & Equipment | |
| MarketCap: 177.28 Millions | |
| Recent Price: 6.79 Smart Investing & Trading Score: 0 | |
| Day Percent Change: -3.69% Day Change: -0.26 | |
| Week Change: -4.97% Year-to-date Change: -13.5% | |
| VMD Links: Profile News Message Board | |
| Charts:- Daily , Weekly | |
| Add VMD to Watchlist: View: Get Complete VMD Trend Analysis ➞ | |
 | BCRX BioCryst Pharmaceuticals, Inc. |
| Sector: Health Care | |
| SubSector: Biotechnology | |
| MarketCap: 369.385 Millions | |
| Recent Price: 5.42 Smart Investing & Trading Score: 82 | |
| Day Percent Change: -3.82% Day Change: -0.21 | |
| Week Change: 1.79% Year-to-date Change: -9.6% | |
| BCRX Links: Profile News Message Board | |
| Charts:- Daily , Weekly | |
| Add BCRX to Watchlist: View: Get Complete BCRX Trend Analysis ➞ | |
 | JANX Janux Therapeutics, Inc. |
| Sector: Health Care | |
| SubSector: Biotechnology | |
| MarketCap: 496 Millions | |
| Recent Price: 48.00 Smart Investing & Trading Score: 61 | |
| Day Percent Change: -3.98% Day Change: -1.99 | |
| Week Change: -1.88% Year-to-date Change: 346.7% | |
| JANX Links: Profile News Message Board | |
| Charts:- Daily , Weekly | |
| Add JANX to Watchlist: View: Get Complete JANX Trend Analysis ➞ | |
 | PNTG The Pennant Group, Inc. |
| Sector: Health Care | |
| SubSector: Long-Term Care Facilities | |
| MarketCap: 451.786 Millions | |
| Recent Price: 22.43 Smart Investing & Trading Score: 88 | |
| Day Percent Change: -4.10% Day Change: -0.96 | |
| Week Change: -0.64% Year-to-date Change: 61.1% | |
| PNTG Links: Profile News Message Board | |
| Charts:- Daily , Weekly | |
| Add PNTG to Watchlist: View: Get Complete PNTG Trend Analysis ➞ | |
 | CUE Cue Biopharma, Inc. |
| Sector: Health Care | |
| SubSector: Biotechnology | |
| MarketCap: 352.785 Millions | |
| Recent Price: 1.58 Smart Investing & Trading Score: 25 | |
| Day Percent Change: -4.24% Day Change: -0.07 | |
| Week Change: -9.2% Year-to-date Change: -40.2% | |
| CUE Links: Profile News Message Board | |
| Charts:- Daily , Weekly | |
| Add CUE to Watchlist: View: Get Complete CUE Trend Analysis ➞ | |
 | WOW WideOpenWest, Inc. |
| Sector: Technology | |
| SubSector: CATV Systems | |
| MarketCap: 328.932 Millions | |
| Recent Price: 4.76 Smart Investing & Trading Score: 90 | |
| Day Percent Change: -4.42% Day Change: -0.22 | |
| Week Change: 2.37% Year-to-date Change: 17.5% | |
| WOW Links: Profile News Message Board | |
| Charts:- Daily , Weekly | |
| Add WOW to Watchlist: View: Get Complete WOW Trend Analysis ➞ | |
 | OPTN OptiNose, Inc. |
| Sector: Health Care | |
| SubSector: Drugs - Generic | |
| MarketCap: 183.385 Millions | |
| Recent Price: 1.12 Smart Investing & Trading Score: 32 | |
| Day Percent Change: -4.70% Day Change: -0.05 | |
| Week Change: -8.61% Year-to-date Change: -13.6% | |
| OPTN Links: Profile News Message Board | |
| Charts:- Daily , Weekly | |
| Add OPTN to Watchlist: View: Get Complete OPTN Trend Analysis ➞ | |
 | AIRS AirSculpt Technologies, Inc. |
| Sector: Health Care | |
| SubSector: Medical Care Facilities | |
| MarketCap: 497 Millions | |
| Recent Price: 4.44 Smart Investing & Trading Score: 10 | |
| Day Percent Change: -4.93% Day Change: -0.23 | |
| Week Change: -6.33% Year-to-date Change: -40.7% | |
| AIRS Links: Profile News Message Board | |
| Charts:- Daily , Weekly | |
| Add AIRS to Watchlist: View: Get Complete AIRS Trend Analysis ➞ | |
 | PRST Presto Automation Inc. |
| Sector: Technology | |
| SubSector: Software - Application | |
| MarketCap: 238 Millions | |
| Recent Price: 0.16 Smart Investing & Trading Score: 25 | |
| Day Percent Change: -6.19% Day Change: -0.01 | |
| Week Change: -6.02% Year-to-date Change: -70.5% | |
| PRST Links: Profile News Message Board | |
| Charts:- Daily , Weekly | |
| Add PRST to Watchlist: View: Get Complete PRST Trend Analysis ➞ | |
 | AVD American Vanguard Corporation |
| Sector: Materials | |
| SubSector: Agricultural Chemicals | |
| MarketCap: 419.329 Millions | |
| Recent Price: 8.67 Smart Investing & Trading Score: 10 | |
| Day Percent Change: -6.47% Day Change: -0.60 | |
| Week Change: -5.14% Year-to-date Change: -21.0% | |
| AVD Links: Profile News Message Board | |
| Charts:- Daily , Weekly | |
| Add AVD to Watchlist: View: Get Complete AVD Trend Analysis ➞ | |
 | ACET Aceto Corporation |
| Sector: Materials | |
| SubSector: Chemicals - Major Diversified | |
| MarketCap: 453.16 Millions | |
| Recent Price: 1.35 Smart Investing & Trading Score: 50 | |
| Day Percent Change: -6.60% Day Change: -0.09 | |
| Week Change: -8.5% Year-to-date Change: -28.8% | |
| ACET Links: Profile News Message Board | |
| Charts:- Daily , Weekly | |
| Add ACET to Watchlist: View: Get Complete ACET Trend Analysis ➞ | |
 | MCRB Seres Therapeutics, Inc. |
| Sector: Health Care | |
| SubSector: Biotechnology | |
| MarketCap: 217.585 Millions | |
| Recent Price: 0.89 Smart Investing & Trading Score: 30 | |
| Day Percent Change: -8.27% Day Change: -0.08 | |
| Week Change: -13.21% Year-to-date Change: -36.8% | |
| MCRB Links: Profile News Message Board | |
| Charts:- Daily , Weekly | |
| Add MCRB to Watchlist: View: Get Complete MCRB Trend Analysis ➞ | |
 | RAPT RAPT Therapeutics, Inc. |
| Sector: Health Care | |
| SubSector: Biotechnology | |
| MarketCap: 368.785 Millions | |
| Recent Price: 4.03 Smart Investing & Trading Score: 10 | |
| Day Percent Change: -8.52% Day Change: -0.38 | |
| Week Change: -7.04% Year-to-date Change: -83.8% | |
| RAPT Links: Profile News Message Board | |
| Charts:- Daily , Weekly | |
| Add RAPT to Watchlist: View: Get Complete RAPT Trend Analysis ➞ | |
 | LLAP Terran Orbital Corporation |
| Sector: Industrials | |
| SubSector: Aerospace & Defense | |
| MarketCap: 206 Millions | |
| Recent Price: 0.89 Smart Investing & Trading Score: 0 | |
| Day Percent Change: -15.24% Day Change: -0.16 | |
| Week Change: -14.42% Year-to-date Change: -22.3% | |
| LLAP Links: Profile News Message Board | |
| Charts:- Daily , Weekly | |
| Add LLAP to Watchlist: View: Get Complete LLAP Trend Analysis ➞ | |
 | AKYA Akoya Biosciences, Inc. |
| Sector: Health Care | |
| SubSector: Medical Instruments & Supplies | |
| MarketCap: 340 Millions | |
| Recent Price: 2.87 Smart Investing & Trading Score: 40 | |
| Day Percent Change: -30.46% Day Change: -1.25 | |
| Week Change: -32.83% Year-to-date Change: -41.4% | |
| AKYA Links: Profile News Message Board | |
| Charts:- Daily , Weekly | |
| Add AKYA to Watchlist: View: Get Complete AKYA Trend Analysis ➞ | |
| For tabular summary view of above stock list: Summary View ➞ 0 - 25 , 25 - 50 , 50 - 75 , 75 - 100 , 100 - 125 , 125 - 150 , 150 - 175 , 175 - 200 , 200 - 225 , 225 - 250 , 250 - 275 , 275 - 300 , 300 - 325 , 325 - 350 , 350 - 375 , 375 - 400 , 400 - 425 , 425 - 450 , 450 - 475 , 475 - 500 , 500 - 525 | ||
| Click To Change The Sort Order: By Market Cap or Company Size Performance: Year-to-date, Week and Day | |
| Select Chart Type: | ||
| Too many stocks? View smallcap stocks filtered by marketcap & sector |
| Marketcap: All SmallCap Stocks (default-no microcap), Large, Mid-Range, Small & MicroCap |
| Sector: Tech, Finance, Energy, Staples, Retail, Industrial, Materials, Utilities & Medical |
|
Best Stocks Today 12Stocks.com |
© 2024 12Stocks.com Terms & Conditions Privacy Contact Us
All Information Provided Only For Education And Not To Be Used For Investing or Trading. See Terms & Conditions


One More Thing ... Get Best Stocks Delivered Daily!
Never Ever Miss A Move With Our Top Ten Stocks Lists
Find Best Stocks In Any Market - Bull or Bear Market
Take A Peek At Our Top Ten Stocks Lists: Daily, Weekly, Year-to-Date & Top Trends
Find Best Stocks In Any Market - Bull or Bear Market
Take A Peek At Our Top Ten Stocks Lists: Daily, Weekly, Year-to-Date & Top Trends
Smallcap Stocks With Best Up Trends [0-bearish to 100-bullish]: SunPower [100], Harrow Health[100], ProKidney [100], Fossil Group[100], Agilysys [100], Actinium [100], Infinera [100], Funko [100], Tucows [100], Arbor Realty[100], Bloom Energy[100]
Best Smallcap Stocks Year-to-Date:
CareMax [530.93%], Bakkt [394.17%], Janux [346.72%], Viking [291.51%], Alpine Immune[241.1%], Longboard [231.59%], Avidity Biosciences[217.15%], Super Micro[190.15%], Sweetgreen [182.92%], Novavax [166.67%], Vera [162.98%] Best Smallcap Stocks This Week:
SunPower [94.57%], Maxeon Solar[62.44%], Harrow Health[48.28%], LivePerson [44.35%], Novavax [44.14%], ProKidney [41.1%], Vuzix [39.17%], Humacyte [36.91%], MacroGenics [33.99%], Allbirds [33.89%], FuelCell Energy[33.01%] Best Smallcap Stocks Daily:
SunPower [62.73%], Maxeon Solar[42.71%], Harrow Health[42.50%], FuelCell Energy[30.18%], ProKidney [28.73%], Generation Bio[26.41%], Sunnova Energy[25.72%], LivePerson [25.31%], MicroVision [24.80%], Vuzix [24.63%], Virgin Galactic[22.12%]