
 Login Sign Up


| |||||
 |  | ||||

| 12Stocks.com Market Intelligence |
Best SmallCap Stocks
|
| In a hurry? Small Cap Stock Lists: Performance Trends Table, Stock Charts
Sort Small Cap stocks: Daily, Weekly, Year-to-Date, Market Cap & Trends. Filter Small Cap stocks list by sector: Show all, Tech, Finance, Energy, Staples, Retail, Industrial, Materials, Utilities and HealthCare Filter Small Cap stocks list by size: All Large Medium Small and MicroCap |
| 12Stocks.com Small Cap Stocks Performances & Trends Daily | |||||||||
|
|  The overall Smart Investing & Trading Score is 70 (0-bearish to 100-bullish) which puts Small Cap index in short term neutral to bullish trend. The Smart Investing & Trading Score from previous trading session is 65 and hence an improvement of trend.
| ||||||||
Here are the Smart Investing & Trading Scores of the most requested small cap stocks at 12Stocks.com (click stock name for detailed review):
|


| 12Stocks.com: Investing in Smallcap Index with Stocks | |
|
The following table helps investors and traders sort through current performance and trends (as measured by Smart Investing & Trading Score) of various
stocks in the Smallcap Index. Quick View: Move mouse or cursor over stock symbol (ticker) to view short-term technical chart and over stock name to view long term chart. Click on  to add stock symbol to your watchlist and to add stock symbol to your watchlist and  to view watchlist. Click on any ticker or stock name for detailed market intelligence report for that stock. to view watchlist. Click on any ticker or stock name for detailed market intelligence report for that stock. |
12Stocks.com Performance of Stocks in Smallcap Index
| Ticker | Stock Name | Watchlist | Category | Recent Price | Smart Investing & Trading Score | Change % | YTD Change% |
| BKKT | Bakkt |   | Technology | 9.98 | 83 | 1.42 | 347.53% |
| TRNS | Transcat | | Technology | 118.60 | 100 | 1.41 | 8.48% |
| THRD | Third Harmonic | | Health Care | 12.06 | 76 | 1.34 | 9.49% |
| MRC | MRC Global | | Energy | 13.85 | 100 | 1.32 | 25.79% |
| GNE | Genie Energy | | Energy | 15.37 | 42 | 1.32 | -45.36% |
| CHUY | Chuy s | | Services & Goods | 28.45 | 10 | 1.25 | -25.58% |
| WVE | Wave Life | | Health Care | 5.69 | 58 | 1.25 | 12.67% |
| ATEN | A10 s | | Technology | 15.71 | 90 | 1.22 | 19.29% |
| LXFR | Luxfer | | Industrials | 11.74 | 85 | 1.21 | 31.32% |
| IMMR | Immersion | | Technology | 8.40 | 100 | 1.20 | 18.98% |
| CARS | Cars.com | | Services & Goods | 17.81 | 62 | 1.19 | -6.11% |
| ASPN | Aspen Aerogels | | Industrials | 27.33 | 90 | 1.18 | 73.19% |
| QSI | Quantum-Si | | Health Care | 1.72 | 41 | 1.18 | -14.43% |
| ANGO | AngioDynamics | | Health Care | 6.12 | 95 | 1.16 | -21.94% |
| DLTH | Duluth | | Services & Goods | 4.37 | 59 | 1.16 | -18.77% |
| FFWM | First Foundation | | Financials | 5.33 | 20 | 1.14 | -44.94% |
| MRNS | Marinus | | Health Care | 1.35 | 15 | 1.13 | -87.63% |
| CPS | Cooper-Standard | | Consumer Staples | 14.71 | 58 | 1.10 | -24.72% |
| HRI | Herc | | Transports | 158.14 | 87 | 1.05 | 6.21% |
| PGC | Peapack-Gladstone Financial | | Financials | 23.29 | 59 | 1.04 | -21.90% |
| ZIMV | ZimVie | | Health Care | 16.82 | 68 | 1.02 | -5.08% |
| QTRX | Quanterix | | Health Care | 16.86 | 59 | 0.96 | -38.33% |
| LLAP | Terran Orbital | | Industrials | 1.05 | 42 | 0.96 | -8.30% |
| CCRN | Cross Country | | Services & Goods | 15.07 | 0 | 0.94 | -33.44% |
| SGHT | Sight Sciences | | Health Care | 5.42 | 51 | 0.93 | 4.94% |
| For chart view version of above stock list: Chart View ➞ 0 - 25 , 25 - 50 , 50 - 75 , 75 - 100 , 100 - 125 , 125 - 150 , 150 - 175 , 175 - 200 , 200 - 225 , 225 - 250 , 250 - 275 , 275 - 300 , 300 - 325 , 325 - 350 , 350 - 375 , 375 - 400 , 400 - 425 , 425 - 450 , 450 - 475 , 475 - 500 , 500 - 525 | ||
 | Click To Change The Sort Order: By Market Cap or Company Size Performance: Year-to-date, Week and Day |  |
| Too many stocks? View smallcap stocks filtered by marketcap & sector |
| Marketcap: All SmallCap Stocks (default-no microcap), Large, Mid-Range, Small |
| Smallcap Sector: Tech, Finance, Energy, Staples, Retail, Industrial, Materials, & Medical |
|
Get the most comprehensive stock market coverage daily at 12Stocks.com ➞ Best Stocks Today ➞ Best Stocks Weekly ➞ Best Stocks Year-to-Date ➞ Best Stocks Trends ➞  Best Stocks Today 12Stocks.com Best Nasdaq Stocks ➞ Best S&P 500 Stocks ➞ Best Tech Stocks ➞ Best Biotech Stocks ➞ |
| Detailed Overview of SmallCap Stocks |
| SmallCap Technical Overview, Leaders & Laggards, Top SmallCap ETF Funds & Detailed SmallCap Stocks List, Charts, Trends & More |
| Smallcap: Technical Analysis, Trends & YTD Performance | |
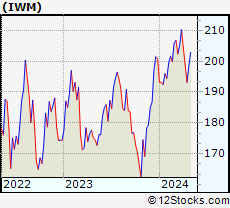
| SmallCap segment as represented by
IWM, an exchange-traded fund [ETF], holds basket of thousands of smallcap stocks from across all major sectors of the US stock market. The smallcap index (contains stocks like Riverbed & Sotheby's) is up by 2.01% and is currently underperforming the overall market by -6.83% year-to-date. Below is a quick view of technical charts and trends: | |
 IWM Weekly Chart |
|
| Long Term Trend: Very Good | |
| Medium Term Trend: Very Good | |
 IWM Daily Chart |
|
| Short Term Trend: Good | |
| Overall Trend Score: 70 | |
| YTD Performance: 2.01% | |
| **Trend Scores & Views Are Only For Educational Purposes And Not For Investing | |
| 12Stocks.com: Top Performing Small Cap Index Stocks | ||||||||||||||||||||||||||||||||||||||||||||||||
 The top performing Small Cap Index stocks year to date are
Now, more recently, over last week, the top performing Small Cap Index stocks on the move are


|
||||||||||||||||||||||||||||||||||||||||||||||||
| 12Stocks.com: Investing in Smallcap Index using Exchange Traded Funds | |
|
The following table shows list of key exchange traded funds (ETF) that
help investors track Smallcap index. The following list also includes leveraged ETF funds that track twice or thrice the daily returns of Smallcap indices. Short or inverse ETF funds move in the opposite direction to the index they track and are useful during market pullbacks or during bear markets. Quick View: Move mouse or cursor over ETF symbol (ticker) to view short-term technical chart and over ETF name to view long term chart. Click on ticker or stock name for detailed view. Click on to add stock symbol to your watchlist and to view watchlist. |
12Stocks.com List of ETFs that track Smallcap Index
| Ticker | ETF Name | Watchlist | Recent Price | Smart Investing & Trading Score | Change % | Week % | Year-to-date % |
| IWM | iShares Russell 2000 | | 204.74 | 70 | 0.21 | 0.21 | 2.01% |
| IJR | iShares Core S&P Small-Cap | | 109.31 | 90 | 0.30 | 0.3 | 0.98% |
| VTWO | Vanguard Russell 2000 ETF | | 82.76 | 65 | 0.16 | 0.16 | 2.05% |
| IWN | iShares Russell 2000 Value | | 156.30 | 83 | 0.07 | 0.07 | 0.62% |
| IWO | iShares Russell 2000 Growth | | 260.53 | 52 | 0.23 | 0.23 | 3.29% |
| IJS | iShares S&P Small-Cap 600 Value | | 100.95 | 77 | 0.43 | 0.43 | -2.06% |
| IJT | iShares S&P Small-Cap 600 Growth | | 129.96 | 85 | 0.08 | 0.08 | 3.85% |
| XSLV | PowerShares S&P SmallCap Low Volatil ETF | | 44.51 | 95 | 0.63 | 0.63 | 0.82% |
| SMLV | SPDR SSGA US Small Cap Low Volatil ETF | | 111.41 | 90 | 0.17 | 0.17 | -0.99% |
| SDD | ProShares UltraShort SmallCap600 | | 18.16 | 20 | -0.68 | -0.68 | -1.47% |
| SAA | ProShares Ultra SmallCap600 | | 24.61 | 90 | 1.07 | 1.07 | -1.36% |
| SBB | ProShares Short SmallCap600 | | 15.90 | 10 | -0.37 | -0.37 | -0.21% |
| 12Stocks.com: Charts, Trends, Fundamental Data and Performances of SmallCap Stocks | |
|
We now take in-depth look at all SmallCap stocks including charts, multi-period performances and overall trends (as measured by Smart Investing & Trading Score). One can sort SmallCap stocks (click link to choose) by Daily, Weekly and by Year-to-Date performances. Also, one can sort by size of the company or by market capitalization. |
| Select Your Default Chart Type: | |||||
| |||||
| Click on stock symbol or name for detailed view. Click on to add stock symbol to your watchlist and to view watchlist. Quick View: Move mouse or cursor over "Daily" to quickly view daily technical stock chart and over "Weekly" to view weekly technical stock chart. | |||||

 | BKKT Bakkt Holdings, Inc. |
| Sector: Technology | |
| SubSector: Software - Infrastructure | |
| MarketCap: 335 Millions | |
| Recent Price: 9.98 Smart Investing & Trading Score: 83 | |
| Day Percent Change: 1.42% Day Change: 0.14 | |
| Week Change: 1.42% Year-to-date Change: 347.5% | |
| BKKT Links: Profile News Message Board | |
| Charts:- Daily , Weekly | |
| Add BKKT to Watchlist: View: Get Complete BKKT Trend Analysis ➞ | |
 | TRNS Transcat, Inc. |
| Sector: Technology | |
| SubSector: Scientific & Technical Instruments | |
| MarketCap: 216.653 Millions | |
| Recent Price: 118.60 Smart Investing & Trading Score: 100 | |
| Day Percent Change: 1.41% Day Change: 1.65 | |
| Week Change: 1.41% Year-to-date Change: 8.5% | |
| TRNS Links: Profile News Message Board | |
| Charts:- Daily , Weekly | |
| Add TRNS to Watchlist: View: Get Complete TRNS Trend Analysis ➞ | |
 | THRD Third Harmonic Bio, Inc. |
| Sector: Health Care | |
| SubSector: Biotechnology | |
| MarketCap: 190 Millions | |
| Recent Price: 12.06 Smart Investing & Trading Score: 76 | |
| Day Percent Change: 1.34% Day Change: 0.16 | |
| Week Change: 1.34% Year-to-date Change: 9.5% | |
| THRD Links: Profile News Message Board | |
| Charts:- Daily , Weekly | |
| Add THRD to Watchlist: View: Get Complete THRD Trend Analysis ➞ | |
 | MRC MRC Global Inc. |
| Sector: Energy | |
| SubSector: Oil & Gas Equipment & Services | |
| MarketCap: 364.061 Millions | |
| Recent Price: 13.85 Smart Investing & Trading Score: 100 | |
| Day Percent Change: 1.32% Day Change: 0.18 | |
| Week Change: 1.32% Year-to-date Change: 25.8% | |
| MRC Links: Profile News Message Board | |
| Charts:- Daily , Weekly | |
| Add MRC to Watchlist: View: Get Complete MRC Trend Analysis ➞ | |
 | GNE Genie Energy Ltd. |
| Sector: Energy | |
| SubSector: Independent Oil & Gas | |
| MarketCap: 177.293 Millions | |
| Recent Price: 15.37 Smart Investing & Trading Score: 42 | |
| Day Percent Change: 1.32% Day Change: 0.20 | |
| Week Change: 1.32% Year-to-date Change: -45.4% | |
| GNE Links: Profile News Message Board | |
| Charts:- Daily , Weekly | |
| Add GNE to Watchlist: View: Get Complete GNE Trend Analysis ➞ | |
 | CHUY Chuy s Holdings, Inc. |
| Sector: Services & Goods | |
| SubSector: Restaurants | |
| MarketCap: 159.17 Millions | |
| Recent Price: 28.45 Smart Investing & Trading Score: 10 | |
| Day Percent Change: 1.25% Day Change: 0.35 | |
| Week Change: 1.25% Year-to-date Change: -25.6% | |
| CHUY Links: Profile News Message Board | |
| Charts:- Daily , Weekly | |
| Add CHUY to Watchlist: View: Get Complete CHUY Trend Analysis ➞ | |
 | WVE Wave Life Sciences Ltd. |
| Sector: Health Care | |
| SubSector: Biotechnology | |
| MarketCap: 452.785 Millions | |
| Recent Price: 5.69 Smart Investing & Trading Score: 58 | |
| Day Percent Change: 1.25% Day Change: 0.07 | |
| Week Change: 1.25% Year-to-date Change: 12.7% | |
| WVE Links: Profile News Message Board | |
| Charts:- Daily , Weekly | |
| Add WVE to Watchlist: View: Get Complete WVE Trend Analysis ➞ | |
 | ATEN A10 Networks, Inc. |
| Sector: Technology | |
| SubSector: Communication Equipment | |
| MarketCap: 363.739 Millions | |
| Recent Price: 15.71 Smart Investing & Trading Score: 90 | |
| Day Percent Change: 1.22% Day Change: 0.19 | |
| Week Change: 1.22% Year-to-date Change: 19.3% | |
| ATEN Links: Profile News Message Board | |
| Charts:- Daily , Weekly | |
| Add ATEN to Watchlist: View: Get Complete ATEN Trend Analysis ➞ | |
 | LXFR Luxfer Holdings PLC |
| Sector: Industrials | |
| SubSector: Diversified Machinery | |
| MarketCap: 406.716 Millions | |
| Recent Price: 11.74 Smart Investing & Trading Score: 85 | |
| Day Percent Change: 1.21% Day Change: 0.14 | |
| Week Change: 1.21% Year-to-date Change: 31.3% | |
| LXFR Links: Profile News Message Board | |
| Charts:- Daily , Weekly | |
| Add LXFR to Watchlist: View: Get Complete LXFR Trend Analysis ➞ | |
 | IMMR Immersion Corporation |
| Sector: Technology | |
| SubSector: Application Software | |
| MarketCap: 173.462 Millions | |
| Recent Price: 8.40 Smart Investing & Trading Score: 100 | |
| Day Percent Change: 1.20% Day Change: 0.10 | |
| Week Change: 1.2% Year-to-date Change: 19.0% | |
| IMMR Links: Profile News Message Board | |
| Charts:- Daily , Weekly | |
| Add IMMR to Watchlist: View: Get Complete IMMR Trend Analysis ➞ | |
 | CARS Cars.com Inc. |
| Sector: Services & Goods | |
| SubSector: Auto Dealerships | |
| MarketCap: 290.321 Millions | |
| Recent Price: 17.81 Smart Investing & Trading Score: 62 | |
| Day Percent Change: 1.19% Day Change: 0.21 | |
| Week Change: 1.19% Year-to-date Change: -6.1% | |
| CARS Links: Profile News Message Board | |
| Charts:- Daily , Weekly | |
| Add CARS to Watchlist: View: Get Complete CARS Trend Analysis ➞ | |
 | ASPN Aspen Aerogels, Inc. |
| Sector: Industrials | |
| SubSector: General Building Materials | |
| MarketCap: 150.153 Millions | |
| Recent Price: 27.33 Smart Investing & Trading Score: 90 | |
| Day Percent Change: 1.18% Day Change: 0.32 | |
| Week Change: 1.18% Year-to-date Change: 73.2% | |
| ASPN Links: Profile News Message Board | |
| Charts:- Daily , Weekly | |
| Add ASPN to Watchlist: View: Get Complete ASPN Trend Analysis ➞ | |
 | QSI Quantum-Si incorporated |
| Sector: Health Care | |
| SubSector: Biotechnology | |
| MarketCap: 256 Millions | |
| Recent Price: 1.72 Smart Investing & Trading Score: 41 | |
| Day Percent Change: 1.18% Day Change: 0.02 | |
| Week Change: 1.18% Year-to-date Change: -14.4% | |
| QSI Links: Profile News Message Board | |
| Charts:- Daily , Weekly | |
| Add QSI to Watchlist: View: Get Complete QSI Trend Analysis ➞ | |
 | ANGO AngioDynamics, Inc. |
| Sector: Health Care | |
| SubSector: Medical Instruments & Supplies | |
| MarketCap: 370.86 Millions | |
| Recent Price: 6.12 Smart Investing & Trading Score: 95 | |
| Day Percent Change: 1.16% Day Change: 0.07 | |
| Week Change: 1.16% Year-to-date Change: -21.9% | |
| ANGO Links: Profile News Message Board | |
| Charts:- Daily , Weekly | |
| Add ANGO to Watchlist: View: Get Complete ANGO Trend Analysis ➞ | |
 | DLTH Duluth Holdings Inc. |
| Sector: Services & Goods | |
| SubSector: Apparel Stores | |
| MarketCap: 180.008 Millions | |
| Recent Price: 4.37 Smart Investing & Trading Score: 59 | |
| Day Percent Change: 1.16% Day Change: 0.05 | |
| Week Change: 1.16% Year-to-date Change: -18.8% | |
| DLTH Links: Profile News Message Board | |
| Charts:- Daily , Weekly | |
| Add DLTH to Watchlist: View: Get Complete DLTH Trend Analysis ➞ | |
 | FFWM First Foundation Inc. |
| Sector: Financials | |
| SubSector: Regional - Midwest Banks | |
| MarketCap: 457.17 Millions | |
| Recent Price: 5.33 Smart Investing & Trading Score: 20 | |
| Day Percent Change: 1.14% Day Change: 0.06 | |
| Week Change: 1.14% Year-to-date Change: -44.9% | |
| FFWM Links: Profile News Message Board | |
| Charts:- Daily , Weekly | |
| Add FFWM to Watchlist: View: Get Complete FFWM Trend Analysis ➞ | |
 | MRNS Marinus Pharmaceuticals, Inc. |
| Sector: Health Care | |
| SubSector: Biotechnology | |
| MarketCap: 222.885 Millions | |
| Recent Price: 1.35 Smart Investing & Trading Score: 15 | |
| Day Percent Change: 1.13% Day Change: 0.01 | |
| Week Change: 1.13% Year-to-date Change: -87.6% | |
| MRNS Links: Profile News Message Board | |
| Charts:- Daily , Weekly | |
| Add MRNS to Watchlist: View: Get Complete MRNS Trend Analysis ➞ | |
 | CPS Cooper-Standard Holdings Inc. |
| Sector: Consumer Staples | |
| SubSector: Auto Parts | |
| MarketCap: 184.339 Millions | |
| Recent Price: 14.71 Smart Investing & Trading Score: 58 | |
| Day Percent Change: 1.10% Day Change: 0.16 | |
| Week Change: 1.1% Year-to-date Change: -24.7% | |
| CPS Links: Profile News Message Board | |
| Charts:- Daily , Weekly | |
| Add CPS to Watchlist: View: Get Complete CPS Trend Analysis ➞ | |
 | HRI Herc Holdings Inc. |
| Sector: Transports | |
| SubSector: Rental & Leasing Services | |
| MarketCap: 469.344 Millions | |
| Recent Price: 158.14 Smart Investing & Trading Score: 87 | |
| Day Percent Change: 1.05% Day Change: 1.65 | |
| Week Change: 1.05% Year-to-date Change: 6.2% | |
| HRI Links: Profile News Message Board | |
| Charts:- Daily , Weekly | |
| Add HRI to Watchlist: View: Get Complete HRI Trend Analysis ➞ | |
 | PGC Peapack-Gladstone Financial Corporation |
| Sector: Financials | |
| SubSector: Regional - Northeast Banks | |
| MarketCap: 284.399 Millions | |
| Recent Price: 23.29 Smart Investing & Trading Score: 59 | |
| Day Percent Change: 1.04% Day Change: 0.24 | |
| Week Change: 1.04% Year-to-date Change: -21.9% | |
| PGC Links: Profile News Message Board | |
| Charts:- Daily , Weekly | |
| Add PGC to Watchlist: View: Get Complete PGC Trend Analysis ➞ | |
 | ZIMV ZimVie Inc. |
| Sector: Health Care | |
| SubSector: Medical Devices | |
| MarketCap: 303 Millions | |
| Recent Price: 16.82 Smart Investing & Trading Score: 68 | |
| Day Percent Change: 1.02% Day Change: 0.17 | |
| Week Change: 1.02% Year-to-date Change: -5.1% | |
| ZIMV Links: Profile News Message Board | |
| Charts:- Daily , Weekly | |
| Add ZIMV to Watchlist: View: Get Complete ZIMV Trend Analysis ➞ | |
 | QTRX Quanterix Corporation |
| Sector: Health Care | |
| SubSector: Biotechnology | |
| MarketCap: 448.685 Millions | |
| Recent Price: 16.86 Smart Investing & Trading Score: 59 | |
| Day Percent Change: 0.96% Day Change: 0.16 | |
| Week Change: 0.96% Year-to-date Change: -38.3% | |
| QTRX Links: Profile News Message Board | |
| Charts:- Daily , Weekly | |
| Add QTRX to Watchlist: View: Get Complete QTRX Trend Analysis ➞ | |
 | LLAP Terran Orbital Corporation |
| Sector: Industrials | |
| SubSector: Aerospace & Defense | |
| MarketCap: 206 Millions | |
| Recent Price: 1.05 Smart Investing & Trading Score: 42 | |
| Day Percent Change: 0.96% Day Change: 0.01 | |
| Week Change: 0.96% Year-to-date Change: -8.3% | |
| LLAP Links: Profile News Message Board | |
| Charts:- Daily , Weekly | |
| Add LLAP to Watchlist: View: Get Complete LLAP Trend Analysis ➞ | |
 | CCRN Cross Country Healthcare, Inc. |
| Sector: Services & Goods | |
| SubSector: Staffing & Outsourcing Services | |
| MarketCap: 348.328 Millions | |
| Recent Price: 15.07 Smart Investing & Trading Score: 0 | |
| Day Percent Change: 0.94% Day Change: 0.14 | |
| Week Change: 0.94% Year-to-date Change: -33.4% | |
| CCRN Links: Profile News Message Board | |
| Charts:- Daily , Weekly | |
| Add CCRN to Watchlist: View: Get Complete CCRN Trend Analysis ➞ | |
 | SGHT Sight Sciences, Inc. |
| Sector: Health Care | |
| SubSector: Medical Devices | |
| MarketCap: 381 Millions | |
| Recent Price: 5.42 Smart Investing & Trading Score: 51 | |
| Day Percent Change: 0.93% Day Change: 0.05 | |
| Week Change: 0.93% Year-to-date Change: 4.9% | |
| SGHT Links: Profile News Message Board | |
| Charts:- Daily , Weekly | |
| Add SGHT to Watchlist: View: Get Complete SGHT Trend Analysis ➞ | |
| For tabular summary view of above stock list: Summary View ➞ 0 - 25 , 25 - 50 , 50 - 75 , 75 - 100 , 100 - 125 , 125 - 150 , 150 - 175 , 175 - 200 , 200 - 225 , 225 - 250 , 250 - 275 , 275 - 300 , 300 - 325 , 325 - 350 , 350 - 375 , 375 - 400 , 400 - 425 , 425 - 450 , 450 - 475 , 475 - 500 , 500 - 525 | ||
| Click To Change The Sort Order: By Market Cap or Company Size Performance: Year-to-date, Week and Day | |
| Select Chart Type: | ||
| Too many stocks? View smallcap stocks filtered by marketcap & sector |
| Marketcap: All SmallCap Stocks (default-no microcap), Large, Mid-Range, Small & MicroCap |
| Sector: Tech, Finance, Energy, Staples, Retail, Industrial, Materials, Utilities & Medical |
|
Best Stocks Today 12Stocks.com |
© 2024 12Stocks.com Terms & Conditions Privacy Contact Us
All Information Provided Only For Education And Not To Be Used For Investing or Trading. See Terms & Conditions


One More Thing ... Get Best Stocks Delivered Daily!
Never Ever Miss A Move With Our Top Ten Stocks Lists
Find Best Stocks In Any Market - Bull or Bear Market
Take A Peek At Our Top Ten Stocks Lists: Daily, Weekly, Year-to-Date & Top Trends
Find Best Stocks In Any Market - Bull or Bear Market
Take A Peek At Our Top Ten Stocks Lists: Daily, Weekly, Year-to-Date & Top Trends
Smallcap Stocks With Best Up Trends [0-bearish to 100-bullish]: Novavax [100], Emergent BioSolutions[100], Verrica [100], iRobot [100], Trupanion [100], Humacyte [100], AMC s[100], Squarespace [100], Twist Bioscience[100], Redfin [100], Guardant Health[100]
Best Smallcap Stocks Year-to-Date:
CareMax [500%], Janux [365.24%], Bakkt [347.53%], Viking [288.82%], Alpine Immune[241.12%], Longboard [226.19%], Avidity Biosciences[187.83%], Sweetgreen [186.37%], Super Micro[175.37%], Novavax [173.13%], Vera [163.24%] Best Smallcap Stocks This Week:
Novavax [47.64%], MacroGenics [32.33%], Emergent BioSolutions[23.22%], Allbirds [20.23%], Omega [20.15%], SunPower [19.57%], Verrica [19.5%], iRobot [19.43%], Trupanion [19.26%], Humacyte [16.6%], FiscalNote [16.54%] Best Smallcap Stocks Daily:
Novavax [47.64%], MacroGenics [32.33%], Emergent BioSolutions[23.22%], Allbirds [20.23%], Omega [20.15%], SunPower [19.57%], Verrica [19.50%], iRobot [19.43%], Trupanion [19.26%], Humacyte [16.60%], FiscalNote [16.54%]